Contents lists available atScienceDirect
Ecological Economics
journal homepage:www.elsevier.com/locate/ecolecon
Analysis
Do forest-management plans and FSC certification help avoid deforestation
in the Congo Basin?
Isabelle Tritsch
a, Gwenolé Le Velly
b, Benoit Mertens
a, Patrick Meyfroidt
c,d, Christophe Sannier
e,
Jean-Sylvestre Makak
f, Kenneth Houngbedji
g,⁎aUMR228 ESPACE-DEV, Institut de Recherche pour le Développement (IRD), Montpellier, France
bCenter for Environmental Economics - Montpellier (CEEM), Université Montpellier, CNRS, INRA, Montpellier SupAgro, Montpellier, France cGeorges Lemaitre Centre for Earth and Climate Research, Earth and Life Institute, Université Catholique Louvain, Louvain-la-Neuve, Belgium dFonds de la recherche scientifique - F.R.S.-FNRS, Brussels, Belgium
eSIRS, Lille, France
fGeospatial Company (GEOCOM), Libreville, Gabon
gDIAL, LEDA, Université Paris-Dauphine, IRD, Université PSL, 75016 Paris, France
A R T I C L E I N F O JEL classification: C21 Q23 Q56 Q58 Keywords:
Forest Management Plan FSC Certification Deforestation Matching Congo Basin
A B S T R A C T
To allow for the production of timber while preserving conservation values, forestry regulations in the Congo Basin have made Forest Management Plans (FMP) mandatory in logging concessions. This paper uses original high-resolution maps of forest-cover changes and official records on the activities of logging concessions to analyze the impact of FMP on deforestation in this region. We apply quasi-experimental and difference-in-difference approaches to evaluate the change in deforestation in concessions managed under an approved FMP. We find that between 2000 and 2010, deforestation was 74% lower in concessions with an FMP compared to others. Building on a theory of change, further analyses revealed that this decrease in deforestation takes time to occur and is highest around communities located in and nearby logging concessions, and in areas close to previous deforestation. These findings suggest that FMP help avoid deforestation by allowing logging companies to rotate cycles of timber extraction, thereby avoiding the overexploitation of areas that were previously logged, and by the better regulation of access to concessions by closing former logging roads to limit illegal activities such as shifting agriculture, hunting and the illegal harvest of timber or fuel-wood.
1. Introduction
About 400 million hectares of natural tropical forest are devoted to timber production (Blaser et al., 2011). Ensuring the sustainable ex-ploitation of these forests is a crucial challenge, as they are a key factor for biodiversity, carbon sequestration and the global climate. In the Congo Basin, the second-largest tropical forest after the Amazon, with an area of about 178 million ha of dense humid forests (Mayaux et al., 2013), almost one third of forests are productive in terms of logging exploitation. Hence, national forestry regulations have made Forest Management Plans (FMP) mandatory in logging concessions to ensure the sustainable exploitation of these forests. In principle, the FMP seek sustainable timber production that limits deforestation and guarantees the preservation of forest resources, biodiversity and ecosystem ser-vices, while contributing to local socio-economic development (Nasi et al., 2012). FMP promote that the forestry operations are done with
the least possible damage to the residual forest stand and allow forest regeneration, so that the logging companies can return to the same area after one rotation – usually 25 to 30 years – and harvest again (Bertrand et al., 1999a, 1999b;Fargeot et al., 2004). For these reasons, and be-cause of the extent of forest areas covered, FMP are often considered as a major contribution to tropical forest conservation worldwide, and have been supported by international organizations and non-govern-mental organizations (NGO) (Clark et al., 2009;Lambin et al., 2014). However, in practice, the design and implementation of FMP have been very heterogeneous among countries and logging concessions (Cerutti et al., 2008) and the question of FMP sustainability is still under debate (Brandt et al., 2016, 2018;Karsenty et al., 2017).
From that perspective, the theoretical impact of FMP on deforesta-tion is ambiguous and there is relatively scant empirical work that document the extent of forest cover change in logging concessions with an FMP.Cerutti et al. (2017)showed that FMP in Cameroon between
https://doi.org/10.1016/j.ecolecon.2020.106660
Received 19 April 2019; Received in revised form 4 February 2020; Accepted 25 March 2020 ⁎Corresponding author at: DIAL-LEDa, 4 Rue d'Enghien, 75010 Paris, France.
E-mail address:[email protected](K. Houngbedji).
Available online 21 May 2020
0921-8009/ © 2020 The Authors. Published by Elsevier B.V. This is an open access article under the CC BY-NC-ND license (http://creativecommons.org/licenses/BY-NC-ND/4.0/).
1998 and 2009 effectively reduced carbon emissions from logging op-erations due to the reduced volumes of timber harvested, as imposed by the FMP, while presenting logging companies with acceptable financial trade-offs. In contrast,Brandt et al. (2016)found that concessions with FMP in the Congo, compared to otherwise similar concessions without, were associated with greater deforestation. Further analyses suggested that, greater timber production driven by increased foreign capital and international demand contributed to greater deforestation in the six concessions with FMP in the Congo (Brandt et al., 2016, 2014). This led to a controversy between Karsenty et al. (2017) and Brandt et al. (2018), emphasizing the need for more empirical work to understand whether and under which conditions FMP affect deforestation.
While there is a paucity of work on the effects of FMP, somewhat more attention has been given to Forest Stewardship Council (FSC) certification: a voluntary market-based approach which goes beyond the approval of FMP by national forestry regulators and promotes a responsible management of the world's forests certified by a third non governmental party. With a wide range of social and environmental issues covered by FSC standards, avoiding tropical deforestation re-mains a central FSC objective, and a number of empirical contributions have looked at the impact of FSC certification on deforestation (e.g. Blackman et al., 2018;Heilmayr and Lambin, 2016;Miteva et al., 2015; Panlasigui et al., 2018;Rana and Sills, 2018;Rico et al., 2018).Komives et al. (2018)provide a thorough review of the studies that present the most convincing evidence of the effects of FSC certification on defor-estation and concluded that, with the exception of Heilmayr and Lambin (2016), the emerging body of studies (i.e.Blackman et al., 2018; Panlasigui et al., 2018;Rico et al., 2018) provides increasing evidence of non-impact of FSC on measured rates of forest-cover change. Though Heilmayr and Lambin (2016) found that FSC certification effectively reduced deforestation in Chile, studies in Cameroon (Panlasigui et al., 2018) and Peru (Rico et al., 2018) have found small effects (< 0.1%) of FSC certification on reduced deforestation, andBlackman et al. (2018) found no significant impact of FSC on forest cover loss in Mexico.
Since FMP and FSC certification promote sustainable management of the logging concessions over longer time horizon, other studies ar-gued that, like land zoning, they protect the forest from competing uses that encourage deforestation (Angelsen, 2010). Bruggeman et al. (2015)tested that prediction in Cameroon and found that, compared to forest outside zoning, deforestation rate was smaller in logging con-cessions.
Overall, documenting the impact of FMP and FSC on deforestation in the Congo Basin is an active research area. The results from similar policy interventions in Asia and South America suggest that the effects are weak, context-dependent, and could therefore not be reproduced in different settings. As reducing deforestation in low-income countries is arguably one of the most cost-effective ways of reducing global CO2 emissions (Barker et al., 2007;Stern, 2006), this paper seeks to evaluate the average effect on deforestation of the legal requirement that con-cessions across countries in the Congo Basin have an approved FMP. More particularly, we check whether approval of FMP by national forestry regulators affects deforestation within concessions with FMP. However, since approval of an FMP does not necessarily imply its ef-fective implementation (Cerutti et al., 2008;Karsenty et al., 2017), our study does not provide a measure of the average effect of the im-plementation of FMP on deforestation. Conversely, logging concessions with FSC certificate are more likely to implement their FMP. Hence, we also document the average effect of FSC certification on deforestation in concessions with FSC certificates in the Congo Basin, and study some of the underlying mechanisms explaining whether and how FMP work (Baylis et al., 2016;Miteva et al., 2012).
To provide an empirical estimate of the impact of FMP approval and FSC certification in the Congo Basin, we use original high-resolution maps of forest cover change in Cameroon, Congo, Gabon and the Central African Republic (CAR) over the 1990–2000 and 2000–2010 periods. The geographic area does not include the Democratic Republic
of Congo, where FMP were initiated later. The deforestation maps are complemented with relevant detailed information on the location and extent of logging concessions, including the timing of the official ap-proval of their FMP and FSC certification. To estimate the impact of FMP approval and FSC certificates, we use quasi-experimental methods whereby the logging concessions with approved FMP or an FSC certi-ficate issued before 2010 are compared to their peers that had not approved their FMP yet but had otherwise similar observable char-acteristics known to affect deforestation.
Even though the concessions with approved FMP or an FSC certi-ficate in the Congo Basin were not randomly chosen, the approach used in this work will likely produce unbiased estimates of forest cover change within concessions that is attributable to FMP approval or issuance of FSC certificate for at least two reasons. First, since the 1990's, Cameroon, Congo, CAR and Gabon have all implemented re-forms mandating logging companies to adopt FMP (Karsenty, 2007). FMP were then gradually implemented in the 2000s, albeit in a context of uncertain incentives and environmental governance. By 2010, one-third of the concessions in the study area had an accepted FMP. FSC certification is more recent in the region, starting only in 2005. In this context of slow but progressive production and approval of FMP and imperfect compliance with forestry law, it is likely to match otherwise-similar concessions with and without FMP, which is a key requirement for unbiased quasi-experimental analysis. Second, even though national policies aiming to impose FMP adoption have been discussed since the 1990s, the first logging concessions with FMP appeared in the early 2000s in the Congo Basin. Since we can also measure deforestation between 1990 and 2000, we fine-tune our estimates of the FMP impact on logging concessions by correcting for pre-existing differences in deforestation rates between early and late FMP adopters in the Congo Basin. Last, we test the robustness of the results and replicate our analysis using the widely-used Global Forest Change (GFC) dataset (Hansen et al., 2013) over the 2000–2010 period. By doing so, we add to existing empirical work on the impact of FMP on deforestation by considering a large sample of logging concessions covering the whole Congo Basin – except the Democratic Republic of Congo (DRC).
The remainder of the paper is organized as follows. InSection 2we present background information on FMP and the theoretical framework behind their potential deforestation effects in the Congo Basin.Section 3then describes the main datasets used, and Section 4outlines the empirical strategy used to explore the causal impact of FMP on defor-estation. Section 5 presents the main results, their robustness to methodological choices, then explores the channels underlying the link between FMP and deforestation. Last,Section 6discusses the limita-tions and implicalimita-tions of our work before offering some concluding observations.
2. Background and theoretical framework
In the Congo Basin, most forested areas are State-owned, and ex-ploitation permits are granted to private logging companies for periods of 15 to 30 years (except for CAR where logging permits can span over a 100-year period) under concession regimes, providing long-term re-source-extraction rights in exchange for a stream of revenues (Agrawal et al., 2008). In this context FMP, if properly designed and im-plemented, could be considered as a tool for sustainable forest man-agement, combining timber production, local development and con-servation values in the Congo Basin (ATIBT, 2007).
2.1. Forest-management plans in the Congo Basin
FMP in a concession involve a range of environmental and social issues. In theory, FMP evaluate the potentialities of the resource and assess the trade-offs among the ecological, economic and social aspects of forest management to propose balanced options (Cerutti et al., 2017). For this, they are based on forest inventories describing the
distribution of tree species and their characteristics. Associated with ecological and social studies (e.g., on fauna and on the forest uses of local communities), these inventories allow dividing each concession into management series areas according to different objectives of forest resources uses.
The production series are divided into annual cutting areas, for which the FMP presents a detailed plan for selective logging over a specific time period. This plan aims to optimize the exploitation of timber, while ensuring the partial regeneration of forest species in order to guarantee the viability of the next logging cycle (the usual rotation time is between 25 and 30 years). The conservation series are areas protected from logging activities and designed to preserve seed trees and the most vulnerable areas like steep slopes and riversides. Concerning local communities, logging companies need to engage with communities in and around the concession to ensure the coexistence of different forest uses and to encourage them to carry out sustainable natural-resource management, in particular regarding hunting and agriculture. Where villages are included inside concessions, community-management series are defined (ATIBT, 2007; Nkeoua, 2003). Moreover, for local devel-opment, forestry laws impose to logging companies specific forest taxation and services development such as building wood-processing facilities (sawmills) that employ local workers. In addition to that, FMP require that logging companies prepare and sign “social contracts” (cahier des charges), which define the terms of benefits redistribution and investments for local infrastructure (ATIBT, 2007). Finally, FMP include reduced-impact logging (RIL) practices and facilitate checks on operating activities by regulators (Cerutti et al., 2008; de Blas and Pérez, 2008;Karsenty et al., 2008;Putz et al., 2008b).
In all of the Congo Basin countries except the CAR,1the FMP is
elaborated by the logging company on the basis of national standards and under the control of forest administrations. After the attribution of forest concessions, logging companies can start logging immediately but have to prepare their FMP within a maximum of three years. The FMP is then reviewed by the forest administration, which evaluates the quality of the plan and either approves it or sends it back to the com-pany with a request for review. In practice, this three-year period is poorly-respected.2Moreover, FMP may not deliver the expected
out-comes. First, logging companies are responsible for the drafting of the FMP, which will therefore correspond to the one which best fit their strategy: the FMP proposed by the owner of the logging concession will reflect the relative weight they put on conservation and economic outcomes (Cerutti et al., 2017). Second, the fact that an FMP has been officially-approved is neither a quality guarantee nor an indication of its effective implementation on the ground (Cerutti et al., 2008; Karsenty et al., 2017).
2.2. FSC certification to enhance efforts toward sustainable forest management
To show their commitment toward sustainable forest management, logging companies with an approved FMP can apply to voluntary cer-tification schemes such as the Forest Stewardship Council (FSC). This is a voluntary, market-based approach to enhancing sustainable forest management. In FSC certified concession, logging companies commit to comply to FSC standards, which aim to promote “environmentally ap-propriate, socially beneficial and economically viable management of
the world's forests” (FSC, 2019). In return, the FSC label on the forest's products is expected to be beneficial in terms of market access and share, and higher prices (Romero et al., 2017). For certification, logging companies commit to adhere to the ten international FSC principles and twelve criteria, covering social aspects such as workers' rights and employment conditions, and environmental aspects, including diverse measures of forest-management planning and monitoring similar to those that are supposed to appear in their FMP. Independent certifying bodies audit concessions prior to certification to determine their con-formity to the FSC criteria: they then provide certificate for five years, during which they carry out annual concession inspections to ensure their continued compliance (FSC, 2019).
In the context of institutions in developing countries, where reg-ulators have limited resources to enforce compliance to Forestry Law and FMP, this third-party verification should provide additional guar-antees that logging companies have effectively adopted sustainable forest-management practices and respect their FMP in their certified concessions (Blackman et al., 2018). For this reason, regarding the environmental aspects of forest management, the added value of the FSC is mainly to avoid FMP that only reflect economic criteria or apply only on paper, with few, or no, measures implemented in practice. 2.3. Theory of change
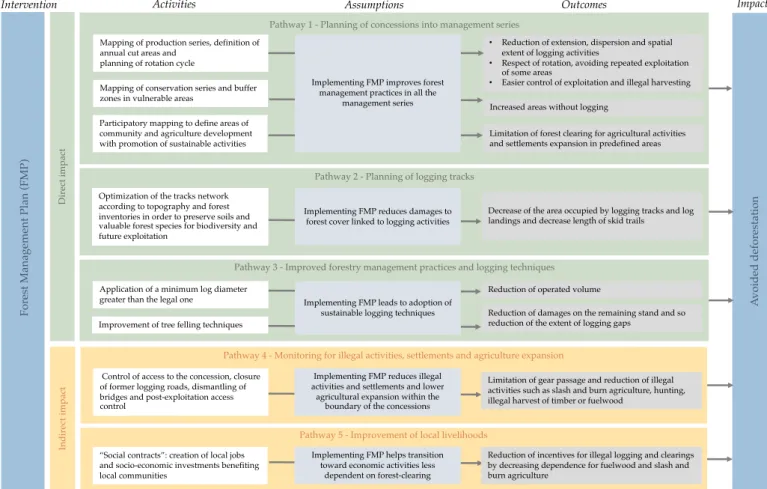
To mitigate climate change, Governments of Cameroon, CAR, Congo and Gabon intend to promote forest management plans to reduce GHG emissions from logging companies (seeRépublique du Congo, 2015; République Centrafricaine, 2015; République du Cameroun, 2016; République Gabonaise, 2015). Given the extent of forest areas covered by logging companies, we seek to document whether promoting ap-proval of FMP in the Congo Basin is on average an effective mean to reduce emissions from deforestation in the region. Since FMP and FSC certification objectives are much broader than reducing deforestation, we build a model of how these interventions are expected to affect deforestation (e.g. Blackman et al., 2018; Meyfroidt et al., 2018; Romero et al., 2017;Romero and Putz, 2018) and measure the average effect of FMP approval on deforestation in the Congo Basin. Fig. 1 summarizes the theory of change through which we hypothesize that FMP and FSC certification could reduce deforestation in logging con-cessions.
Five main causal pathways relating forest management to defor-estation are identified. Three of them are directly under the control of the logging companies: (i) planning of concession through the creation of management series; (ii) planning of logging tracks, log landings and skid trails and (iii) improved forestry-management practices and log-ging techniques. The next two are indirect pathways linked to third person activities: (iv) monitoring of the concession for limiting the expansion of settlement, agriculture and illegal activities; and (v) provement of the livelihoods of local communities. In a context of im-perfect governance, it is likely that what remains under the company direct control is more likely to be implemented than what the company does not have under its direct control. Moreover, as discussed below, these different pathways implicitly assume various time horizons ap-plicable to the theoretical impacts which are detailed above (ATIBT, 2007;Cerutti et al., 2017;de Blas and Pérez, 2008;Putz et al., 2008a). First, FMP should allow logging companies to plan their activity over time and space: through the forest inventories, they can divide their concession into production and conservation series. Moreover, participatory mapping activities with local communities should help identify the areas of the concession devoted to community development and small-scale agriculture (ATIBT, 2007). These activities could help reduce deforestation in different ways. In production series, rotation planning and the definition of annual cut areas should reduce the ex-pansion, dispersion and sprawl of logging activities, while ensuring that the forest remains undisturbed between exploitation cycles, thereby reducing the repeated exploitation of the same areas. In addition, the 1The CAR is the only country in the Congo Basin where a public structure
carries out the FMP for logging companies, mainly because the CAR has since 2000 benefited from a support project for the implementation of FMP (the PARPAF project financed by the AFD).
2The database of the World Resource Institute on the attributes of logging concessions in the study area estimates that there is on average 9 years between the date when the exploitation permit is issued and the approval date of the FMP. Moreover, only 5% of logging concessions have received an approved FMP less than 3 years following the issuance of their exploitation permit.
definition of conservation series and buffer zones in more vulnerable areas should increase the area that is not logged – thus without new logging roads and logging disturbance (e.g.Durrieu De Madron et al., 2011). Last, in concessions that are inhabited and provide livelihood to local populations, the definition of community-management series should limit forest clearing for agricultural activities and settlement expansion in predefined areas (ATIBT, 2007).
Second, FMP should include the planning of logging tracks, log landings and skid trails. The main activity here should be the planning and optimization of the track network according to the topography, forest inventories and the location of annual cut areas in order to pre-serve soil and valuable forest species for biodiversity and future ex-ploitation. The outcomes are to reduce or optimize the areas affected by logging tracks, log landings and skid trails. This is expected to reduce deforestation and the damage to forest cover linked to logging, at least on the longer-term (e.g.Durrieu De Madron et al., 2011).
Third, FMP should include the adoption of a set of improved for-estry-management practices and logging techniques such as: (i) the application of a minimum log diameter (over the legal minimum) that should reduce the volume of timber harvested and the pressure on the most-valuable species and (ii) the improvement of tree-felling techni-ques (controlled or directional tree felling) which should limit the da-mage to the remaining stand linked to tree fall and skidding man-oeuvres. These practices are mostly expected to reduce forest degradation, but should also, to a lesser extent, reduce deforestation by preventing large canopy gaps and tree-felling in sensitive areas that may require long recovery times (Peña-Claros et al., 2008; Pearson et al., 2014;Putz et al., 2008b).
Fourth, FMP should include concession monitoring in order to control the expansion of settlements and agricultural areas, as well as illegal activities. This should include activities for controlling
concession access: the temporary or permanent closure of logging tracks, the dismantling of bridges and post-exploitation access control. This monitoring is expected to limit gear passage and to reduce illegal activities such as slash and burn agriculture, hunting and the illegal harvesting of timber or fuel-wood, which could produce deforestation through forest clearing, repeated forest exploitation or even fire spread (Kleinschroth et al., 2016a, 2016b).
Finally, through the associated social and local development mea-sures, FMP could enhance the livelihoods of those who live and work in and around logging concessions. Improved livelihoods in turn may re-duce the incentives for both illegal and unsustainable logging, and could also reduce clearings by reducing the dependence on fuel-wood and slash and burn agriculture. However, the relationship between li-velihoods and deforestation is complex and, in some cases, improved livelihoods may spur forest-cover change or attract more people (Chomitz and Buys, 2007;Rist et al., 2012), potentially increasing de-forestation (Blackman et al., 2018).
FSC certification should affect deforestation through the same five causal mechanisms as noted above. In addition, FSC certification in-cludes monitoring by independent certifying bodies that assess whether forest management practices comply with FSC standards (seeRomero et al., 2017). These audits should also further enhance monitoring of activities of logging companies by NGO and the media (Blackman et al., 2018). In the context of weak capacity of local governance, the activ-ities of certifying bodies, environmental NGO and the media should result in better implementation of each of pathways outlined above. Hence, to the extent that the enforcement of FMP practices by local regulators in the study area is weak, we may expect that FMP are more likely to be enforced in concessions with an FSC certificates, and find a greater fall in deforestation on the longer term in concessions that are FSC-certified.
By their nature, these mechanisms are likely to produce effects over different time frames and in distinct areas inside concessions. At first, the planning and monitoring of concessions, as well as improved live-lihoods, would likely produce effects that are visible in the short to medium term, mainly in areas close to settlements, the main transport networks and previously-opened logging roads. Second, the adoption of improved forestry-management practices and logging techniques is expected to affect the forest in production series by allowing valuable trees to regenerate, which is expected to produce effects on observable deforestation mostly in a longer time frame. In the same longer time frame, the planning of logging tracks and log landings is expected to affect the forest in production series through the enforcement of annual cut areas. For these reasons, the impact of FMP or FSC certification on deforestation should vary over both time and space within concessions. Since FMP and FSC certification aim at other objectives than avoiding forest cover loss, it is worth noting that their implementation may often present trade-offs with ambiguous effects on deforestation (e.g.Romero et al., 2013). For example, in some circumstances, it might be optimal for a company to allow for efficient access by creating a permanent road network through a concession. While constructing such road network creates forest cover loss on the short term, it will allow the company to rotate timber extraction across production series and may have beneficial effect on deforestation on the longer term. The deforestation induced by road networks should also be reversed as forest are resilient and regenerate along former logging roads (see ecological studies by Gourlet-Fleury et al., 2013; Kleinschroth et al., 2016a, 2016b). Other examples of trade-offs include the temporary deforestation linked to logging gaps: large canopy openings may be needed for some shade-intolerant species to regenerate and, hence, may not be inconsistent with sustainable forest management, even if the deforestation may be higher initially. For these reasons, the theoretical impact of FMP on deforestation is ambiguous and warrants closer em-pirical investigation. While we seek to disentangle the effect of FMP according to different time-frames, we will not be able to distinguish between permanent and temporary deforestation and do not explore the trade-offs discussed above.
3. Data
We use two types of information to evaluate the effect of FMP and FSC certification.
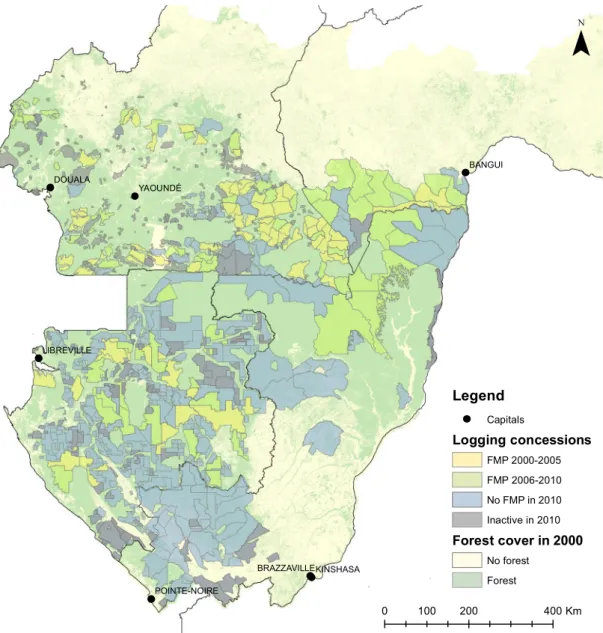
We initially collected detailed information on logging concessions in the study area using the official land-tenure data released by the Central African Forest Observatory (OFAC) and World Resources Institute (WRI) in the “Congo Basin Forest Atlases”. The dataset covers 397 concessions across the four countries under consideration (seeFig. 2) and was updated using the gray literature and information collected on the ground from local actors, especially in the case of concession re-allocation to another logging company during the study period.
The database includes no reliable information that consistently documents the volume of timber extracted each year at the concession level in the study area. Thus, we used the date of issuance of the ex-ploitation permit to identify when a concession is active. Likewise, we do not observe whether a logging concession is implementing an FMP. However, we have detailed information on the date when the FMP of a given concession was approved and used it to identify logging conces-sions with an approved FMP. Since approval of an FMP does not ne-cessarily imply its implementation, the average effect of FMP approval, our measure of interest, is likely to underestimate the average impact of the implementation of FMP in the Congo Basin. Indeed, even though deforestation decreases in concessions that implement their FMP, the effect of FMP approval can be null if most concessions with approved FMP do not effectively implement their FMP on the ground. Unlike possession of an approved FMP, issuance of FSC certificate identifies logging concessions whose practices have been verified and certified by an FSC-accredited external agent. Hence, we used the date of issuance
of FSC certificate, to identify logging concessions that received their FSC certificate on time to implement forestry practices likely to affect forest cover change during the observation period. Other information collected on logging concessions include the physical attributes of their environment (altitude, steepness and biomass), their area, and their proximity to road infrastructures and settlements, which can affect competition over forest resources and management decisions of logging companies (see Table S1 for detailed characteristics of active logging companies included in the study).
The second type of information consists of high-resolution maps of forest cover and forest-cover changes across the Congo Basin. The maps come from two sources. First, we used the original maps produced as part of the global effort to reduce emissions from deforestation and forest degradation in the Congo Basin (see,Fichet et al., 2012, 2014; Sannier et al., 2016, 2014). To quantitatively assess the spatial and temporal dynamics of forest change, the governments of Cameroon, CAR, Congo and Gabon developed national forest-monitoring systems (NFMS). As part of this effort, a number of remote-sensing projects were carried out in each of these countries in close collaboration with the administration in charge of forest monitoring. The resulting maps are based on high-resolution satellite imagery and ground-verification data, and should provide greater cartographic and thematic accuracy than global data (Sannier et al., 2016). Combining these data, we produced homogeneous regional-level maps of forest cover at three points in time (1990, 2000 and 2010) and calculated gross deforestation between these dates (seeTable 1and Fig. S1). Second, for comparison purposes, we use measures of tree-cover loss produced from the Global Forest Change (GFC) dataset (1.0) (Hansen et al., 2013). We calculated tree-cover loss between 2000 and 2010 for two tree-tree-cover thresholds, 30% and 70%. The 30% tree-cover threshold is that used in most forest definitions, but in the case of the countries of the Congo Basin, the 70% tree-cover threshold seems to be more realistic given the forest condi-tions on the ground (Sannier et al., 2016).
Combining the map giving the location and geographical coverage of each logging concession and the existence of either an approved FMP or an FSC certificate to the high-resolution deforestation maps informs about the deforested area over 1990–2000 and 2000–2010 in each concession. However, the direct comparison of the area deforested to time of FMP-approval or FSC certificate-issuance is biased. Indeed, concessions with an approved FMP or an FSC certificate were not randomly drawn. Hence, compared to their peers that had not validated their FMP by 2010, the logging concessions with either an approved FMP or an FSC certificate delivered between 2000 and 2010 differ on many dimensions that are also known to affect deforestation (see Table S2). Therefore, a simple comparison risks attributing the effect of other observable or unobservable concession characteristics to approval of FMP. Moreover, in line with the theory of change, we would like to disentangle the effect of FMP for different time frames taking different definitions of treatment in function of the date of FMP approval.
The next section describes the empirical framework used to address this problem and select concessions based on the likelihood that the effects of their activities contribute to the deforestation measured over the observation periods. We then present the potential-outcomes fra-mework ofRubin (1974)that we use to deal with potential confounders and estimate the deforestation effect of FMP.
4. Empirical framework
In line with the theory of change outlined above, we seek to eval-uate the average effect of FMP-approval or issuance of FSC certificate on deforestation in concessions with approved FMP or FSC certificate. Furthermore, we will study how the average effect of the FMP approval changes across different time frames and look for spatial heterogeneity within and in the neighborhood of forest concessions. The analyses are carried out at the concession level. Hence, the main outcome of interest are measures of forest cover loss during two 10-year periods
(1990–2000 and 2000–2010). 4.1. Treatment groups
The first logging company in the study area had its FMP approved in 1999. To document the average effect of FMP approval and FSC
certification over different time frames, while allowing each compar-ison group to have adequate sample size, we focus on estimating the average the impact of (i) having an FMP approved between 2000 and 2005, (ii) having an FMP approved between 2006 and 2010 and (iii) obtaining an FSC certificate between 2000 and 2010 on deforestation between 2000 and 2010.
Since the potential effects of FMP on deforestation are more likely to appear over the medium to long run, we expect that deforestation be-tween 2000 and 2010 will be lower in the concessions that have had an FMP approved for a longer period. In that vein, we have divided the observation period in half and distinguished between the concessions that received their FMP before 2005 (treatment FMP 2000–2005) and those that had an FMP approved between 2006 and 2010 (treatment FMP 2006–2010).3Since deforestation is measured between 2000 and
2010, treatment FMP 2006–2010 reflects the immediate to very short-term impacts of FMP approval. Indeed, those treated concessions have had their FMP approved for at most four years. In contrast, treatment FMP 2000–2005 include concessions that have had their FMP approved for at least five years between 2000 and 2010 and will help measure the
DOUALA BANGUI YAOUNDÉ KINSHASA LIBREVILLE BRAZZAVILLE POINTE-NOIRE 0 100 200 400Km
Legend
CapitalsLogging concessions
FMP 2000-2005 FMP 2006-2010 No FMP in 2010 Inactive in 2010Forest cover in 2000
No forest ForestFig. 2. Location of concessions in the countries analysed in the Congo Basin. Table 1
Forest cover and forest-cover change in the study area.
Country Period Forest
cover (km2) Deforestedarea (km2) Deforestationrate (%)
Congo 1990–2000 223,554 1375 0.62 2000–2010 233,595 1911 0.82 Gabon 1990–2000 237,242 1025 0.43 2000–2010 236,634 512 0.22 Cameroon 1990–2000 245,396 4790 1.95 2000–2010 241,487 4245 1.76 CAR 1990–2000 98,759 3140 3.18 2000–2010 96,364 2632 2.73 Total 1990–2000 804,951 10,330 1.28 2000–2010 808,080 9300 1.15
3Very few concessions had an accepted FMP in 1999 and our data do not allow us to measure the impact of FMP over longer time periods.
short to medium-term impacts of FMP approval.
In both of these two treatments, the control group is composed of active concessions without an approved FMP. We define a concession as active if it was attributed to a logging company for at least two years for the FMP 2006–2010 treatment (i.e. since 2008) and at least five years for the FMP 2000–2005 treatment (i.e. since 2005, in order to be con-sistent with the treated concessions that, by definition, have all been active since 2005). Therefore, the concessions with no approved FMP (the No FMP concessions) include all the active concessions that had no FMP approved by 2010 (in 2005, respectively, for the FMP 2000–2005 treatment), including concessions with FMP approved after 2010. For the FMP 2000–2005 treatment, concessions that had an FMP approved between 2005 and 2010 were excluded.
Overall, there are 60 concessions with an FMP approved before 2005 and 165 no-FMP concessions for the FMP 2000–2005 treatment and 61 concessions and 194 no-FMP concessions for the FMP 2006–2010 treatment. With the first certificates issued in 2005, FSC certification is recent in the Congo Basin. Consequently, we can only estimate the average short term impact of FSC certification (after one to five years of certification) on 2000–2010 deforestation (treatment FSC 2000–2010). It is also worth noting that all FSC-certified concessions already had an approved FMP. Since concessions with FSC certificates are more likely to implement their FMP, measuring the impact of issuance of FSC certificate between 2005 and 2010 on deforestation also provides information on the average impact of implementing FMP in concessions with FSC certificates. Though the FSC-certified conces-sions have had a certificate over a short period, most of them had an FMP approved before 2005. Hence, the average effect of FSC-certificate is measured for a group of logging concessions that have had their FMP approved for at least five years and have received a third-party ver-ification of their practices by an FSC-accredited agent. Our sample in-cludes 25 active concessions that were FSC-certified before 2010. As in the previous treatments, the control group consists of 194 active con-cessions without an FMP in 2010.
To the extent that some concessions with active permit and no ap-proved FMP by 2010 might delay extracting timber, our definition of control group may lead to underestimating the effect of FMP approval. Indeed, in that case, the effect of FMP approval or issuance of FSC certificate are measured by comparing a treated concession that has extracted timber over the period of observation to a concession without FMP that has an active permit but did not extract timber over the same period. If timber extraction is the only source of forest cover loss in concessions with an active permit in the study area, the definitions of treatment and control groups used in this study should lead to a con-servative estimate of the effect of FMP approval and FSC certification in the study area. However, it is likely that forest cover loss occurs in concession with active permit because of illegal activities and activities of communities living within or in the neighborhood of forest conces-sions. In this case, the definition of control group fits the theory of change and provides a fair description of the counterfactual predicted in absence of FMP.
4.2. Econometrics and identification strategy
This subsection describes the strategy used to account for the fact, compared to their peers that had not approved their FMP before 2010, the logging concessions with either an approved FMP or an FSC certi-ficate had different characteristics known to affect deforestation. Our approach here is consistent with the previous empirical literature on the environmental impact of various policies (see for instance Blackman, 2013;Börner et al., 2016;Le Velly and Dutilly, 2016) and uses a pro-pensity-score matching (PSM) approach to estimate the effect of FMP and FSC-certification in the Congo Basin with the least possible bias.
Using the potential-outcome framework, we consider that each logging concession has two potential outcomes Y1and Y0, where Y1is
the area deforested between 2000 and 2010 for logging concessions
with an approved FMP (or with FSC certification) and Y0the analogous
figure for concessions without an approved FMP (no FSC certification).
T is a dummy for the concession having either an approved FMP or FSC
certification. We want to estimate the average effect of having an ap-proved FMP or FSC certification in the concessions that have them, i.e. the average treatment effect on the treated (ATT):
= = =
ATT (Y1 Y T0| 1) (1)
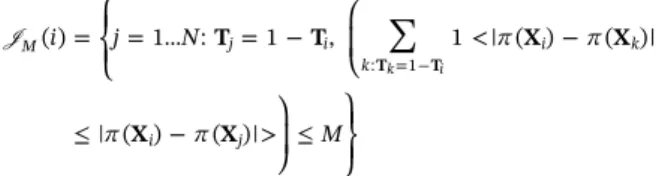
As Y0is never observed for a treated concession, the ATT cannot be directly estimated. Denote by X a set of characteristics that are known to affect deforestation and that differ across concessions that have an approved FMP or FSC certificate (which we refer to as the treatment for brevity below) and those that do not. The propensity score is π(X) ≡ Ρ(T = 1|X). The following assumptions, often referred to as “strong ignorability” (Rosenbaum and Rubin, 1983), imply that con-trolling for X suffices to account for the effects of the confounding factors:
< < (H1) (Y , Y ) T | X and (H2) 01 0 (X) 1
H1 is often referred to as “unconfoundedness”, and states that, if all confounders are included in X, then controlling for X renders treatment exposure independent of the potential outcomes. Under H1,Rosenbaum and Rubin (1983)show that (Y1,Y0) ⊥ T ∣ π(X) Consequently, logging concessions with similar propensity scores would have on average si-milar deforestation in the absence of an approved FMP or FSC Certifi-cation and
= = =
Y T X Y T X
( 0| 1, ( )) ( 0| 0, ( ))
H2 implies that, for almost all values of X, both treated and un-treated concessions have a probability of either getting an approved FMP or FSC certificate at some point. If H1 and H2 hold, then Abadie andAbadie and Imbens (2016)suggest estimating the ATT τ as follows:
= = N T Y M Y 1 1 . i N i i j i j 1 1 JM( )
Here M is a fixed number of matches per logging concession i,JM( )i the set of matches for logging concession i, N the number of treated and untreated concessions, N1the number of concessions with the treatment and Tia dummy for the concession i being treated. The matching set
i ( ) M J is defined as follows: = = … = < > = i j N M T T X X X X ( ) 1 : 1 , 1 | ( ) ( )| | ( ) ( )| M j i k i k i j T T : k 1 i J
where 1〈〉 is an indicator variable for the event inside the brackets holding. The setJM( )i hence consists of the logging concessions that are not treated and with a propensity score similar to that of logging concession i. Overall, is the average difference in the area deforested between each treated concession and the average deforestation in a set of untreated concessions with similar propensity scores. Abadie and Abadie and Imbens (2016)also show that produces an unbiased es-timate of the ATT, while taking into account the fact that the propensity score is estimated.
4.3. Confounding factors and estimation
We consider ten key covariates known to be correlated with the likelihood of deforestation and that differ between concessions with an FMP approved or an FSC certificate and their peers without an FMP approved by 2010 (seeBlackman, 2013). The selected covariates in-clude indicators of accessibility, population pressure, biomass pro-ductivity, average steepness and elevation, which are arguably
correlated to parameters that weigh into management decisions of logging companies and will indirectly influence the time needed for a concession to get their FMP approved. Four variables were used to proxy various dimensions of accessibility that are the most correlated with deforestation and are also correlated to the timing when a con-cession gets either its FMP approved or its FSC certificate: the distance to the road network, the distance to the nearest settlement, distance to the capital of the country and main ports, and the travel distance to a market. Settlement density is the number of settlements in a 20-km radius around each settlement, and picks up population pressure. We also include the distance to a deforested area in the 1990–2000 period. Above-ground forest biomass is based onAvitabile et al. (2016)and measures the density of timber available. Elevation and slope describe the topographic environment and so suitability for logging, as steep slopes can pose problems for logging machines. Last, we control for the concession area in hectares (see Subsection S1 of the supplementary materials for details on the covariates).
4.4. Robustness checks
To produce unbiased estimates of the treatment effects, quasi-ex-perimental approaches based on matching techniques assume that all of the relevant variables that drive deforestation and which vary between the concessions with an FMP approved (or an FSC certificate) and those without are observed and used as controls. However, this assumption is hard to test, as the real unknown variables are by definition unknown, while some known confounders (the quality of local governance, fi-nancial means of logging companies, their “readiness” to implement an FMP, and rules faced in the country they are based) are not readily available and homogeneously measured for all concessions (Panlasigui et al., 2018). If these unobservable confounders are spatially time-in-variant, their effect should be seen in the difference in the area defor-ested in concessions with and without an FMP prior to FMP adoption, and hence between 1990 and 2000. Following this argument, we test for differences in 1990–2000 deforestation between concessions with and without FMP after matching. We furthermore consider an alter-native approach that explicitly takes into account past deforestation by measuring the effect of FMP adoption on the change in deforestation over time. This change in deforestation (between 1990–2000 and 2000–2010) should in theory allow us to abstract from the effect of any unobservable factors that do not vary over time and hence should not affect the change in deforestation. This is akin to combining matching with a difference-in-difference approach. This is however not our pre-ferred strategy, given that we do not have a true panel of logging concessions. Some logging concessions observed in 2000–2010 were not active in 1990–2000. Moreover, the deforestation data are of poorer quality between 1990 and 2000 due to the lack of satellite imagery, and the GFC dataset only covers deforestation after 2000.
4.5. Impact heterogeneity
To explore the mechanisms of change, we have randomly drawn 160,000 pixels within logging concessions from the high-resolution satellite imagery described inSection 3(see Subsection S2 of the sup-plementary materials for detailed information on the pixel-sampling strategy). Then, we studied how the likelihood of forest cover loss varies across pixel randomly drawn across logging concessions and draw conclusions about spatial heterogeneity of FMP inside conces-sions.
To test the most-plausible pathways of the theory of change outlined above, we explore heterogeneity by the proximity of pixels to past deforestation, road networks and settlements (seeTable 2for a sum-mary of the main predictions of the different plausible mechanisms). More precisely, we compare how the difference in deforestation across pixels that are close (under median distance) and far (over median distance) differs by concession FMP status. In line with the theoretical
framework, we focus the heterogeneity analysis on concessions that had their FMP approved between 2000 and 2005, where the expected im-pact of each mechanism is more likely to be seen.
5. Results
5.1. The impact of FMP on deforestation
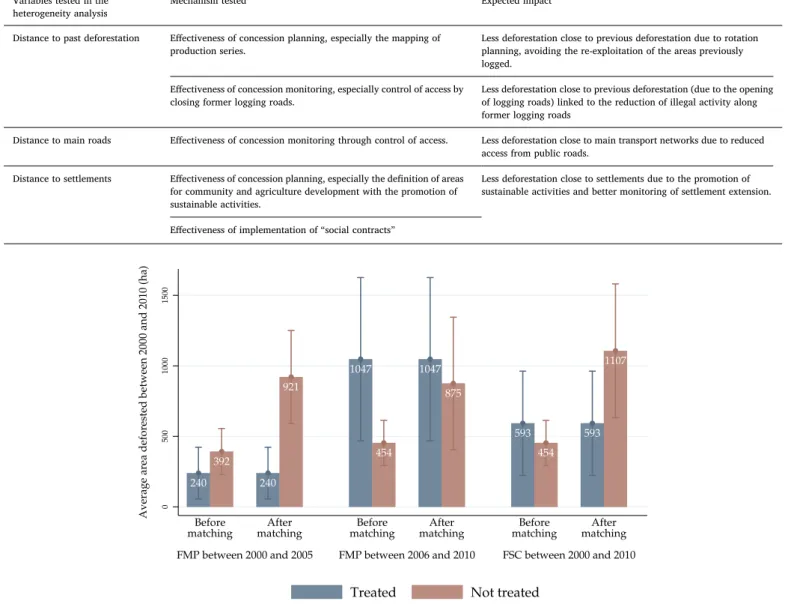
After matching, our estimates suggest that concessions with an FMP approved between 2000 and 2005 have less deforestation compared to otherwise-similar concessions without an FMP (see Table S3 for more details). More precisely, having an FMP approved between 2000 and 2005 is associated with average avoided deforestation of 681 ha per concession (Fig. 3). Since the area deforested between 2000 and 2010 is estimated at 921 ha in control concessions, this represents a 74% fall in deforestation (Fig. 3). We find similar results using estimates of the area deforested from the GFC dataset, with FMP approved between 2000 and 2005 being associated with lower deforestation of 1005 ha for tree cover of 70% and 1144 ha for tree cover of 30%, representing respec-tively drops of 74 and 75% (see Table S4).
For an FMP approved between 2006 and 2010, after matching, we find no statistically-significant impact of the FMP approval on 2000–2010 deforestation. The same result applies when the area de-forested is estimated using tree-cover loss from the GFC dataset for tree cover of 70% and 30%. As such, reduced deforestation is not seen in the very short run, in line with the predictions from the theory of change. Last, after matching, the FSC 2000–2010 treatment is also asso-ciated with a statistically-significant lower deforestation between 2000 and 2010 (at 10% p-value). Concessions with FSC certificates, testifying that FMP have indeed been implemented, have on average an avoided deforestation estimated at 514 ha between 2000 and 2010. Compared to the average deforested area of 1107 ha in the control concessions (all active concessions without an FMP in 2010), this represents 48% less deforestation in concessions that have received their FSC certificates between 2005 and 2010 (Figs. 3 and 4). This result can be replicated using deforestation from the GFC data, with avoided deforestation in FSC 2000–2010 concessions of 699 ha for tree cover of 70% (47% less than control concessions) and 789 ha for tree cover of 30% (50% less than control concessions). We carried out complementary analyses that try to estimate the relative effectiveness of FSC certification over FMP approval (i.e. comparing FSC concessions with only FMP concessions) and also comparing FSC concessions with all no-FSC concessions (i.e concessions with approved FMP and without FSC certificate, plus active concessions without approved FMP). These analyses present several limitations that are detailed in supplementary materials (see Subsection S3). Consequently their results should be interpreted with caution. Considering these limitations and that concessions with FSC certifica-tion have had their certificates for at most five years, the com-plementary analyses suggest that there is no statistically significant difference of deforestation across FSC-certified concessions and their peers with approved FMP that had no FSC certificate. Therefore, the additional benefit of issuance of FSC certificate over approval of FMP seems nonexistent compared to the overall impact of implementing FMP. Likewise, we find no statistically significant difference of defor-estation between concessions with FSC certificates and all their peers without FSC. This latest result is likely driven by the fact that the best match for concessions with FSC certificate are their peers with ap-proved FMP and without FSC certificate and that, as found in the pre-vious analysis, the relative difference of forest cover loss across these both groups is not statistically significant.
5.2. Robustness checks
The validity of all the results above rests on the assumption that the matching was successful in comparing treated and untreated conces-sions with similar propensity scores. Moreover, the results assume that
there is no variable other than the ten covariates used as controls that drives deforestation and differs across concessions with and without an FMP approved (or an FSC certificate). In this subsection we discuss the sensitivity of our estimates to these two assumptions.
The matching was successful in balancing treated and untreated concessions with similar propensity scores. The distribution functions of the propensity scores (see Figs. S2, S3 and S4) suggest that it was possible to associate each treated concession to a control concession with similar propensity score. Then, in contrast to Table S2 (char-acteristics of logging concessions across treatment groups before matching), Table S5 shows that the matching was successful at re-moving most difference in observable characteristics between treated and the untreated control concessions.
However, even after matching, control concessions cover larger tracts of land. The fact that concessions without an approved FMP still cover larger areas than their matched peer with approved FMP may suggest that the results of the matching procedure over-estimate the reduction of deforestation from the FMP. Larger concessions are indeed more likely to have larger areas deforested, even with lower defor-estation rates. Yet, we find no evidence that defordefor-estation rate is lower in concessions without approved FMP. Further analyses using
deforestation rate as outcome instead of deforestation area (see Table S6 of the supplementary materials) indicate that the 2000–2010 de-forestation rate is also lower in concessions with an FMP approved between 2000 and 2005 compared to concessions without FMP.
To test the sensibility of the results to unobservable heterogeneity across concessions with approved FMP (or FSC certificate) and their matched pair, we compared the difference in deforestation level be-tween 1990 and 2000 across both groups of concessions. Although concessions with an accepted FMP between 2000 and 2005 exhibited on average less 1990–2000 deforestation than their matched peers, the difference is not statistically significant (see Table S7 for more details). We also introduce an alternative specification to account more di-rectly for this 1990–2000 deforestation difference, which may reveal subtle but real differences in unobservable characteristics. Following this approach, we sought to measure the effect of FMP approval on the ability of logging companies to reduce deforestation inside concessions over time. Comparing the change in deforestation between 1990–2000 and 2000–2010 across logging concessions with and without an FMP, we find that deforestation fell more in treated concessions than in control concessions without an FMP, although this difference was not statistically significant for the treatment FMP 2000–2005. We applied Table 2
Predictions of the main falsifiable pathways through which FMP can affect deforestation in the short to medium run.
Variables tested in the
heterogeneity analysis Mechanism tested Expected impact Distance to past deforestation Effectiveness of concession planning, especially the mapping of
production series. Less deforestation close to previous deforestation due to rotationplanning, avoiding the re-exploitation of the areas previously logged.
Effectiveness of concession monitoring, especially control of access by
closing former logging roads. Less deforestation close to previous deforestation (due to the openingof logging roads) linked to the reduction of illegal activity along former logging roads
Distance to main roads Effectiveness of concession monitoring through control of access. Less deforestation close to main transport networks due to reduced access from public roads.
Distance to settlements Effectiveness of concession planning, especially the definition of areas for community and agriculture development with the promotion of sustainable activities.
Less deforestation close to settlements due to the promotion of sustainable activities and better monitoring of settlement extension. Effectiveness of implementation of “social contracts”
Fig. 3. Difference before and after matching across treatment groups.
the same approach (seeAbadie, 2005;Heckman et al., 1997, 1998, for references) for the other treatment variables, and found that defor-estation between 1990–2000 and 2000–2010 fell more in concessions that had their FMP approved between 2006 and 2010 or that had re-ceived their FSC certificate before 2010 than their peers without an approved FMP (see Table S7, column DID + PSM, for more details). 5.3. Impact heterogeneity
We first reproduce the main results of the paper using a sample of pixels. The results are reported in Panel A ofTable 3and show that pixels in concessions with approved FMP between 2000 and 2005 were less likely to lose their forest cover between 2000 and 2010 than their peers in concessions without approved FMP.
Second, spatial-heterogeneity analysis using the pixel-level database revealed that 2000–2005 FMP is associated with significantly less de-forestation in areas close to settlements, close to previously-deforested areas and close to main transport network, with the measured differ-ence being stronger for observations below the median value of these three variables (seeTable 3). The ATT for all concessions on the like-lihood of deforestation was smaller by 0.27 percentage points, equivalent to 53% less deforestation; the analogous figures in areas close to settlements are 0.41 (57%), in areas close to previous defor-estation 0.61 (69%) and, in areas close to main transport network 0.24 (42%). Conversely, likelihood of deforestation was not statistically different across concessions with and without FMP in areas further from settlements, previously deforested areas and main transport road.
These results are in line with our expectations from our theory of change (Fig. 1 andTable 2). They emphasize the effects of improve-ments in, first, the planning of the concessions, especially for rotation cycles and areas for community and agricultural development, second, the monitoring of concessions by closing former logging roads and monitoring the extension of settlements and agriculture areas, and, third, the monitoring of the incursion from public roads into conces-sions.
6. Discussion and concluding remarks
Curbing tropical deforestation is arguably a major environmental challenge. Addressing it requires the assessment of policy effectiveness and the understanding of the mechanisms underpinning their successes
and failures. This paper contributes to this aim by showing that the area deforested is lower in logging concessions that have an approved FMP in the Congo Basin. More specifically, deforestation is lower in con-cessions that have had an FMP over a longer period. LikePanlasigui et al. (2018), this highlights the importance of the time frame: inter-ventions aiming at increasing FMP and FSC-adoption should be eval-uated over long time periods.
Evidence from analyses at the pixel level suggests that concessions with an approved FMP are less likely to over-exploit previously-logged areas. The results also suggest that concessions with an approved FMP are more likely to better control access into their perimeter and reduce deforestation around communities located within or nearby the con-cession. This is in line with the theory of change underpinning the implementation of forest management plans in concessions. The results confirm that spatial heterogeneity analyses are useful when evaluating policy interventions (Bruggeman et al., 2018). They add to the findings of Cerutti et al. (2017)who documented that concessions with FMP between 1998 and 2009 reduced volumes of timber harvested. Hence, reduction of the volume of timber harvested is likely another me-chanism through which FMP reduced deforestation in the Congo Basin between 2000 and 2010.
Measuring the average impact of FMP on deforestation in the Congo Basin presents several challenges such as defining the right treatment groups and observation periods, and identifying a convincing strategy to isolate the average deforestation avoided attributable to FMP. Despite our attempts at addressing these challenges, the conclusions of this study rest on few key assumptions worth revisiting to outline avenues for future research.
First, the WRI and OFAC databases propose the most consistent effort to produce an updated census of logging concessions and their characteristics in the Congo Basin. However, the resulting atlas include no information documenting whether FMP are effectively implemented or the volume of timber harvested yearly in each concession. Using available information, we considered as active any concession with an exploitation permit and we identified concessions with an approved FMP, or FSC certificate, based on the date of FMP approval by the forest administrations and the date of issuance of the FSC certificate. Since approval of an FMP does not imply that the FMP is effectively im-plemented, we can only measure the effect of FMP approval which underestimates the effect of FMP implementation. Likewise, to the ex-tent that some control concessions, with an exploitation permit and Fig. 4. The impact of treatment on 2000–2010 deforestation.
without approved FMP, have not started harvesting timber before 2010, our approach provides a conservative estimate of the effect of FMP approval.
Second, while the production of an FMP is mandatory across countries in the Congo Basin, logging companies chose when to draft and submit their FMP. It is then possible that concessions that had their FMP approved earlier have unobserved characteristics that led them also to deforest less. Our effort to account for this was limited by the fact that logging concessions ownership can change over time, and that information about the former management was scarce. However, taking into account previous deforestation, we found that the area deforested fell more in concessions following the approval of their FMP. Whether deforestation will also be lower in logging concessions that had their FMP approved later remains an open question. Will we continue to see lower 2005–2015 deforestation in concessions with an FMP approved between 2005 and 2010? Will there continue to be lower deforestation in concessions that had their FMP approved earlier?
Answering the above questions is a natural extension of our work and will help address the external validity of our results. This will also help inform whether the requirement to produce a forest management plan works for all concessions, and how lower deforestation varies over longer time periods. Likewise, the implementation of FMP is also ex-pected to bring benefits other than reduced deforestation. These in-clude, for example, conservation benefits such as reducing forest
degradation and the preservation of biodiversity, and welfare im-provements for the local population. Future work should therefore address other potential FMP impacts in the Congo Basin, and reveal whether lower deforestation has come at the expense of other dimen-sions of development and conservation.
Funding
This article was produced as part of a research project that sought to estimate and compare the relative effectiveness of the main forest management methods on deforestation in the Congo Basin. The re-search project was carried out by the French National Rere-search Institute for Development (IRD) was funded by the grant IRD-AFD-ERS-EVA-N°416-2016 of the Agence Française de Développement (AFD) and the Fonds Français pour l'Environnement Mondial (FFEM). AFD and FFEM have their headquarters in Paris, FRANCE.
Declaration of competing interest
K. Houngbedji, G. Le Velly, J.S. Makak, B. Mertens, P. Meyfroidt, C. Sannier and I.Tritsch have no conflict of interest to report.
Acknowledgement
The authors gratefully acknowledge the national bodies of forest monitoring in Central African Republic, Cameroon, Congo and Gabon for giving us access to the data; to Jean Bakouma, Julien Calas, Christophe Du Castel, Pascale Combes Motel, Jean-Louis Doucet, Mathew Hatchwell and Benoit Jobbe-Duval for their invaluable advice, comments and insights throughout the study; to the participants of the CIFOR workshop at SupAgro in Montpellier, the Yaoundé-IUFRO con-ference in Yaoundé and CERDI Seminar in Clermont Ferrand for helpful discussions and suggestions; to Andrew Clark for providing language help and proof reading the article. All usual disclaimers apply, parti-cularly that the views expressed in this paper do not represent the views of the Agence Française de Développement.
Appendix A. Supplemenatry data References
Abadie, Alberto, 2005. Semiparametric difference-in-differences estimators. Rev. Econ. Stud. 72 (1), 1–19.
Abadie, Alberto, Imbens, Guido W., 2016. Matching on the estimated propensity score. Econometrica 84 (2), 781–807.
Agrawal, Arun, Chhatre, Ashwini, Hardin, Rebecca, 2008. Changing governance of the world’s forests. Science 320 (5882), 1460–1462.
Angelsen, Arild, 2010. Policies for reduced deforestation and their impact on agricultural production. Proc. Natl. Acad. Sci. 107 (46), 19639–19644.
ATIBT, 2007. “Study of a Practical Forest Management Plan for Natural Tropical Production Forests in Africa as Applied to the Case of Central Africa - Volume 1 ‘Forest Production’,” Technical Report. ATIBT, Paris.
Avitabile, Valerio, Herold, Martin, Heuvelink, Gerard B.M., Lewis, Simon L., Phillips, Oliver L., Asner, Gregory P., Armston, John, Ashton, Peter S., Banin, Lindsay, Bayol, Nicolas, Berry, Nicholas J., Boeckx, Pascal, de Jong, Bernardus H.J., DeVries, Ben, Girardin, Cecile A.J., Kearsley, Elizabeth, Lindsell, Jeremy A., Lopez-Gonzalez, Gabriela, Lucas, Richard, Malhi, Yadvinder, Morel, Alexandra, Mitchard, Edward T.A., Nagy, Laszlo, Qie, Lan, Quinones, Marcela J., Ryan, Casey M., Ferry, Slik J.W., Sunderland, Terry, Laurin, Gaia Vaglio, Gatti, Roberto Cazzolla, Valentini, Riccardo, Verbeeck, Hans, Wijaya, Arief, Willcock, Simon, 2016. An integrated pan-tropical biomass map using multiple reference datasets. Glob. Chang. Biol. 22 (4), 1406–1420.
Barker, T., Bashmakov, I., Bernstein, L., Bogner, J., Bosch, P., Dave, R., Davidson, O., Fisher, B., Grubb, M., Gupta, S., Halsnaes, K., Heij, B., Kahn Ribiero, S., Kobayashi, S., Levine, M., Martino, D., Masera Cerutti, O., Metz, B., Meyer, L., Nabuurs, G.-J., Najam, A., Nakicenovic, N., Rogner, H.-H., Roy, J., Sathaye, J., Schock, R., Shukla, P., Sims, R., Smith, Pete, Swart, R., Tirpak, D., Urge-Vorsatz, D., Zhou, D., 2007. Technical summary. In: Metz, B., Davidson, O.R., Bosch, P.R., Dave, R., Meyer, L.A. (Eds.), Climate Change 2007: Mitigation. Contribution of Working Group III to the Fourth Assessment Report of the Intergovernmental Panel on Climate Change Cambridge University Press.
Table 3
Likelihood of deforestation across concessions with and without a 2000–2005 FMP: Geographic heterogeneity.
Likelihood of deforestation (in %) ATT Treated Control Diff. (in %) Panel A: all pixels
Coefficient 0.238 0.758 −0.520*** −0.270*** (0.03) (0.04) (0.07) (0.06) Number of pixels 19,736 42,100 61,836 61,810 Panel B.1: pixels within median distance from settlements
Coefficient 0.310 1.248 −0.938*** −0.410*** (0.06) (0.08) (0.12) (0.11) Number of pixels 9365 21,555 30,920 30,904 Panel B.2: pixels outside median distance from settlements
Coefficient 0.174 0.243 −0.070 0.019 (0.04) (0.03) (0.06) (0.07) Number of pixels 10,371 20,545 30,916 30,906 Panel C.1: pixels within median distance from past deforestation
Coefficient 0.272 1.289 −1.017*** −0.613*** (0.05) (0.08) (0.12) (0.10) Number of pixels 10,665 20,254 30,919 30,903 Panel C.2: pixels outside median distance from past deforestation Coefficient 0.198 0.265 −0.067 0.062
(0.05) (0.03) (0.06) (0.06) Number of pixels 9071 21,846 30,917 30,907 Panel D.1: pixels within median distance of road network
Coefficient 0.326 1.021 −0.695*** −0.244*** (0.06) (0.07) (0.11) (0.09) Number of pixels 8887 22,035 30,922 30,907 Panel D.2: pixels outside median distance of road network
Coefficient 0.166 0.468 −0.303*** −0.101 (0.04) (0.05) (0.07) (0.07) Number of pixels 10,849 20,065 30,914 30,903
Note: Standard errors are in parentheses. Significance levels are denoted as follows: * p < .10, ** p < .05, *** p < .01.