HAL Id: tel-02084040
https://pastel.archives-ouvertes.fr/tel-02084040
Submitted on 29 Mar 2019HAL is a multi-disciplinary open access archive for the deposit and dissemination of sci-entific research documents, whether they are pub-lished or not. The documents may come from teaching and research institutions in France or abroad, or from public or private research centers.
L’archive ouverte pluridisciplinaire HAL, est destinée au dépôt et à la diffusion de documents scientifiques de niveau recherche, publiés ou non, émanant des établissements d’enseignement et de recherche français ou étrangers, des laboratoires publics ou privés.
rheological properties
Blandine Feneuil
To cite this version:
Blandine Feneuil. Cement foam stability : link with cement paste rheological properties. Materials. Université Paris-Est, 2018. English. �NNT : 2018PESC1045�. �tel-02084040�
pour obtenir le grade de docteur délivré par
Université Paris-Est
Spécialité doctorale“Sciences des matériaux”
Stabilité des mousses de ciment :
lien avec les propriétés rhéologiques
de la pâte de ciment
Cement foam stability:
link with cement paste rheological properties
présentée et soutenue publiquement par
Blandine F
ENEUIL
le 11 octobre 2018
devant le jury composé de
Mme Véronique SCHMITT Présidente du jury
Mme Anne-Laure BIANCE Rapporteure
M. Guillaume OVARLEZ Rapporteur
M. Jean-BaptisteD’ESPINOSE DELACAILLERIE Examinateur
M. Pascal BOUSTINGORRY Invité
M. Nicolas ROUSSEL Co-directeur de thèse
Cement foam advantages compared to normal concrete are its low density, low mate-rial need and thermal insulation capacity. To better understand how the morphology of cement foam affects its properties, we wish to create solid samples with well controlled structure. This involves two steps: the creation of a fresh cement foam with chosen struc-ture, and the stability of this structure up to cement hardening. First step is ensured by our preparation protocol, and second step is investigated in this thesis.
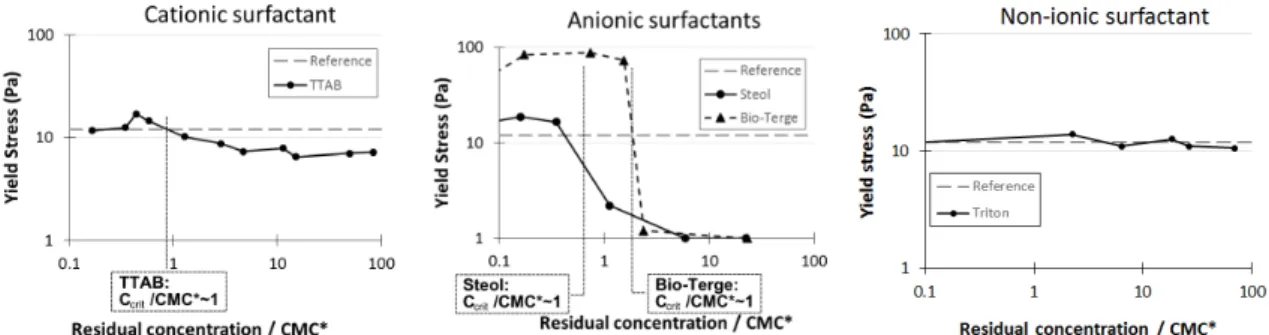
First, we study the interaction of surfactants and cement paste. Some surfactants can-not stabilize foam in cement paste highly alkaline solution. Some others, mainly anionic surfactants, adsorb on cement grain surface, which modifies interactions between ce-ment grains and consequently the yield stress of the cece-ment paste. At low surfactant concentration, cement grain surface becomes hydrophobic and yield stress increases due to hydrophobic attraction between cement grains. At high surfactant concentration, ad-sorbed micelles create a steric repulsion between cement grains and make cement paste yield stress drop.
Second, we study the effect of bubbles on the yield stress of aerated cement paste, at air content below 40%. The measured yield stress is normalized by the yield stress of the suspending cement paste. For a surfactant with low affinity to cement grains surface, results are consistent with literature, whereas dimensionless yield stress is much higher than expected when surfactant strongly adsorbs on cement grain surface. This effect is attributed to the change of the bubble surface properties due to the adsorption of hy-drophobic cement grains at the air-liquid interface.
Then, we focus on cement foam stability, at air content 83%. We first study three se-ries of experiments at given water-to-cement ratio and bubble size. For each sese-ries, the yield stress of the cement paste is changed by addition of superplasticizer or high amount of anionic surfactant. Unexpectedly, the best foam stability is obtained for relatively low yield stress. Rheological measurements on the fresh cement foams allowed us to under-stand this improved stability as a consequence of the reorganization of cement grains into denser packing. In a second part on stability, we study the influence of bubble size, water-to-cement ratio and surfactant content. A stability criterion is defined from the bubble size and the interstitial cement paste yield stress.
Eventually, we observe that cement foam structure affects water imbibition velocity. Imbibition front is slowed down when it crosses the constrictions between the bubbles.
Les mousses de ciment présentent d’intéressantes propriétés : une faible densité, une faible consommation de matière première et une bonne résistance thermique. Certaines de ces propriétés dépendent de sa morphologie. Pour mieux comprendre cette dépen-dance, on veut créer des échantillons de mousse de ciment avec une structure bien con-trôlée : les bulles sont de même taille, et les quantités d’air, de ciment, d’eau et de ten-sioactif sont fixées. Pour ce faire, on mélange d’une part une mousse aqueuse de mor-phologie contrôlée, stabilisée par des tensioactifs, et d’autre part une pâte de ciment. Le but de cette thèse est d’étudier comment conserver cette structure jusqu’à la prise du ci-ment.
Tout d’abord, nous étudions l’interaction entre tensioactifs et pâte de ciment. Cer-tains tensioactifs ne sont pas compatibles avec la solution alcaline présente dans la pâte de ciment et ne permettent pas de produire une mousse dans ces conditions. Parmi les tensioactifs compatibles avec la solution interstitielle de ciment, certains s’adsorbent sur les grains de ciment. Cette adsorption change les interactions entre grains de ciment et par conséquent, la contrainte seuil de la pâte. A faible concentration en tensioactif, la monocouche de molécules adsorbée rend les grains de ciment hydrophobes, ce qui pro-duit une attraction hydrophobe entre grains et une augmentation de la contrainte seuil de la pâte. A forte concentration en tensioactif, les micelles adsorbées engendrent une répulsion stérique entre les grains de ciment et une chute de la contrainte seuil.
Dans un deuxième temps, nous étudions l’effet des bulles d’air sur la contrainte seuil d’une pâte de ciment aérée, lorsque celle-ci contient moins de 40% d’air. Les mesures sont normalisées par la contrainte seuil de la pâte interstitielle afin d’être comparées à la littérature. Lorsque le tensioactif utilisé s’adsorbe peu sur les grains de ciment, les résul-tats sont semblables à ceux de la littérature obtenus sur des fluides à seuil modèles. En revanche, lorsque le tensioactif utilisé a une grande affinité avec les grains de ciment, la contrainte seuil normalisée est bien supérieure aux prédictions. Notre hypothèse pour expliquer ce résultat est une modification des propriétés de surface des bulles à cause de l’adsorption des grains de ciment rendus partiellement hydrophobes par le tensioactif.
Ensuite, nous nous focalisons sur la stabilité des mousses de ciment avant la prise, pour une fraction d’air de 83%. On s’intéresse tout d’abord à trois séries de mesures, en gardant pour chacune d’elles le rapport eau/ciment et la taille des bulles constants. Pour chacune des trois séries, seule la contrainte seuil de la pâte de ciment est changée par l’addition de superplastifiant ou d’une grande quantité de tensioactif anionique. On ob-tient alors un résultat inattendu : la meilleure stabilité est observée lorsque la pâte de
ciment utilisée pour faire la mousse est fluide. Les mesures des propriétés rhéologiques de la mousse nous font émettre l’hypothèse que la bonne stabilité aux faibles contraintes seuil de pâte de ciment est due à la réorganisation des grains de ciment en un réseau gran-ulaire plus dense. Pour aller plus loin sur l’étude de la stabilité des mousses, nous faisons ensuite varier la taille des bulles, le rapport eau/ciment et la quantité de tensioactif. Nous définissons un critère de stabilité pour l’ensemble de ces mousses, qui dépend de la con-trainte seuil interstitielle de la pâte de ciment confinée par les bulles et de la taille des bulles.
Pour finir, nous mesurons la vitesse d’imbibition des échantillons solides. Nous ob-servons que la vitesse est plus faible que celle attendue, à cause d’un ralentissement du front d’eau lors du passage des constrictions entre les bulles.
Ce travail a été financé par le Labex MMCD et s’est déroulé au laboratoire Navier.
Il a bénéficié des contributions d’un grand nombre de personnes que je tiens à re-mercier, et dont je ne vais citer qu’une petite partie puisque la liste exhaustive remplirait trop de pages.
Merci tout d’abord à mes encadrants Oliver et Nicolas, pour le temps que nous avons passé à analyser les derniers résultats et décider de nouvelles expériences à mener.
Merci à tous les expérimentateurs croisés dans les laboratoires, jamais avares de con-seils sur les méthodes de préparation et sur les dispositifs expérimentaux, pour votre compassion devant les expériences ratées, votre aide pour qu’elles soient réussies, et votre bonne humeur pendant les journées de ménage. Merci aux Kepleriens, Julie, Laurent, Yacine, Florence, Jennifer, Ilham, Yousra, Michel, Marie, Meng, Xiao, Oumar, Francesco, Gaétan, Thibault, Elie, etc ; à l’équipe de Bienvenüe, Patrick, Daniel, Hela, Nadia, Aileen, etc; et tout particulièrement à l’équipe mousse, avec qui j’ai pu partager la joie d’admirer la structure cristalline des mousses monodisperses ordonnées : Olivier, François, Aymeric, Asmaa, Luana, Charles.
Merci à l’équipe technique, David, Cédric et Christophe pour votre patience lors des demandes de nouvelles pièces et votre rapidité pour les fabriquer.
Merci pour l’aide pour les démarches administratives, tout particulièrement à San-drine.
Merci pour les kilomètres parcourus pendant la pause déjeuner en nageant et (surtout !) en courant, nécessaires à la concentration pendant les après-midi de bibliographie ou d’expériences, à Julie, David, Laurent, Yacine, Cédric, Denis, Jennifer, Alizée, Marie, Rémy, François, Asmaa, Gaétan, Thibault, Elie, etc.
Merci pour tous les moments de convivialité, très souvent autour d’une tasse de thé, moments privilégiés pour échanger divers conseils et réflexions existentielles sur le but de la recherche, à tous les collègues croisés à Kepler, à Bienvenüe, aux Ponts et au cours des conférences, ainsi qu’à mes amis et ma famille.
Contents viii
Introduction 1
1 State of the art 3
1.1 Introduction . . . 4 1.2 Aerated concrete . . . 5 1.2.1 Production methods . . . 5 1.2.1.1 Chemical foaming . . . 5 1.2.1.2 Physical foaming . . . 5 1.2.2 Properties . . . 6
1.2.2.1 Density and compressive strength. . . 6
1.2.2.2 Thermal resistance. . . 7
1.2.2.3 Rheology. . . 8
1.3 Fresh cementitious materials . . . 9
1.3.1 Suspension . . . 9
1.3.2 Yield stress fluid. . . 10
1.3.3 Hydration and thixotropic behavior . . . 11
1.3.4 The role of chemical admixtures . . . 12
1.3.5 Surfactants in cement paste. . . 13
1.4 Aqueous foams . . . 14
1.4.1 Surface tension and Laplace’s law . . . 14
1.4.2 Role of surfactant in foams . . . 14
1.4.3 Foam structure . . . 15 1.4.4 Foam stability . . . 17 1.4.4.1 Drainage . . . 17 1.4.4.2 Coalescence. . . 18 1.4.4.3 Ostwald ripening . . . 19 1.4.5 Foam rheology . . . 19 1.4.5.1 Solid regime. . . 20 1.4.5.2 Flow . . . 20
1.4.6 Conclusion on aqueous foams . . . 20
1.5 Complex foams and bubble suspensions . . . 21
1.5.2 Hydrophilic particles . . . 24
1.5.3 Yield stress fluid. . . 25
1.5.4 Rheology of complex foams and bubble suspensions . . . 26
1.5.4.1 Aerated yield stress fluids . . . 26
1.5.4.2 Granular foams . . . 28
1.6 Conclusion. . . 30
2 Effects of surfactants on the yield stress of cement paste 39 2.1 Introduction . . . 40
2.2 Background . . . 40
2.2.1 Surfactant molecules in cement paste . . . 40
2.2.2 Foam stability . . . 42
2.2.3 Yield stress of solid suspensions . . . 43
2.3 Materials and methods. . . 44
2.3.1 Materials . . . 44
2.3.1.1 Cement . . . 44
2.3.1.2 Synthetic cement pore solution . . . 44
2.3.1.3 Surfactants . . . 44
2.3.1.4 Cement paste preparation . . . 44
2.3.2 Methods . . . 46
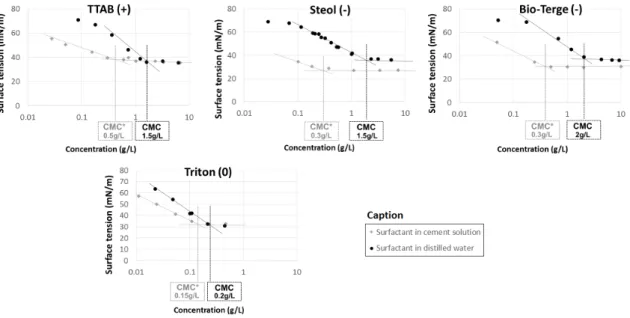
2.3.2.1 Surfactant compatibility with cement pore solution . . . 46
2.3.2.2 CMC . . . 46
2.3.2.3 Yield stress . . . 46
2.3.2.4 Adsorption . . . 47
2.3.2.5 Contact angle . . . 47
2.4 Results and discussion . . . 48
2.4.1 Surfactants in synthetic cement pore solution . . . 48
2.4.2 Adsorption sites and surfactant distribution . . . 50
2.4.3 Relation between yield stress and adsorbed surfactant . . . 53
2.4.3.1 Yield stress drop at high concentration range . . . 53
2.4.3.2 Yield stress increase at low concentration range. . . 54
2.5 Conclusion. . . 55
Bibliography . . . 58
Appendix A: Additional surfactants . . . 59
Appendix B: Compatibility with calcium hydroxide solution. . . 61
Appendix C: Delay of hydration. . . 62
3 Yield stress of aerated cement paste 63 3.1 Introduction . . . 63
3.2 Materials and methods. . . 65
3.2.1 Materials . . . 65
3.2.2 Method . . . 65
3.2.2.1 Preparation of aerated and reference cement paste. . . 65
3.2.2.3 Samples . . . 67
3.2.2.4 Yield stress measurement . . . 67
3.3 Results . . . 68
3.3.1 Reference yield stress. . . 68
3.3.2 Aerated cement paste . . . 69
3.4 Discussion . . . 70
3.4.1 Reference yield stress with surfactant . . . 70
3.4.1.1 Reference yield stress with TTAB. . . 71
3.4.1.2 Reference yield stress with Bio-Terge . . . 72
3.4.2 Dimensionless yield stress. . . 72
3.4.3 Bare bubbles (TTAB) . . . 73
3.4.4 Particle covered bubbles . . . 75
3.5 Conclusion . . . 77
Bibliography . . . 80
4 Optimal cement paste yield stress for the production of stable cement foams 81 4.1 Introduction . . . 82
4.2 Materials and methods . . . 83
4.2.1 Materials . . . 83 4.2.2 Methods . . . 84 4.2.2.1 Protocol . . . 84 4.2.2.2 Precursor foam . . . 84 4.2.2.3 Mixing . . . 84 4.2.2.4 Final stability . . . 85 4.2.2.5 Rheological measurement . . . 86
4.2.2.6 Water suction out of the cement pastes . . . 86
4.2.3 Cement paste yield stress . . . 86
4.3 Results . . . 88
4.3.1 Stability. . . 88
4.3.2 Rheological measurements . . . 90
4.3.2.1 Foam yield stress . . . 90
4.3.2.2 Elasticity . . . 90
4.3.3 Water suction . . . 91
4.4 Discussion . . . 92
4.4.1 Comparison with aqueous foams . . . 92
4.4.2 Early age rheological properties . . . 93
4.4.3 Time evolution of rheological properties . . . 95
4.4.4 Stability loss at very high surfactant content . . . 97
4.5 Conclusion . . . 98
5 Stability criterion for fresh cement foams 103
5.1 Introduction . . . 104
5.2 Materials and methods. . . 105
5.2.1 Materials . . . 105
5.2.1.1 Cement . . . 105
5.2.1.2 Surfactants . . . 105
5.2.2 Methods . . . 106
5.2.2.1 Precursor foam and mixing . . . 106
5.2.2.2 Protocol . . . 106
5.2.2.3 Observation of stability . . . 107
5.2.2.4 Stability of aqueous foam . . . 107
5.2.2.5 X-ray tomography . . . 108
5.2.3 Properties of cement paste . . . 108
5.2.3.1 Yield stress of cement paste . . . 108
5.2.3.2 Surface tension of cement paste . . . 109
5.3 Results . . . 110
5.3.1 Stability of aqueous foams . . . 110
5.3.2 Drainage and ripening . . . 110
5.3.2.1 Smaller bubbles (R.500µm) . . . 110
5.3.2.2 Bigger bubbles (R&500µm) . . . 114
5.3.3 Influence of initial yield stress and bubbles size . . . 116
5.4 Discussion . . . 117
5.4.1 Destabilization mechanisms . . . 117
5.4.2 Characteristic destabilization times . . . 118
5.4.3 Effect of Bingham capillary number . . . 119
5.4.4 15 min interstitial Bingham capillary number . . . 121
5.5 Conclusion. . . 122
Bibliography . . . 124
Appendix A: aqueous foam stability . . . 125
6 Water imbibition of open-cell cement foams 127 6.1 Introduction . . . 127
6.2 Materials and methods. . . 128
6.2.1 Materials . . . 128
6.2.2 Cement foam production . . . 128
6.2.3 Characterization of the foam morphology . . . 129
6.2.4 Permeability measurement . . . 130
6.2.5 Imbibition experiment . . . 131
6.3 Results and discussion . . . 131
6.4 Conclusion. . . 136
Bibliography . . . 137
A Compressive resistance I
A.1 Materials and methods . . . I A.1.1 Materials . . . I A.1.2 Sample preparation protocol . . . I A.1.3 Compression tests . . . II A.2 Results and discussion . . . III A.2.1 Curve shape . . . III A.2.1.1 Air contentΦ > 75%, Steol and TTAB samples . . . III A.2.1.2 Air contentΦ < 40% . . . IV A.2.2 Compression resistance . . . IV A.2.2.1 Comparison with literature . . . IV A.2.2.2 Effect of surfactant . . . V A.2.2.3 Effect of W/C . . . V A.2.2.4 Effect of bubble size . . . VI A.3 Conclusion . . . VII
Environment impact of buildings is considerable, both because of the material need for their construction and the energy demand during their life. Implementation of novel con-struction materials is required to save raw material resources and build energy efficient buildings. Partial replacement of solid by air bubbles offers a promising solution to ad-dress these issues. Aerated concrete, with varying air content from a few percent to 98%, provides a wide range of construction materials with reduced raw material need, reduced transport costs because of it low density, and improved thermal insulation properties.
Microstructural features of solid foams have significant impact on several functional properties. The size of the openings between the bubbles is known to play an important role on cement foam permeability and acoustic absorption capacity. The study of well-controlled cement foam samples is expected to provide better understanding of relation between foam morphology and functional properties.
The production of cement foams with well controlled morphology requires two steps. Firstly, a well-controlled fresh cement foam must be produced. Secondly, the controlled structure must not evolve as long as the cement has not hardened. However, when cement paste is fresh, the cement foam sometimes destabilizes: bubbles tend to raise and to grow. The goal of this work is to give hints to formulate stable cement foams. The role of the rheological properties of the cement paste is mainly investigated.
We describe in chapter 1 the preparation techniques and the main properties of the cement foams reported in the literature. The diversity of the formulations of these foams makes their comparison difficult. Then, we focus independently on the characteristics of fresh cement paste and on the properties of aqueous foams. At the scale of the cement grains, cement paste can be seen as solid particles interacting with each other, and sus-pended in alkaline solution. At the macroscopic scale, cement paste behaves like a yield stress fluid, i.e. it can flow under applied stress above its yield stress. Aqueous foams are also yield stress fluids. Besides, they are unstable systems due to the difference of density between liquid and air, and to the high energy required to create the numerous air-liquid interfaces. Three destabilization mechanisms occur: drainage is due to gravity, Ostwald ripening leads to gas transfer between the bubbles and coalescence is the breakage of walls separating neighbor bubbles. Finally, in the last part of chapter 1, we analyze litera-ture results on complex foams to understand how fresh cement paste can affect stability and rheological properties of cement foams.
without adding bubbles. We study the efficiency of surfactants, first in cement paste in-terstitial solution, and then in the presence of cement grains. In addition, we measure how surfactants adsorb on cement grains, and how adsorption affects the surface prop-erties of the grains, the consistency of the cement paste and the setting time. We show in this chapter that if surfactant type and concentration are well chosen, it can be used as an additive in cement paste to make cement grain surface hydrophobic and to monitor the yield stress of the paste.
In chapter 3, we focus on aerated cement pastes at low air volume content, below 40%. We investigate the effect of the air inclusions on the yield stresses of the pastes and we compare our results with models and measurements performed on model yield stress fluids. We note and discuss a major difference between the cases when cement grains are hydrophobic and hydrophilic.
In chapter 4 and 5, we focus on cement foam stability, at air content 83%. In chapter 4, we change the yield stress of the cement paste by varying the amount of surfactant or superplasticizer, while water-to-cement ratio and bubble size are kept constant. Unex-pectedly, remarkable stability is observed when cement paste yield stress is low, which coincides with a major enhancement of the yield stress due to confinement between the bubbles. In chapter 5, we study the influence of bubble size, water-to-cement ratio and surfactant content, in order to define a stability criterion for cement foams from the bub-ble size, the yield stress of the interstitial cement paste and the time evolution of the ce-ment paste.
In chapter 6, we measure water imbibition of cement foams with open porosity, pre-pared with two different surfactants. Classic model cannot account for the low measured imbibition velocity. We attribute this effect to the morphology of solid foams. Indeed, we observe that water front is slowed down when it crosses the windows between the bub-bles.
Lastly, some measurements of the compressive stress of cement foams samples are presented in Appendix A.
State of the art
Sommaire
1.1 Introduction . . . . 4 1.2 Aerated concrete . . . . 5 1.2.1 Production methods . . . 5 1.2.1.1 Chemical foaming . . . 5 1.2.1.2 Physical foaming . . . 5 1.2.2 Properties . . . 61.2.2.1 Density and compressive strength. . . 6
1.2.2.2 Thermal resistance. . . 7
1.2.2.3 Rheology. . . 8
1.3 Fresh cementitious materials . . . . 9
1.3.1 Suspension . . . 9
1.3.2 Yield stress fluid. . . 10
1.3.3 Hydration and thixotropic behavior . . . 11
1.3.4 The role of chemical admixtures . . . 12
1.3.5 Surfactants in cement paste. . . 13
1.4 Aqueous foams . . . 14
1.4.1 Surface tension and Laplace’s law . . . 14
1.4.2 Role of surfactant in foams . . . 14
1.4.3 Foam structure . . . 15 1.4.4 Foam stability . . . 17 1.4.4.1 Drainage . . . 17 1.4.4.2 Coalescence. . . 18 1.4.4.3 Ostwald ripening . . . 19 1.4.5 Foam rheology . . . 19 1.4.5.1 Solid regime. . . 20
1.4.5.2 Flow . . . 20
1.4.6 Conclusion on aqueous foams . . . 20
1.5 Complex foams and bubble suspensions . . . 21
1.5.1 Hydrophobic particles . . . 21
1.5.2 Hydrophilic particles . . . 24
1.5.3 Yield stress fluid. . . 25
1.5.4 Rheology of complex foams and bubble suspensions . . . 26
1.5.4.1 Aerated yield stress fluids . . . 26
1.5.4.2 Granular foams . . . 28
1.6 Conclusion . . . 30
1.1 Introduction
Construction industry faces everyday new challenges. Need of new infrastructures is growing; architectural innovations call for stronger and more flexible materials. At the same time, environmental issues require to save raw resources and to enhance energy efficiency of the new and renovated buildings.
Therefore, new construction materials must be developed. However, a successful new construction material has to meet lots of requirements such as low production cost, low environmental impact, thermal insulation, sound insulation, mechanical strength, dura-bility, fire resistance and manufacturing/placement efficiency.
Cementitious materials fulfill a lot of these requirements. They are composed of a binder (usually a mixture including Portland cement), water and aggregates, most of which can be found near the construction site. They can be poured into molds or easily shaped during a few hours after mixing. After chemical reaction of cement with water, it pos-sesses high compressive strength. In addition, it is fire resistant and lasts several decades, up to centuries. But it raises a major environmental concern because of the high amount of raw materials needed and the carbon dioxide released during cement manufacture.
Addition of small amount of air bubbles into concrete improves its life time in areas exposed to freeze-thaw cycles. In larger amount, it helps to save resources, reduce the material density and improve its thermal resistance. Aerated concrete is thus a promising material, as it combines the advantages of concrete while improving its environmental performance.
In this chapter, we will first briefly describe the fabrication methods and properties of aerated cementitious materials (part 1.2). We will see that the formulations and manu-facturing methods are very numerous, and, therefore, the range of the final properties of these materials is very wide. This motivates the approach used in the following chapters, where we choose to prepare and study aerated materials with well controlled formulation and morphology. We will mainly deal with the manufacture and the early time evolution of well-controlled cement foams (chapters2to5). This requires proper understanding of
the fresh properties of aerated cementitious material. These properties result from the behaviors of both the continuous phase (concrete, cement or mortar) and the bubbles. In part1.3, we will give an overview of the properties of fresh cementitous materials. In parts 1.4and1.5, we will deal with foams.
1.2 Aerated concrete
1.2.1 Production methods
Two types of methods are used to add air bubbles into concrete, mortar or cement paste: chemical methods or physical methods. Note that materials are usually named in the literature accordingly to their fabrication method. Cellular concrete or autoclaved con-crete refers to chemical foaming, while foamed concon-crete or cement foam refers to physical foaming [1].
1.2.1.1 Chemical foaming
Chemical foaming consists in adding to the mix slurry an additive which is able to re-act and produce gas. Produced gas remains stuck in the slurry and forms pores. This method is used for autoclaved aerated concrete. Autoclaved aerated concrete is a solu-tion patented in the 1920’s [2] to manufacture prefabricated lightweight concrete blocks. In this case, the additive is aluminium powder [3] which releases hydrogen in cement or concrete alkaline environment [4]. Aluminium grain size and quantity control the final size and volume of porosity [1]. Mechanical strength of autoclaved concrete is enhanced by curing at high temperature and pressure (190° C and 1.2 MPa) [1,5]; this curing method is called autoclaving. Another common foaming agent for chemical foaming is hydrogen peroxide H202[6,7].
1.2.1.2 Physical foaming
Physical foaming methods require the use of surfactant molecules to avoid coalescence of bubbles. The effect of surfactant is detailed later in the next sections: in part1.3.5, we study their effect in cement paste, and, in1.4, how they stabilize aqueous foams.
Bubbles can be brought into cement/concrete slurry by two methods. First, bubbles can be entrained by fast mixing of the slurry ([8,9,10]). Surfactants used for this method are usually called air entraining agents (AEA). They are used, for instance, to create freeze-thaw resistant concretes, where air volume fraction is between 4 and 8%. Higher air vol-ume fraction can also be reached. For instance, the fiber reinforced foams prepared by
Akthar & Evans [11] have air volume content up to 95%. The morphology and the amount of the entrained bubbles are however hard to control, and the resulting foam can be un-stable [1].
Precursor foam method allows a better control of the foamed cement properties [12]. Some authors also suggest that these foams have better thermal insulation capacities [7].
A separate precursor foam, i.e. an aqueous foam made of water and surfactant, is pre-pared and then incorporated into the slurry [13,14,15]. The morphology of the hardened cement depends on the bubble size distribution of the precursor foam and on the evolu-tion of the bubbles during mixing and until cement hardening. Conservaevolu-tion of bubble size during mixing is however challenging. Paste consistency must be well chosen: if it is too fluid, bubbles tend to rise and escape from the mix, and if it is not fluid enough, bub-bles tend to break [13,16]. Both cases lead to a decrease of the incorporated air volume.
In this thesis, we focus on material with very well controlled structure, that is why the chosen manufacturing method is the precursor foam method (see chapters3to6). Therefore, for the literature review on the properties of cement foams, we focus mainly on the foams obtained with this method; materials obtained by air entrainment or chemical foaming are only used when complements are necessary.
1.2.2 Properties
1.2.2.1 Density and compressive strength
Cement foams are first characterized by their low density. Many studies aim at improv-ing the mechanical strength at a given density. For autoclaved aerated concrete, den-sities range from 300 kg/m3 to 1200 kg/m3 with compressive strength from about 1 to 10 MPa [2].
Cement foams prepared using physical methods usually have lower strengths. In Fig. 1.1, we can see compression strength as a function of density for samples prepared with precursor foam method as a function of density. On the whole, compression strength increases with density. The graph however illustrates the heterogeneity of the measured strengths: results obtained by Jones & McCarthy [14] are much below the measurements of
Tonyan & Gibson [17] and Abd & Abd [18] at similar densities. At a given density, mechan-ical strength depends on the composition and on the preparation protocol of the cement foam. For instance, Nambiar and Ramamurthy [13] (red symbols in Fig.1.1) have noticed an important effect of the filler type on the cement foam resistance. Falliano et al. [19] measured the yield stress of cement foams made by the precursor foam method with var-ious cements, surfactants, curing methods and water to cement ratio and observed that all these factors play a role on the hardened cement foam strength.
In many industrial applications, strength-density ratio of the cement foams must be optimized. From the literature results, we can distinguish three methods to go to this direction. The first one consists in increasing the strength of the concrete matrix. For in-stance, as mentioned previously, this is the role of autoclaving during the fabrication of autoclaved aerated concrete. The use of reinforcing fibers [11] and carbon nanotubes [20, 21] has also been studied. Secondly, some authors use a lighter concrete matrix; the air content at given density is therefore smaller. Lighter matrix can be obtained for example by the use of lightweight aggregates [12] and the replacement of sand by fly ash [13]. The third optimization mean could be the control of the bubble morphology, though, the ef-fect of bubble morphology raises no consensus. In the strength-density model proposed
Figure 1.1: Compressive strength of some cement foams prepared by precursor foam method and measured 28 days after preparation. Empty back squares correspond to foams containing mi-crosilica, polyesther fibers and superplasticizer [17]; black crosses, sand [14]; black diamonds [18]. All red signs have been published in reference [13], different solid particles have been added to cement paste: fly ash (asterisks), fly ash and sand (dots), fine sand (crosses) coarse sand (circles).
by Hoff [22] and checked by Kearsley & Wainwright [23], no effect of the bubble mor-phology appears. However, Nambiar and Ramamurthy [13] suggest that the strength loss observed when fine sand is replaced by coarse sand is due to a non-homogeneous distri-bution of the air bubbles in the latter case. Some authors notice that decreasing water-to-cement ratio, although it increases the strength of the concrete matrix, decreases the cement foam compressive strength [19], they attribute this effect to the irregular shape of the bubbles. Some authors mention that best mechanical resistance is obtained when bubble size distribution is narrower [24,25] and when bubbles are not connected [26,27]. Others [1,28] also suggest that the strength of chemically foamed concrete is better in the case of small and spherical bubbles.
However, a major difficulty to study the effect of foam structure on cement foam strength arises from the fact that, in the studies previously mentioned, the structure of the foam is not modified independently from the composition of the matrix. On the contrary, it results for instance from a change of paste fluidity or surfactant. As a consequence, the effect of foam structure on its final strength can hardly be distinguished from the modifi-cation of the strength of the cementitious matrix.
Some authors have also measured the tensile strength [7] as well as the compression elastic modulus [12] of aerated concrete. Similarly to compression strength, these me-chanical properties also decrease when density decreases and are strongly related to the composition of the matrix.
1.2.2.2 Thermal resistance
Samson et al. [29] compare the thermal conductivities of lightweight concrete prepared with various methods: chemical foaming, air entrainment, pre-formed foam and lightweight
aggregate concretes (see Fig.1.2). Thermal conductivity depends mainly on density, in-deed, values obtained for lightweight aggregate concretes are similar to aerated concretes. Some authors report a linear relation between density and thermal conductivity [7]. In a minor extent, thermal conductivity depends also on the content on the continuous phase, for instance its moisture content [3]. A small dependence of the thermal resistance on the foam structure is observed by some authors[3,30]. However, like mentioned previously in the case of compressive strength, porosity morphology has been changed by a modifi-cation of the formulation of the foam. For instance, in chemically produced metakaolin-blast furnace slag foams studied in [30], the size of the pores is changed with the concen-tration of added stabilizing surfactant.
Figure 1.2: Thermal conductivity of lightweight concretes. Graph extracted from [29]. In the leg-end, LA corresponds to concrete containing lightweight aggregates; GF, to aerated concretes pre-pared with chemical foaming method; MF, to air-entrained concretes; PF, to pre-foaming method; G, to foamed gypsum.
1.2.2.3 Rheology
There is no consensus on the effect of bubbles on the fresh properties of cement foams.
Rixom and Mailvaganam [16] report a decreases of fluidity when bubbles are entrained with some surfactant. On the contrary, Aïtcin [31] and Ahmed et al. [32] mention a reduc-tion of the viscosity due to entrained bubbles.
1.3 Fresh cementitious materials
In literature concerning cementitious materials, a distinction is made between concrete, mortar and cement paste. Cement paste contains no aggregates whereas mortar includes fine aggregates (sand) and concrete, fine and coarse aggregates. In this work, we want to understand the interaction of foam and surfactant with cementitious materials. We there-fore choose to study the most simple cementitious material, i.e. cement paste, containing only water and Portland cement. For the same reason, alternative binders such as fly ash and blast furnace slag, which are widely used in practice due to their lower environmental footprint, are not investigated here.
1.3.1 Suspension
Portland cement is mainly composed of clinker, obtained from limestone and clay. It is mixed, heated at 1450° and ground. It contains several oxides, mainly calcium oxide CaO (∼ 60 %) and silicium oxide SiO2(∼ 20%), as well as Al2O3, Fe2O3, MgO, K2O and Na2O
[33]. When it is mixed with water, some of the ions dissolve, and for several minutes up to hours, cement paste can be considered as a suspension of rigid particles in a strongly alkaline electrolyte solution. During this dormant period, the cement can be poured in mold or shaped. Then, chemical reaction between the cement oxides and water takes place and the formed hydration products bind the unreacted particles to form a solid material. We will discuss here only the properties of the fluid cement paste, before cement hydration.
Size of the cement grains range from about 1µm to 100 µm with average about 10 µm [34,35]. The cement grains have irregular shape and very rough surfaces, the radius of curvature of the edges are of the order of magnitude of 500 nm [34]. Cement powder specific surface area measured by Blaine apparatus is often close to 3000-4000 cm2/g.
Figure 1.3: Example of volume distribution of cement grain size in water. Measure has been made with a laser granulometer, in the presence of various amounts of superplasticizer (SP) [36].
Cement density is close to 3.15 g/cm3. Cement content of a paste is usually given in terms of the mass water-to-cement ratio W/C. For a cement paste, solid fractionΦp is
densities of cement and water.
1.3.2 Yield stress fluid
A yield stress fluid is a material which can flow only if applied stress is above a critical stress, called yield stress and noted τy [37]. Below the yield stress, its behaves like an
elastic solid, whose properties are often measured in a rheometer by applying oscillations of small strain amplitude. Above the yield stress, the material flows, and the shear rate ˙γ depends on the applied shear stressτ.
In the case of cement paste, yield stress arises from attractive interactions between ce-ment grains. A model, called Yodel (for yield stress model) has been derived by Flatt and
Bowen [38] to relate the interactions at particle scale with the macroscopic yield stress of a solid suspension. Authors calculate how the unbroken bonds between solid particles affect the effective maximal solid volume fractionΦ∗maxof the suspension: when particles are connected to each other, they can be less effectively packed than unconnected parti-cles, which reducesΦ∗max. Solid suspension can flow only if solid volume fractionΦp is
smaller thanΦ∗max. The yield stress calculated with this approach is:
τy= m1
Φ2
p(Φp− Φper c)
Φmax(Φmax− Φp)
(1.1)
whereΦper c is the minimum solid volume fraction required to create a percolated
net-work of solid grains andΦmaxthe maximal volume fraction of the grains with no
attrac-tive interaction. Φper c as well as Φmax depend on the particle shape and size
distribu-tion. m1 accounts for the intensity of the interparticle forces and is also related to the
size distribution of the particles. The major particle forces are the electrostatic repulsion (for charged particles), the Van der Waals attraction and the steric repulsion (when some polymers are adsorbed on cement grain surface). Cement grains are charged, but due to high electrolyte content of cement paste interstitial solution, the range of the electrostatic repulsion is short: Debye length isκ−1≈ 0.7 nm [39]. When molecules are adsorbed on solid grains and form a layer of thickness hst er aboveκ−1, they create a steric repulsion
between cement grains and increase the interparticle distance h up to 2hst er. Van der
Waal attraction depends on interparticle distance FVd W∝ 1/h2.
Flow properties of cement paste are well fitted with a Bingham model [34,40,41]:
τ = τy+ µdγ˙ (1.2)
withµd the plastic viscosity of the paste. Bothτy andµd are affected by the formulation
of the paste. For instance, a rise of W/C increases not only the yield stress but also the plastic viscosity of the paste.
One of the methods to measure the yield stress consists in measuring the shear stress over a wide range of shear rates and fitting the results with Bingham model (equation 1.2). A second method is the start-of-flow curve: small constant shear rate is applied and shear stress is measured as a function of deformation. Yield stress is the maximum value
of the curve (see Fig. 1.4(a) for a typical start-of-flow curve of cement paste). Different measurement methods can result in different values of the yield stress [36]. Note that the yield stress predicted by the Yodel corresponds to the start-of-flow method, and that this method will be used in the following chapters (see chapters3and4).
Figure 1.4: Example of start of flow curve of cement paste, with two different scales. Measured yield stress is the maximum observed in graph (a), the corresponding critical strain is 2.5%. On graph (b), the critical strain for C-H-S bonds is observed close to 0.05%. [35]
The formation of the structure of cement grains due to Van der Waals forces takes place in a few seconds. The critical strain of the percolated structure, i.e. the deformation needed to break the bonds, is a few percent.
When cement paste is at rest for several minutes, yield stress increases with time. Ini-tial yield stress can be retrieved by a strong shearing of the cement paste. These obser-vations remind the behavior of thixotropic materials [37,41,42]. Their cause is discussed below.
1.3.3 Hydration and thixotropic behavior
Cement paste hardening takes place through the nucleation and growth of hydration products, mainly calcium silicate hydrates (CSH). CSH nucleates preferentially in the pseu-do contact zones between cement grains, i.e. at the places where the distance between solid surfaces is h. CHS hydrates act as solid bonds between cement grains and can be broken when cement paste is sheared. "Rigid" critical strain needed to break the CHS bond is much lower than the critical strain associated to flocculation: only a few hun-dredths of percent [35]. This small critical strain is illustrated in Fig. 1.4(b). The elas-tic properties of cement paste due to CHS bond can be measured with oscillations tests: oscillations of strain amplitude²0< 10−4 are applied, and stress response recorded.
In-phase material response gives the elastic modulus, while out-of-In-phase response accounts for the viscous dissipation.
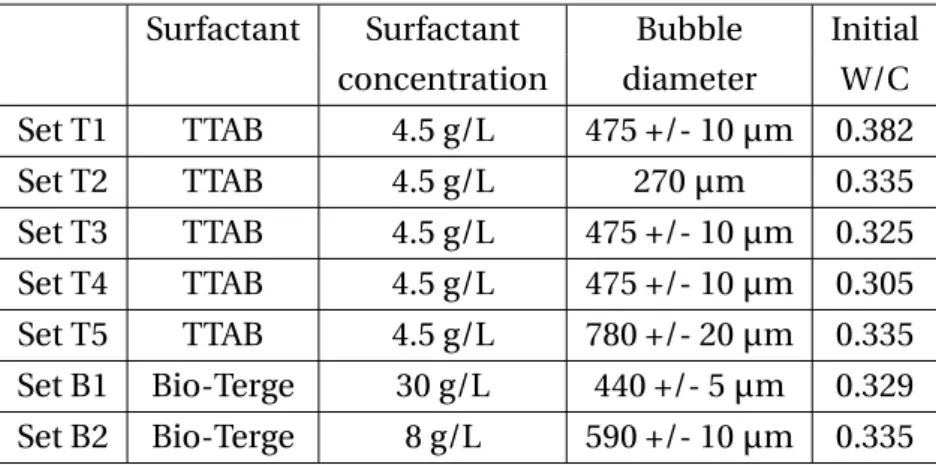
A typical elasticity evolution curve is shown in Fig. 1.5(a). The network of CSH bond is formed in about 100 s. Then elastic modulus increases linearly with time due to the increase of the area of CSH bonds. Formation and growth of CSH bonds are also respon-sible for an increase of the yield stress. The stress at the rigid critical strain, i.e. about
0.05%, increases with time. After a few minutes, it overcomes the stress at the soft critical strain (about 2.5%). That is to say that the measured yield stress during the first minutes is related to the Van der Waals forces, whereas, after about 15 min, it is related to the CSH bonds and increases linearly with time [35] (see Fig.1.5(b)).
Figure 1.5: Evolution of the rheological properties of cement paste with time. (a): Elastic modulus, measured with strain oscillations, amplitude 0.03 % and frequency 1 Hz [35]. (b): Yield stress measured by start of flow curve [35].
1.3.4 The role of chemical admixtures
We have mentioned that, to prepare cement foams in chapters 3 to 5, we will add pre-cursor aqueous foam to cement paste. The prepre-cursor foam contains surfactants. Adding chemical additives to cement paste can strongly affect its properties in the fresh state. Let us first say a few words about the common additives for concrete.
The most used of them are superplasticizers, which make the mix more fluid. Su-perplasticizers are polymers which adsorb on cement grain surface. Layers of adsorbed polymers (thickness hst eris several nm) on neighboring grains cannot interpenetrate and
create a steric repulsion. The increased separation distance h reduces the intensity of Van der Waals forces, which decreases the yield stress.
Rheological properties of cementitious materials can also be modified by the use of viscosity-modifying admixtures. With notation defined previously (see equation1.2), they increase the plastic viscosityµdof the paste with no major modification of the yield stress
τy. These additives are used for instance for self-compacting concrete, whose yield stress
is very low, to maintain a homogeneous distribution of solid particles in the paste [43]. They are large polymers, which can either increase the viscosity of the interstitial solution, create bridges between cement grains by adsorbing simultaneously on several particles or produce depletion forces.
Some superplasticizers delay hydration of cement paste. This is often an undesirable effect due to the surface coverage of cement grains by the adsorbed polymers. When hy-dratation retardation is required, other additives called retarders are used. Most of them are sugars. Their working mechanism is not yet perfectly understood; it may be related to preferential adsorption of these additives on the most reactive cement phases [44].
Other additives include setting accelerators and admixtures to prevent water from freezing.
1.3.5 Surfactants in cement paste
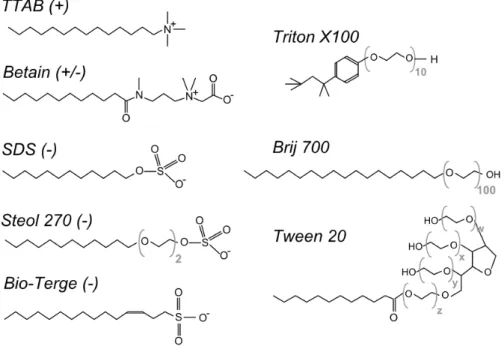
Surfactants, or “surface active molecules", are also widely used concrete additives for two aims: air-entrainment in the production of freeze-thaw resistant concrete and shrink-age reduction. They are amphiphilic molecules, i.e. they are composed of a hydrophilic head and a hydrophobic tail. Surfactants are classified according to the nature of the hy-drophilic head. They are called anionic if the head is negatively charged, cationic if it is positively charged, amphoteric or zwitterionic if both charges are present and non-ionic when it is not charged. In addition to the different hydrophilic heads, surfactants also differ by their molar mass. For usual synthetic surfactants, it is rather low: 288 g/mol for anionic sodium dodecyl sulfate (SDS) studied by [45] and 336 g/mol for cationic tetrade-cyltrimethylammonium bromide (TTAB). On the other hand, molar mass of proteins, used by [12,46], is much bigger than SDS or TTAB, about 20 000 g/mol for instance for casein.
Several authors have observed that surfactants adsorb on cement grains. Fraction of adsorbed surfactant depends both on their chemical formula and on the cement compo-sition [8,47,48]. Reported consequences of surfactant adsorption are a change of cement grains zeta potential [49], a hydrophobization of cement grains [49] and bridging between cement grains [16]. In addition, surfactants may interfere in cement hydration. Complex-ation with calcium ions is reported by [10,45,47] and modification of the structure of the hydration product crystals, by [10,50]. Some authors have also measured a delay of hy-dration due to surfactants [47, 51,52]; Kuzielová et al. [52] note that retardation can be avoided if low amount of surfactant is used.
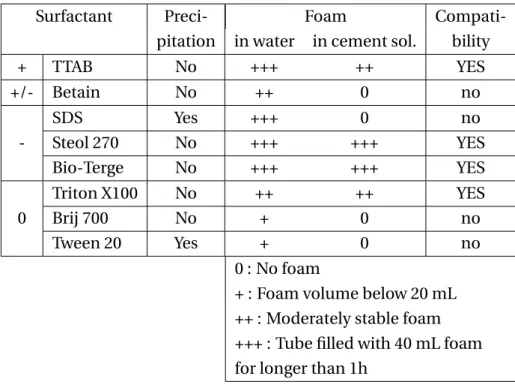
Surfactants used for air-entrainment are called air entraining agent (AEA). They stabi-lize air bubbles which enter the paste during the mixing process. Most of AEA are nega-tively charged [10,16,43]. Some authors mention that voids are more stable in this case [8,9]. Indeed, anionic surfactants tend to adsorb both on air-water interfaces and cement grain surfaces. They create bonds between cement grains and air bubbles, which avoids sedimentation of cement grains and rising of the bubbles.
Shrinkage reducing admixtures are often non-ionic surfactants. Shrinkage reduction is due to their ability to reduce the surface tension [43], and therefore, to decrease the internal stresses due to capillarity during hydration and drying of concrete (see parts1.4.1 and1.4.2for the definition of surface tension and how it is affected by surfactants).
Effect of surfactant on the rheology of cement paste has hardly be studied indepen-dently from the consequences of bubbles addition. We can however mention the study of
Rixom and Mailvaganam [16], who report an increase of apparent viscosityη(˙γ) = τ/˙γ = τy/˙γ+k for several mixing velocities (i.e. several shear rates ˙γ) when anionic surfactant is
added. Non-ionic surfactant, on the other hand, has no effect on rheology.
This short literature review on surfactant in cementitious materials reveals that surfac-tants sometimes have the same consequences as usually concrete admixtures: they may
adsorb on cement grains, delay hydration, bridge the particles... Hovewer, these effects depend of the chemical formula of the surfactants. Systematic investigation of several surfactants is required to elucidate the consequences of surfactants in cement paste, in order to facilitate the selection of surfactants to formulate cement foams.
1.4 Aqueous foams
Foams have raised a lot of attention in the last decades due to their application not only in construction materials, but also in food industry, cosmetics, etc. They are materials containing two phases: gas bubbles are dispersed in a continuous phase. For all these materials, the final properties result, on the one hand, from the properties on the contin-uous phase, and on the other hand, from the role of the air bubbles. Let us first focus on liquid foams. The phenomena described in this part apply to precursor foams used for the cement foam fabrication (see part1.2.1). In addition, they enlighten the role of the bubbles in the behavior of the cement foams. How the cement paste can affect this role is discussed in part1.5.
We will only focus on the most important points to produce and understand cement foams. For a more detailled description of the physics of foams, the reader can refer to the books [53] and [54].
1.4.1 Surface tension and Laplace’s law
The creation of an interface increases the free energy of the system proportionally to the surface area of the interface [55]. This additional surface energy is called surface tension and will be notedγ. In other words, surface tension is homogeneous to a force per unit length; it acts as a force that tends to reduce the area of the interface.
Surface tension leads to a difference of pressure between the phases of each side of the interface, called capillary pressure PC and given by Laplace’s law [53,54,55] (with R1
and R2the major radii of curvature on the interface):
PC= γ µ 1 R1+ 1 R2 ¶ (1.3)
For example, in the case of an isolated bubble in a liquid, surface tension tends to reduce the size of the bubble. Major radii of curvature are equal, R1= R2= R, and Laplace’s
law becomes:
PC= Pg as− Pl i q=
2γ
R (1.4)
1.4.2 Role of surfactant in foams
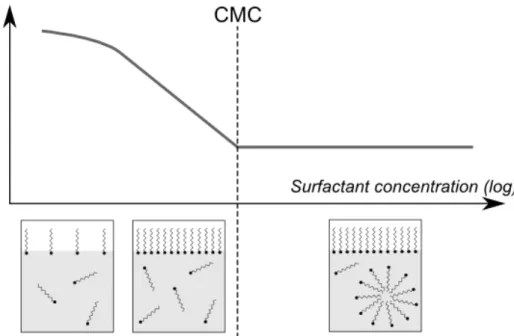
Due to their specific shape, surfactants in solution tend to settle at air-liquid interface, with their hydrophilic head in the aqueous solution and their hydrophobic tail in the air. First consequence is a reduction of the surface energy: when surfactant concentra-tion increases, surface tensionγ decreases down to a minimal value. The minimal value
is reached at the surfactant critical micelle concentration (CMC), it is the concentration above which surfactant molecules gather into agglomerates, with their hydrophobic tail close to each other and hydrophilic head toward the solution. Surfactant agglomerates are called micelles. Surfactant effect on surface tension and distribution in solution is shown in Fig.1.6.
Figure 1.6: Effect of surfactants on air-water surface tension and surfactant distribution as a func-tion of their concentrafunc-tion.
In addition, surfactant adsorbed layer at interfaces lead to a repulsion between the interfaces, which is essential to foam stability [53] (see paragraph1.4.4).
Low molecular mass surfactant diffusion from bulk solution to interfaces is very fast [56]. Time needed to diffuse from the bulk solution to the interface is longer for proteins [56], therefore the surface tension value decreases slowly with time before reaching a min-imum. This make the creation of a foam by shaking or strong mixing more difficult than in the case of low molecular mass surfactants. On the other hand, once adsorbed, proteins hardly desorb from the interface, which explains that the foams are very stable [53].
1.4.3 Foam structure
When the amount of air bubbles in a fluid is increased, surface tension tends to keep the bubbles spherical as long as their are not deformed by their neighbors. We call aerated materials with spherical bubbles “bubble suspensions". In the following, we will distin-guish the suspension regime from the foam regime, where the bubbles are deformed by their neighbors. Note that when continuous phase is a Newtonian liquid, bubble sus-pensions are in practice unstable because of buoyancy forces. Bubble sussus-pensions will therefore not be studied in this part. We will mention them in part1.5.
In a foam, air-liquid surface area is very large. Surface minimization strongly con-straints the foam structure. The morphology of dry foams, i.e. when air fractionΦ is close
to 100%, is ruled by three laws, known as Plateau’s laws from the name of the Belgian physicist who stated them in 1873 [53].
1. Two bubbles are separated by a liquid film of constant average curvature.
2. Three films join in channels called Plateau border and form 120° angles.
3. At each node, four Plateau borders intersect and form 109.5° angles.
Figure 1.7: (a) Illustration of 2nd and 3r dPlateau’s laws. (b) Schema of a Plateau border and nota-tion of r , the radius of curvature of the Plateau border. Figure taken from [53].
When foams are dry, the volume of nodes and Plateau border is small. When the liquid volume fractionΦl = 1 − Φ is increased, Plateau border volume increases and the surface
of the liquid film between two bubbles decreases. The capillary pressure Pc, i.e. pressure
difference between air and liquid in the Plateau borders, can be deduced from Laplace’s law, which can be written with the notations defined in Fig.1.7(b) as:
Pc = Pg as− Pl i q=
γ
r (1.5)
where r depends on the foam liquid fraction. To estimate its value, let us consider now monodisperse foams, where all the bubbles have the same size. WhenΦl< 6.3%, bubble
configuration which minimizes the energy is body-centered cubic, whereas above 6.3%, it is face-centered cubic. Bubble in the body-centered cubic configuration is called Kelvin-Voigt cell. The following relation stands for Kelvin-Kelvin-Voigt cell whenΦl.1% [53]:
r ≈ RpΦl/0.33 (1.6)
Bubbles being not spherical, R is defined as the radius of the spheres having the same volume as the bubbles.
1.4.4 Foam stability
We have seen that the morphology of a foam follows Plateau’s laws and is affected by the liquid fraction. This morphology evolves with time: gravity leads to drainage, and ripen-ing and coalescence tend to make the bubbles grow bigger, which reduces the interface quantity and therefore the total surface energy of the foam. The three foam destabiliza-tion mechanisms are illustrated in Fig.1.8. Let us focus on each of them.
Figure 1.8: Schema of the three foam destabilization mechanisms.
1.4.4.1 Drainage
“Drainage" refers to the destabilization of the foam due to gravity. The interstitial fluid, denser than air bubbles, tend to flow towards the bottom of the foam.
In a liquid foam at equilibrium, the pressure in the liquid continuous phase is equal to the hydrostatic pressure: Pl i q(z) = Pl i q(0) − ρlg z, whereρl is the liquid density and z = 0
at the bottom of the foam, where the bubbles are spherical and air fraction is equal to the maximal volume fraction of disordered spheresΦc= 1 − Φl ,c= 64%. Together with
equa-tions1.5and1.6, it shows that in a foam at hydrostatic equilibrium, the liquid fraction is imposed and depends on height [53]:
1 p Φl(z) −p 1 Φl(0) ≈ p 3ρ2lg2Rz γ2 (1.7)
Examples of the liquid fraction profiles are drawn in Fig.1.9.
When a liquid foam is not at hydrostatic equilibrium, liquid flows between the bub-bles. Foam can be compared with a porous medium of porosityΦl and flow velocity can
be predicted by the Darcy’s law:
u =k µ µ −d Pl i q(z) d z + ρlg ¶ (1.8)
Figure 1.9: Liquid fraction as a function of height in a foam at hydrostatic equilibrium. Curves are plotted from equation1.7withγ = 35 mN/m, ρl = 1000 kg/m3and several bubble sizes: blue
curve, R = 150 µm; red curve, R = 300 µm and green curve, R = 750 µm.
where the permeability k depends on the bubble size and on the liquid content. It is also affected by the surface viscosity and elasticity, which depends on the surfactant [53,57].
The conclusion of this paragraph is that, for a given bubble size, gravity fixes the mor-phology of a simple liquid foam: liquid fraction and the radius of curvature of the Plateau borders are imposed at each height. As soon as the morphology of the foam differs from this structure, liquid flows inside the Plateau borders and nodes. To create cement foams and choose their air fraction, we will therefore need to rely on the complex behavior of cement paste.
1.4.4.2 Coalescence
Two neighbor bubbles are separated with a liquid film made of two air-liquid interfaces. Coalescence occurs when this film ruptures.
Film stability is due to the repulsion between the interfaces and is achieved thanks to the surfactants. Layers of adsorbed surfactant of each interface repel each other due to electrostatic repulsion (for ionic surfactants) and steric repulsion. The presence of non-adsorbed surfactant micelles, or protein or polymer in the film can also enhance interface repulsion [53]. The thickness of the film is typically a few tens of nanometers for low molecular weight surfactants, and can be bigger for instance in the case of proteins [53, 57] .
Studies on an isolated film shows that the film ruptures when the pressure in air on each side of the film reaches a critical value, the maximal disjoining pressure, which can be deduced from the above described interface interactions. However, in a foam, film rupture can be observed even if bubble pressure is below the maximal disjoining pressure. Dynamic effect play also a role. For instance, creation of a new film during topological rearrangement can lead to rupture if liquid fraction is too low [58].
Key point is that the repulsion between interfaces depends not only on the chosen surfactant and its concentration, but also on the liquid composition. In particular, elec-trostatic repulsion has no effect if the distance separating the interfaces is above twice the Debye length [56]. The Debye length decreases when the concentration of ions in the so-lution decreases. Therefore, surfactant which are able to stabilize a foam in water might not be as efficient in cement paste, where electrolytes concentration is very high.
1.4.4.3 Ostwald ripening
As a consequence of Laplace’s law, pressure in the smaller bubbles is higher that in the bigger bubbles. As gas migrates from the high pressure areas to the lower pressure areas, the size of the smaller bubbles keeps decreasing until they disappear. This phenomenon, called Ostwald ripening, leads to a reduction of the number of bubbles in time and to an increase of their average radius. In a foam, gas crosses the liquid films. A freshly prepared foam first undergoes a transient regime, during which ripening occurs only locally. Then, during the so-called auto-similar regime, the average radius of the bubbles is proportional to the square root of the time. In a bubble suspension where there is no film between the bubbles, ripening is slower: average radius increases as the cubic root of the time.
Ripening velocity of a 3D aqueous foam depends on several factors. Firstly, ripening depends on the morphology of the foam. If the foam is initially monodisperse, ripening is very slow at the beginning: after an induction period where no change can be observed, the transient regime occurs. Then the auto-similar regime finally takes place. In addition, ripening is faster if the initial bubble size is smaller. Secondly, the nature of the gas affects ripening: the less soluble the gas is, the slower the ripening. Thirdly, surfactant plays a major role: increasing the film thickness, creating of a less permeable layer near the interface and increasing the surface elastic modulus all slow down ripening [57,59].
1.4.5 Foam rheology
Let us say a few words about emulsions. Emulsions are a suspension of liquid drops in a non-miscible liquid continuous phase. Like air-water interfaces, the interface between both immiscible liquids can be stabilized by surfactants. Concentrated emulsions, i.e. where dispersed phase volume fraction is above the maximal sphere volume fraction, pos-sess a structure very similar to foams. Emulsion destabilization mechanisms are the same as for foams, but they are usually slower, which makes their study easier. In particular, liquid phases can have the same density and drainage effects can therefore be discarded. This makes experimental investigation of the rheology of emulsions easier than for foams. Most results obtained on emulsions are however true for foams [60,61] and we will use them in this paragraph.
Foams (and concentrated emulsions) are yield stress fluids. When applied stress is small, bubbles stay in place while films and Plateau borders elongate: foams behave like an elastic solid. When applied stress is above the yield stress, bubbles displacement makes the foam flow.
1.4.5.1 Solid regime
Similarly to cement paste (see part1.3.3), elastic properties of foams and emulsions in the solid regime can be measured by oscillation tests. Viscous modulus is one order of magnitude below the elastic modulus [61].
Foam elastic modulus does not depend on oscillation frequency in the range 0.01 - 1 Hz. For a monodisperse foam, it is related to foam structure by equation1.9. This empir-ical relation has been first obtained on emulsions [62] with cone and plane geometry and Couette geometry. It has been later confirmed with a Couette tool on foams [60,61]:
G0aq= αγ
RΦ(Φ − Φc) (1.9)
whereα value is 1.4 according to [60,61], while the value measured by [63] is 1.8.
The critical strain can be of the order of magnitude of 1 for dry foams and decreases down to zero when liquid content increases and bubbles or drops become spherical [53, 61,64].
1.4.5.2 Flow
Flow curve for liquid foams can be modelled by an Hershel-Bulckley law [61,65,66,67]:
τy= τy,aq+ k ˙γn (1.10)
The exponent n is about 0.5 in the absence of viscous dissipation and shear thinning effects in films, and below otherwise[61, 67]; it is therefore affected by surfactant. The plastic viscosityµd depends on the air fraction.
Yield stress dependence on liquid fraction has been experimentally observed for emul-sions [64] and for foams [60]:
τy,aq= α
γ
R(Φ − Φc)
2 (1.11)
Coefficientα depends on the measurement method. In [53], it is mentioned thatα varies between 0.2 and 0.5; value measured in [68] is 0.6.
1.4.6 Conclusion on aqueous foams
Production of an aqueous foam is possible thanks to the stabilization of the liquid films between the bubbles by surfactants. The morphology of a monodisperse foam at given air fraction and bubble size is ensured by the surface tension. However, foam destabilization due to drainage, ripening and coalescence makes the control of the liquid fraction and bubble size difficult. This raises major challenges to manufacture cement foams with controlled morphology.
Cement foam stability issues are sometimes solved by increasing hydration speed, by using fast setting cement [69] or adding accelerator admixtures [6,7,26]. However, fast setting cements cannot be used for all applications, especially if the time needed to put in place the material can vary. Therefore, we choose to investigate how the properties of the fresh cement paste itself, as described in part1.3, can stabilize the cement foam.
1.5 Complex foams and bubble suspensions
We have seen in section1.3that a cement paste is a suspension of solid grains and that it behaves as a yield stress fluid. To investigate how this can affect the foam stabiliy, we first focus on granular foams (parts1.5.1and1.5.2), and then on the effect of yield stress (part 1.5.3).
1.5.1 Hydrophobic particles
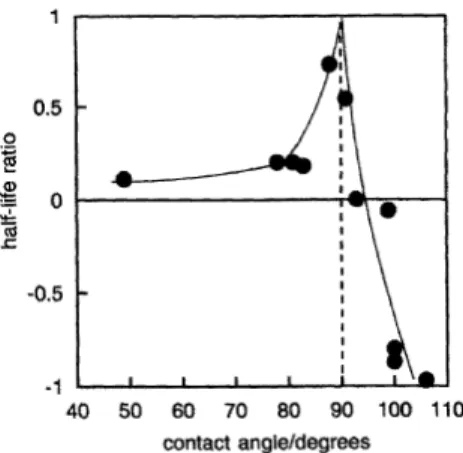
Ramsden in 1904 [70] and Pickering in 1907 [71] studied respectively foams and emulsions containing particles and reported a very good stability. Best stability is achieved when contact angleθ of air-liquid interface on the solid surface is close to 90° (see example on Fig.1.10).
Figure 1.10: Effect of the addition hydrophobised Ballotini beads on the stability of aqueous foam. Half life ratio is (tp ar t− taq)/taqwhere tp ar t is the half life duration of the foam with particles and taqthe half life of the aqueous foam. Graph taken from [72]
This remarkable stability is achieved thanks to the adsorption of the particles at air-liquid interface [56, 73, 74]. Note that for partially hydrophobic particle adsorption to occur, the particles must be small enough to be able to diffuse to the interface within the time of the experiment. In addition, adsorption barrier, due for instance to electrostatic repulsion between interface and particle, must be small enough [56]. When these con-ditions are fulfilled and a spherical particle of radius a reaches the interface, desorption energy is given by [73]:
EDes= γa2π(1 − |cosθ|)2 (1.12)
Desorption energy is maximal and equal toγa2π when θ = 90°, drops to γa2π/4 when θ = 60° and is equal to zero for fully hydrophilic (θ = 0°) or fully hydrophobic (θ = 180°) particles.
Let us first mention that experiments have showed that adsorbed spherical particle monolayer can stop the propagation of a hole in the film [75].
Besides, particles tend to prevent the formation of holes in the film. Coalescence is avoided when adsorbed particles in films can stop the reduction of liquid film thickness to zero. The critical pressure which leads to zero film thickness depends on the configu-ration of the particles in the film. It has been theoretically calculated for a closely packed single layer and double layer of spherical particles [73, 76] (see illustration of configu-rations in Fig1.11). For both configurations, calculated critical pressure is higher when θ = 0° and decreases with contact angle. Film ruptures if (1) particles desorb or (2) film thickness between the adsorbed particles reaches zero. Combination of these two condi-tions leads to an optimal contact angle for film stability for each configuration: 70° for a single layer of particles and 86° for a double layer [76].
Figure 1.11: Left: illustration of double layer (A) and single layer (B) of particles [56]. Right: Di-mensionless pressure leading to film rupture [77]
Several authors have studied foams stabilization with colloidal particles [78,79,80], with diameter ranging from several 10 nm to a few 100 nm. Van der Waals and electro-static attractions between particles lead to the formation of agglomerates in the films which can enhance film stability. One possible explanation is the increase of the criti-cal pressure at which the film thickness is zero due to a 3D organisation of the particles in the films [76,80]. Gautier et al.[78] also observed the stabilization of foams with inter-faces weakly covered by particles and suggested that this stability is due to the formation of patches of particles at contact areas between the bubbles.
In addition to reducing the risk of coalescence, adsorbed particles around a bubble can prevent gas dissolution into liquid phase and gas transfer to the neighboring bubbles. Ripening is stopped at one of the two following conditions:
• The overpressure inside the bubbles becomes zero: Pg as−Pl i q= 0, or in other words,
the macroscopic surface tension of the interface with particles becomes zero [56]. Observations of the shape of the bubbles [81,82] and numerical simulations [83] showed that when the size of an armored bubble decreases, its shape does not re-main spherical, as shown in Fig. 1.12. When the bubble deforms, the shape of the air-liquid interface between the particles also changes: it takes the form of a sad-dle, with average curvature zero, which, as shown by Laplace’s law (equation1.3), cancels the overpressure [83].
• Decrease of bubble volume leads to a decrease of gas pressure: d Pg as/d R > 0. This
condition is fulfilled when the adsorbed particles form an elastic shell of elastic modulus Es = −Σdγ/dΣ with Σ = 2πR2 and when this elastic modulus fulfills to
Gibbs criterion, Es> 2γ [79,84].
Figure 1.12: Images of deformed armored bubbles at two different particle-bubble size ratio: faceted shape for a/R = 0.19 (C) and crumpled shape for a/R = 0.008 (D). Scale bars are 8 µm long [83].
How can particle adsorption at interfaces be used to prepare cement foams? A solu-tion succesfully implemented by Krämer et al. [4,21] is the use of hydrophobized nanosil-ica particles in the precursor foams. We can also wonder in which conditions cement grains can themselves stabilize the interfaces. It has been shown that adsorption barrier is proportional to the radius of curvature of the edge of the particles [56]. In this extent, cement grains, due to their irregular shape, are good candidates to adsorb at interfaces. In addition, adsorption barrier is reduced when electrolyte concentration is high, which is the case in cement paste interstitial solution. However, using cement grains to stabilize the interfaces requires to make them hydrophobic.
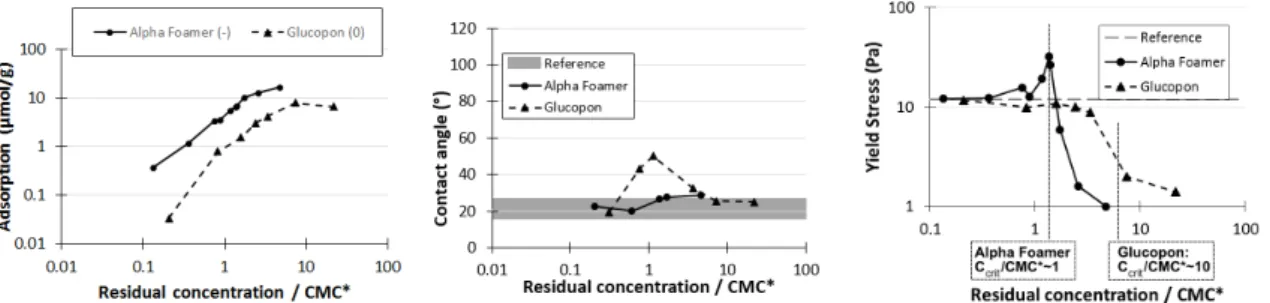
In practice, hydrophobization of solid particles can be achieved by the adsorption of surfactants. The review [85] describes adsorption mechanisms of ionic and non-ionic surfactants on solid surfaces. In the case of ionic surfactant in presence of an oppositely charged solid surface, adsorption takes place in two phases. At low surfactant concentra-tions, surfactant charged head is oriented to the solid surface, and hydrophobic tail, to the solution (see Fig.1.13, (b)). In this regime, contact angleθ increases which increasing sur-factant concentration until a maximal value. In the second regime, sursur-factant molecule agglomerate on the solid surface. Hydrophilic heads of adsorbed molecules in the second layer are directed toward the solution; thus, contact angle decreases when surfactant con-centration increases (see Fig. 1.13, (c)). Contact angle of the solid particles can therefore be monitored by surfactant concentration.
In the case of cement, adsorption for anionic surfactant is higher than cationic sur-factant [48,86]. When anionic surfactant concentration increases, cement grain contact
![Figure 1.5: Evolution of the rheological properties of cement paste with time. (a): Elastic modulus, measured with strain oscillations, amplitude 0.03 % and frequency 1 Hz [ 35 ]](https://thumb-eu.123doks.com/thumbv2/123doknet/2589838.56952/27.892.183.691.229.433/evolution-rheological-properties-elastic-measured-oscillations-amplitude-frequency.webp)