1
Enhancing Knowledge for Renewed Policies against Poverty
Working Paper n° 15
Corrupt governments do not receive more
state-to-state aid: Governance and the
Delivery of Foreign Aid through Non-State
Actors
Martin Acht, Toman Omar Mahmoud, Rainer Thiele
IfW
This project is funded by the European Union under the 7th Research Framework Programme (theme SSH) Grant agreement nr 290752. The views expressed in this press release do not necessarily reflect the views of the European Commission.
Corrupt Governments Do Not Receive More State-to-State Aid:
Governance and the Delivery of Foreign Aid
through Non-State Actors
Martin Acht
*Toman Omar Mahmoud
Rainer Thiele
December 2014
Abstract: A core result of the aid allocation literature is that the quality of
governance in recipient countries does not affect the amounts of foreign aid received. Donor countries may still give aid to poorly-governed countries because of a dilemma they face: those countries most in need typically also lack proper institutions. This paper argues that donors try to resolve this dilemma by delivering aid through non-state actors. Using aid shares as well as absolute amounts of aid allocated through state and non-state channels and considering different dimensions of governance, we provide evidence that bypassing governments via NGOs and multilateral organizations is indeed a response to weak recipient state institutions. The effect is stronger in aid sectors where donors can more easily switch between channels, and weaker for higher levels of economic self-interest among donors.
Key words: aid allocation, aid channels, governance JEL: F35, D73, L31, F53
* Martin Acht: University of Bonn ([email protected]); Toman Omar Mahmoud: Kiel Institute for the World
Economy ([email protected]); Rainer Thiele: Kiel Institute for the World Economy ([email protected]).
We thank Thomas Dohmen, Thomas Gall and two anonymous referees as well as seminar participants in Bonn, Brussels, Dakar, Kiel and Passau for helpful comments and discussions. Funding from the European Commission under the 7th Research Framework Program (NOPOOR, grant agreement no. 290752) is gratefully acknowledged.
1. Introduction
After a period of general pessimism regarding the effectiveness of foreign aid (e.g., Boone 1996), the World Bank’s much-cited ‘Assessing Aid’ study (World Bank 1998) marked a turning point, suggesting that donors could contribute to economic growth in developing countries, but only if they focused their engagement on recipients with reasonable levels of governance. Even though the empirical results that underlie the World Bank’s conclusion (Burnside and Dollar 2000) were later shown to be fragile (Roodman 2007), the donor community has recurrently stressed the importance of good governance for effective development cooperation (e.g., DfID 2011; Hout 2007). Yet, a core result of the aid allocation literature is that the quality of governance in recipient countries has hardly affected the amounts of aid actually committed and disbursed (e.g., Bueno de Mesquita and Smith 2009; Hoeffler and Outram 2011). This appears to hold most robustly for corruption, the element of governance that has been given particular attention by donors (e.g., Clist 2011; Easterly 2007; Nunnenkamp and Thiele 2013). Alesina and Weder (2002) even provide evidence that corrupt governments receive more aid.
The most common explanation for the fact that aid flows do not seem to reflect recipient countries’ quality of governance is that considerations of recipient merit are dominated by other donor motives. There is ample evidence, for example, that donors pursue a variety of political self-interests when giving aid. These range from preserving ties with former colonies (Alesina and Dollar 2000) to influencing the voting behavior in the Security Council or General Assembly of the United Nations (Kuziemko and Werker 2006; Dreher et al. 2008) or the outcome of specific elections (Faye and Niehaus 2012). Foreign aid is also used to further trade links with recipient countries (Berthelemy 2006).
An alternative explanation, from which this paper departs, is that donors may hesitate to withdraw support from badly-governed countries as a result of a dilemma they face: exactly those countries most in need of assistance also tend to lack proper institutions. One way of trying to resolve this dilemma is to bypass recipient governments and deliver aid through non-state actors. While a sizeable share of aid by OECD donor countries is indeed channeled through non-state actors, the reasons underlying this pattern are not well understood. Some papers examine whether the conventional donor motives – need, merit and self-interest – differ between aid channels but take the existence of these channels as given and do not try to explain why aid is delivered through state or non-state actors. Dreher et al. (2010), for example, find that Swedish aid that is directly transferred to recipient governments is targeted towards countries with lower GDP per capita whereas aid channeled through NGOs is not. Nunnenkamp and Öhler (2011) document that the
various aid channels employed in Germany differ significantly in the extent to which need and merit are taken into account but that no aid channel is unambiguously superior.
This paper explicitly investigates the role of recipient governance for donors’ decisions to channel aid through state or non-state actors. A similar argument has recently been made by Dietrich (2013) in the political science literature, according to which bypassing governments via NGOs, private contractors, public-private partnerships and multilateral organizations is a response to weak recipient state institutions.2 In addition to providing an explanation of why donors channel aid through non-state actors, we also contribute to the debate on donor motives. Specifically, we interpret bypassing as evidence that donors are not as selfish as the aggregate relationship between aid and governance would imply. The rationale is that bypassing at a sizeable scale is hardly plausible without donor altruism because self-interest can best be pursued through direct state-to-state interactions. Indeed, on average 25 percent of all aid committed in 2008 was in the form of state-to-non-state transfers. There is considerable variation across recipient countries, ranging from 8 percent at the 25th percentile to 40 percent at the 75th percentile. Governance alone explains up to 30 percent of this variation.
Our analysis proceeds in three steps. First, we analyze the relationship between institutional quality and the share of aid that is given to a recipient country as state-to-state transfer. In addition to conventional indicators of institutional quality, we use multiple dimensions of “bad” governance such as human rights violations, lacking representativeness of the government, or high levels of military expenditures. We are thus able to obtain a more comprehensive picture of the motives that might lead donors to circumvent governments. Second, we analyze the absolute amounts of aid allocated through different channels to get an indication of the scale of bypassing. While a higher share of foreign aid channeled through non-state actors would hardly matter for a weakly governed recipient country if overall donor engagement in that country was very low, higher absolute amounts would point to bypassing that is quantitatively important. Using absolute amounts also enables us to directly relate our findings to the previous literature on aid and governance that is based on specifications in levels (e.g., Alesina and Weder 2002). Third, we check whether there is heterogeneity in the relationship between governance and the channel of aid delivery that is consistent with donors bypassing weak state institutions. We first test whether bypassing varies across aid sectors as it should be easier for donors to work with non-state actors in some sectors than in others. For instance, donors may be able to channel aid through NGOs in the case of emergency assistance or health interventions such as vaccinations, while this may be more difficult for larger-scale projects such as investments in road infrastructure. We then check whether donors
2 An alternative donor response to weak governance is to bypass recipient aid management systems and to rely on
with a higher degree of self-interest are less inclined to use non-state aid channels in countries with poor governance as they want to preserve their leverage with recipient governments.
We obtain robust evidence for bypassing of governments in relative terms and for the case of corruption and military expenditures also in absolute amounts of foreign aid that is channeled through non-state actors. A one standard deviation decrease in the quality of governance is associated with a two to four percentage point lower share of aid delivered through state actors. As expected, bypassing is targeted towards aid sectors where the degree of substitutability between channels of delivery is high and becomes less prevalent with a higher degree of economic self-interest.
2. Data and Descriptive Analysis
Data on the channel of delivery come from the OECD’s Development Assistance Committee (DAC). Through its Creditor Reporting System (CRS), DAC documents all flows of Official Development Assistance (ODA) of DAC member countries (as well as some non-DAC countries and multilateral organizations) to developing countries. The CRS offers donors the option to report the channel of delivery for every aid transaction to a recipient country. The available channels of delivery include (i) the public sector of the recipient government, (ii) national and international NGOs, (iii) multilateral organizations such as UNDP or the World Bank, and (iv) other development actors such as private contractors.
The share and absolute amount of ODA delivered via different channels to a given recipient country is based on the bilateral aid commitments of all DAC member countries in 2008.3 Commitments are commonly used in aid allocation studies because they constitute the only variable over which donors exert full control if for some reason recipients lack the willingness or administrative capacity to request committed resources (see, e.g., Neumayer 2003). For almost a third of the 181,852 bilateral aid transactions recorded by the CRS in 2008, the channel of delivery is not readily coded. This is because the channel of delivery is not a mandatory item in the CRS. We code these missing cases by determining whether the implementing organization (whose name is mandatory to provide) belonged to the public sector, was an NGO, a multilateral organization or another non-state development actor.4
3 As of 2008 DAC member countries include Australia, Austria, Belgium, Canada, Denmark, Finland, France,
Germany, Greece, Ireland, Italy, Japan, Luxembourg, the Netherlands, New Zealand, Norway, Portugal, Spain, Sweden, Switzerland, United Kingdom and the United States. In the very few cases for which aid commitments were not reported, we used aid disbursements instead.
4 We take a recent year for which a fairly complete data set could be compiled and refrain from adding a time
dimension to the analysis because this would provide little additional explanatory power given the highly persistent governance indicators. However, we test whether our results are robust to using other years (see robustness checks below).
The focus of our analysis is on whether aid is channeled through state or non-state actors. In the following, we therefore only distinguish between aid channeled through the public sector (henceforth state-to-state aid) and aid channeled through NGOs or multilateral organizations (henceforth state-to-non-state aid). Our main outcomes of interest are the share of state-to-state aid as well as the absolute amount of state-to-state and state-to-non-state aid in 2008.
Figure 1 plots the share of state-to-state aid, overall and by donors. Overall, 75 percent of aid committed in 2008 was in the form of state-to-state aid. In other words, an important share of aid is delivered through non-state channels. There is considerable variation across donors. The share of state-to-state aid exceeds 90 percent for donors such as Germany, Japan, and France, but is only between 40 and 60 percent for the Netherlands, Sweden and Norway, who all belong to the group of donors that are considered to be driven more by recipient need and less by economic or political self-interest than other donors.
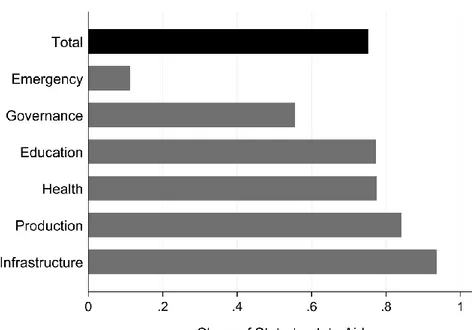
The share of state-to-state aid varies considerably over aid sectors, too. As Figure 2 shows, humanitarian assistance stands out as being predominantly channeled through non-state actors. Among the remaining sectors, the share of state-to-state aid ranges from 55 percent for governance, via 77 percent for health and education to almost 95 percent for infrastructure (see Table A1 in the appendix for definitions of the sectors). This pattern is consistent with the notion that it should be easier for donors to bypass the recipient government in sectors where the degree of substitutability between state and non-state actors is relatively high. By high degree of substitutability we mean that, for reasons unrelated to governance, state actors should have no large comparative (dis)advantage over non-state actors when implementing a project in a given sector. Hence, bypassing should be more prevalent in sectors such as governance or health where donors can run relatively small-scale projects that do not require much coordination with the recipient government (e.g., support to advance civil and political rights, female empowerment, feeding programs or basic health care including vaccination campaigns). Bypassing should be less prevalent, however, in sectors such as infrastructure where donors typically run relatively large projects that require strong and continuous high-level support from the recipient government and where little support may be provided by non-state actors such as NGOs (e.g., roads, dams or electricity supply). In fact, most development NGOs including Feed the Children, World Vision, Food for the Poor, Catholic Relief Services, Care, or Amnesty International focus on sectors like food security, health, education, or advocacy (Werker and Ahmed 2008) where bypassing is relatively easier.
Does the quality of governance in the recipient country matter for a donor’s decision to choose state or non-state actors as implementing partners? To answer this question, we consider four measures that aim to capture different dimensions of governance. Our first measure is the control of
corruption index that is published as part of the Worldwide Governance Indicators by the World Bank. It captures perceptions of the extent to which public power is exercised for private gain, including both petty and grand forms of corruption, as well as “capture” of the state by elites and private interests (Kaufmann et al. 2009). It ranges from -2.5 to 2.5, with higher scores corresponding to better governance. The control of corruption index is a broad measure of institutional quality that has been widely used in the literature on aid allocation. As corruption increases the risk of a recipient government’s capture of aid, we expect more corrupt countries to receive relatively less state-to-state aid.
The other three measures cover more specific dimensions of the quality of governance. Our second measure is the physical integrity rights index that comes from the Cingranelli-Richards Human Rights dataset (Cingranelli and Richards 2010). It captures a government’s respect for internationally recognized human rights by documenting incidences of torture, extrajudicial killings, political imprisonment and politically motivated disappearances. The physical integrity rights index ranges from 0 to 8, with higher scores corresponding to better outcomes. To ease understanding, we refer to the physical integrity index as human rights score in the following. As the respect for human rights reflects the integrity of a recipient government, we expect countries with more human rights violations to receive less state-to-state aid.
Our third measure is the size of the powerless population as a share of the overall population that comes from the Ethnic Power Relations dataset. The size of the powerless population is defined as the percentage of the population who belong to an ethnic group whose representatives hold no political power at the national or regional level (Cederman et al. 2010). As the recipient government may be more likely to exclude people with no political representation from the proceeds of aid (Hodler and Raschky 2014), and donors may care about the distribution of aid, we expect countries with larger parts of powerless population to receive less state-to-state aid.
Our fourth measure is the size of military expenditures that comes from the World Bank’s World Development Indicators. The size of military expenditures is defined as the percentage of overall government expenditures that is spent on the military. As state-to-state aid may at least to some extent be fungible and allow the recipient government to spend more resources on less desired purposes such as the military, we expect countries with larger military expenditures to receive less state-to-state aid.
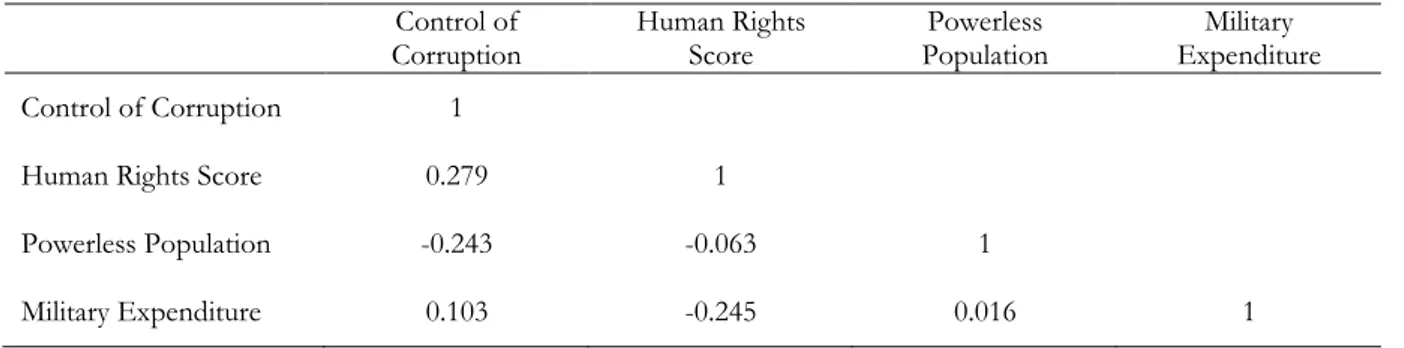
These four measures arguably cover different aspects of a recipient country’s quality of governance. The risk of capture of aid, respect for human rights as well as the distribution and utilization of aid in the recipient country may all affect a donor’s decision to channel aid through state or non-state
channels, but their effects may well work independently. Indeed, as Table 1 shows, the correlation between our four measures of governance is relatively low.
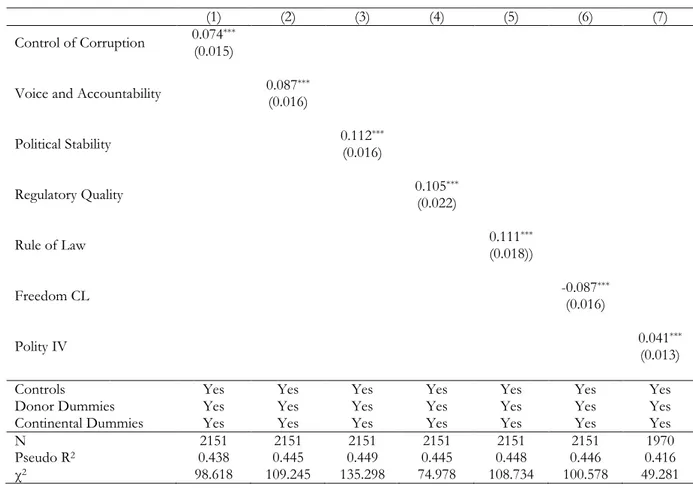
By contrast, control of corruption is highly correlated with the other five measures of the World Bank Governance Indicators (voice and accountability, political stability, government effectiveness, regulatory quality, rule of law). The correlation coefficients for the different indicators are between 0.70 and 0.88 in our sample. The high correlation clearly suggests that these indicators capture similar underlying institutional structures. Our analysis therefore focuses on the four dimensions of governance introduced above, taking control of corruption to be representative of a set of similar measures of institutional quality because it figures most prominently in the aid allocation literature and is also frequently mentioned by governments as a crucial factor when deciding about aid. All our results are, however, robust to using other measures of the World Bank Governance Indicators as well as the Freedom House and Polity IV scores (see robustness checks below).
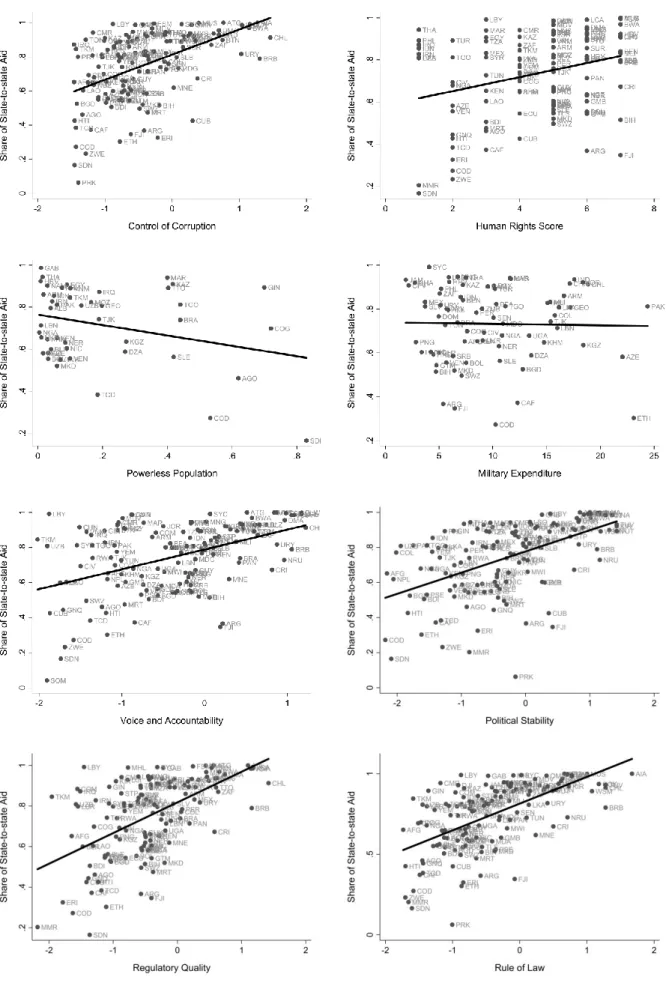
Figure 3 plots the share of state-to-state aid against our four measures of governance. In line with our hypothesis, it clearly shows that countries with a better quality of governance receive more aid through state channels. For example, for countries such as Somalia or Sudan with relatively low levels of control of corruption the share of state-to-state aid received in 2008 was only 4 and 16 percent respectively. By contrast, for countries such as Bhutan or Namibia with relatively high levels of control of corruption the share of state-to-state aid was 90 percent. Overall, control of corruption explains 29 percent of the variation in the share of state-to-state aid. The picture is similar for the other measures of governance, even though the relationship is less pronounced for the size of military expenditures. This may be due to confounding military and strategic motives on behalf of some donors that could affect both the share of state-to-state aid and the size of military expenditures in the recipient country. Pakistan is a case in point where a high share of state-to-state aid is associated with high military expenditures, which arguably reflects the specific geo-political interests of its principal donor, the United States. We also plot the share of state-to-state aid against other commonly used governance indicators. For all indicators the share of state-to-state aid increases with the quality of governance.
3. Empirical Strategy
We estimate equations of the following type to analyze the relationship between state-to-state aid and the quality of governance
:
state-to-state-aid
ij=α+governance
i’β+X
ij’γ+ε
ij(1)
where state-to-state-aidij is the share or the absolute amount of state-to-state aid that recipient
(potential) donor-recipient country pair in a joint model. Depending on the specification, the vector
governancei contains one or all of the four measures of the quality of governance in recipient country
i that we introduced above. We standardize all governance measures to N(0,1) to ease interpretation and make the magnitude of marginal effects more comparable. If better governance increases state-to-state aid, we expect β to be positive. Since it has been shown that the allocation of aid also depends on factors other than governance, we add a vector Xij of control variables.
We use different dependent variables to capture both the relative and absolute importance of state and non-state channels of aid delivery. Our first dependent variable is the share of state-to-state aid that recipient country i received from donor j. This variable is bounded between zero and one and takes on the extreme values of zero and one with positive probability (i.e., a donor may give all its aid to a recipient country in the form of state-to-state or state-to-non-state aid). We therefore estimate the model employing the fractional logit method as proposed by Papke and Wooldridge (1996) for the case of proportions as dependent variables.5
Donors may not only reduce the proportion of aid that is given through state actors to bypass the government of a recipient country. They may also lower the absolute amount of overall (state-to-state and (state-to-state-to-non-(state-to-state) aid to that recipient country. To consider this possibility, our second set of dependent variables includes the absolute amount of (i) overall, (ii) state and (iii) state-to-non-state aid that recipient country i received from donor county j. As many donors only give aid to a subset of potential recipient countries, these variables have many zero observations. We therefore estimate (1) using the poisson pseudo maximum likelihood (PPML) method. Santos Silva and Tenreyro (2006 and 2011) show that PPML outperforms OLS and Tobit models in the presence of heteroskedasticity and many zero observations.
In choosing our control variables, we follow the aid allocation literature and distinguish between recipient need and donor interest. To proxy recipient country i’s need, we include its GDP per capita, population size and the number of people who died as a result of natural disasters in the preceding period (2000-2008). It should be noted, however, that this interpretation only applies for the specification using aid amounts as dependent variable. When it comes to explaining aid shares, recipient country i’s GDP per capita and population size rather signal its economic importance. Donors can be expected to favor direct engagement with governments, i.e. to distribute a high share of aid through state channels, in recipient countries they regard as economically important. The number of deaths from natural disasters controls for the exceptional role of non-state actors in humanitarian assistance (see above), with more deaths giving rise to a higher share of state-to-non-state aid.
To proxy donor country j’s self-interest, we include the amount of exports from donor j to recipient country i, the amount of proven crude oil reserves in country i, and a dummy indicating whether donor j and recipient country i have had a colonial relationship in the past. We also control for how “close” donor j and recipient country i are by including the geodesic distance between the two countries and the number of migrants from recipient country i who live in donor country j as a share of country j’s population. We expect a donor to deliver more aid, and also a larger share of its aid budget, through state channels when its self-interest and “closeness” to the recipient country is high as government-to-government transfers may be more effective in reaching non-development goals of the donor. In addition to the control variables, the regressions include a set of donor and continental dummies.6
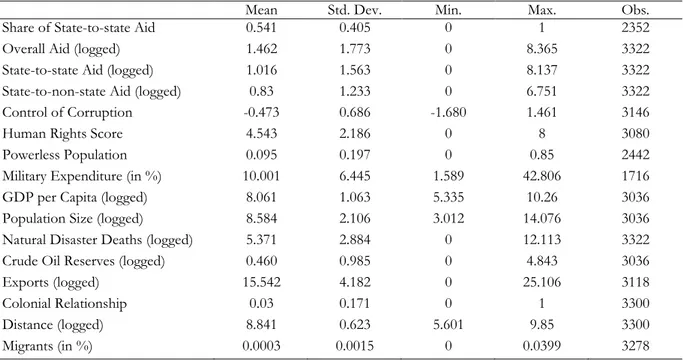
Table A2 in the appendix contains a detailed description of all variables used in the analysis including their data sources, while Table A3 provides summary statistics. In principle our sample includes 3,322 donor-recipient country pairs (22 donor * 151 recipient countries). For a given donor-recipient pair, the share of state-to-state aid is only defined for non-zero volumes of overall aid. As many donors are only active in a subset of the 151 potential recipient countries, the share of state-to-state aid is therefore only defined for 2,352 donor-recipient pairs. This explains why there are fewer observations on aid shares than on absolute amounts of aid in Table A3. Data availability for the explanatory variables further reduces the sample size depending on the specification.
Standard errors are clustered at the donor country level to take into account that a donor’s propensity to channel aid through state actors is likely to be correlated across recipient countries. This is because every donor follows a specific mix of motives for foreign aid (altruism, self-interest, merit) and likely uses different modalities for delivering aid to countries with low (or high) levels of governance.
All explanatory variables are lagged to mitigate concerns of reverse causality (for details see Table A2). To address remaining endogeneity concerns, we additionally perform a robustness test where we use an instrumental variable for control of corruption. The instrument is taken from the literature that links institutional to cultural traits such as individualism (e.g., Licht et al. 2007; Tabellini 2008). It is specified as a dummy variable that takes on a value of one if a country’s primary language permits the speaker to drop a pronoun when it is used as the subject of a sentence, and zero otherwise.7 In languages that do not allow pronoun drop, the subject stands apart from the context of the rest of the sentence, pointing to an individualistic culture. Licht et al. (2007) argue that individualism is less
6 Continental dummies are defined for the following regions: East Asia, Pacific and Oceania; Europe and Central
Asia; Latin America and Caribbean; Middle East and North Africa; South Asia; Sub-Saharan Africa.
compatible with corruption as bribe-taking entails disrespect for the interest of the less powerful. They show that individualism as proxied by pronoun drop is correlated with lower levels of corruption. In the spirit of Spolaore and Wacziarg (2013) pronoun drop, a culturally transmitted trait, likely accounts for deep-rooted variation in institutional development. It may therefore also explain variation in the other three governance measures and hence affect aid patterns through these channels, too. To account for this possibility, we include the other three governance measures as control variables in both the first and second stage (similar to Tabellini 2008). Conditional on these control variables, our identifying assumption then is that pronoun drop only affects aid patterns through its effect on control of corruption.8
4. Results
4.1. Recipient governance and the share of aid channeled through state actors Base specification
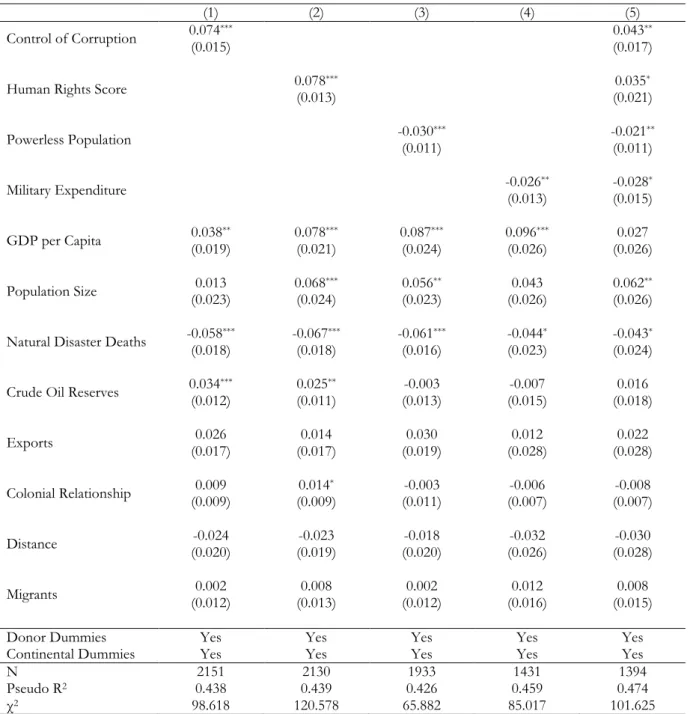
Table 2 presents our main results with the share of state-to-state aid as dependent variable. Columns 1-4 show the results of single specifications for each of the four governance measures, column 5 the results of a joint specification with all four governance measures included as simultaneous regressors.9 Consistent with our hypothesis, the quality of governance is significantly and positively associated with the share of state-to-state aid in all specifications. This finding is in accordance with Dietrich (2013), who documents a similar relationship between the share of state-to-non-state aid and aggregate World Bank governance indicators. The size of the marginal effects is substantial. A one standard deviation increase in the control of corruption index (which corresponds to the difference between Kenya and Ghana) is associated with a 4.3 percentage point increase in the share of state-to-state aid. Similarly, a one standard deviation increase in the human rights score (which corresponds to the difference between Laos and Vietnam) is associated with a 3.5 percentage point increase in the share of state-to-state aid, while a one standard deviation increase in the share of the powerless population (which corresponds to the difference between Botswana and Mozambique) and military expenditures (which corresponds to the difference between Tunisia and Egypt) is associated with a 2.1 and 2.8 percentage point decrease in the share of state-to-state aid, respectively (all marginal effects are based on column 5).
8 In case colonial times shaped both language and aid patterns, there could also be a direct association between
pronoun drop and aid allocation. However, as mentioned above, we do control for colonial relationships and also include donor dummies. Colonial relationships should therefore not violate our identifying assumption.
9 Due to different data availability of the governance measures, the sample size varies over columns 1-5. When
re-estimating columns 1-4 based on the common sample of column 5, the point estimates from the separate specifications resemble those of the joint specification of column 5 (results are available upon request).
Regarding the control variables, there is evidence that donors deliver a higher share of aid through state channels in richer and more populous recipient countries. As argued above, these countries are likely to be economically more important to donors. Besides, the share of state-to-state aid is robustly related to the number of deaths from natural disasters, with the expected negative sign. Other factors such as trade links and closeness between donors and recipients do not appear to affect the choice of aid channels.
Effect heterogeneity
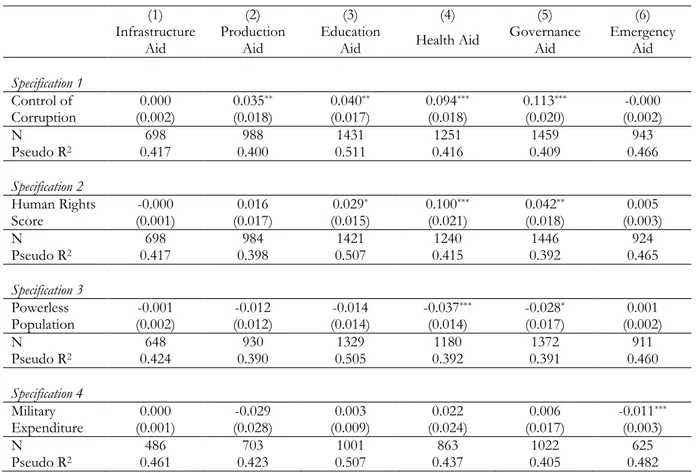
To further substantiate our main finding, we now investigate whether there is heterogeneity in the relationship between institutional quality and the channel of aid delivery that is consistent with donors bypassing weak state institutions. As argued above, bypassing should be more prevalent in sectors that exhibit a high substitutability between state and non-state actors. Table 3 therefore uses the single specification for each of the four governance measures as reported in Table 2, but replaces the overall share of state-to-state aid with sector-specific shares of state-to-state aid (see Table A1 for definitions of the sectors). Indeed, the marginal effects of the respective governance indicators vary considerably across sectors. Institutional quality is of no importance at all when aid is given for infrastructure projects (the point estimates are virtually zero; column 1) and of little importance for aid projects related to improving production activities (column 2) or education (column 3). By contrast, institutional quality seems to matter much more for aid committed in the health (column 4) or governance sector (column 5) where non-state actors are relatively more prevalent. These findings are in line with our argument that we should primarily observe bypassing in sectors in which donors have a real choice of delivery through state or non-state actors.
The remaining aid sector of Table 3 is emergency aid. By definition, emergency aid is typically granted in times when recipient countries require immediate assistance to cope with disasters. Emergency aid can arguably be expected to be driven by the desire to assist as quickly and effectively as possible. Compared to structural aid that follows long-term objectives, considerations of governance should hence be less relevant in case of emergency aid. One illustrative example is the cyclone Nargis that hit both Myanmar and Sri Lanka in 2008. Overall, better governed Sri Lanka received 80% of its aid through state actors, whereas the share for poorly governed Myanmar was only 20%. However, when it came to emergency aid in response to the cyclone, both countries received about the same share of their emergency aid through state actors (26%). Therefore, if donors do not consider good quality of governance as a general justification for aid flows to recipient governments vis-à-vis their electorates, we expect governance to play no role in the share of
emergency aid that is delivered through state channels. Indeed, the marginal effects of all four governance measures are practically zero and mainly insignificant (column 6).10
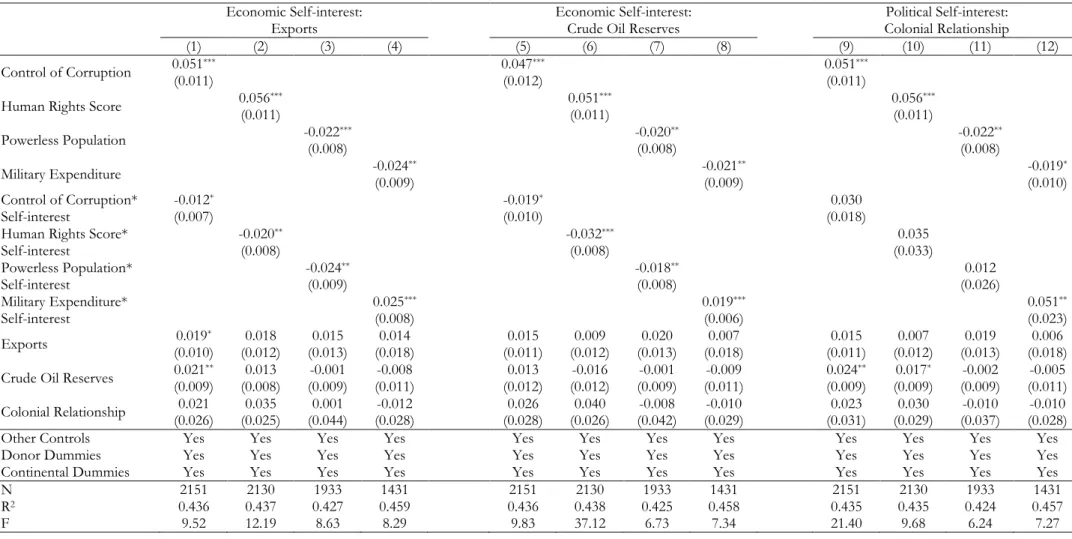
Another way to detect heterogeneity in the relationship between governance and the channel of aid delivery that is suggestive of bypassing is to analyze whether aid flows vary with differences in donor motives. Bypassing should be more common if aid allocation was motivated less by strategic (self-)interests, but more by consideration of recipient need and aid being effective in promoting development. We test the association of variables representing donor motives with the level of bypassing by interacting these variables with our measures of governance. In doing so, we focus on the three proxies of economic and political self-interest included in the aid regression (exports; crude oil reserves; colonial relationship). This is because ‘natural disaster deaths’, the only proper indicator of need in the aid share specification, is strongly correlated with emergency aid, for which we do not find bypassing (see Table 3). As argued above, GDP per capita signals the economic importance of the recipient country rather than need when it comes to explaining aid shares. Our results reported in Table 4 indeed suggest that stronger economic interests in recipient countries (higher exports, columns 1-4; more oil reserves, columns 5-8) are associated with less bypassing of weak governments. The interactions of the share of powerless population with exports and oil reserves, however, go into the opposite direction. A potential explanation is that, ceteris paribus, donors may find it relatively easier to pursue economic self-interests when political power is more concentrated. In this case, they would need to garner support for market access from fewer population groups and may therefore depend relatively less on state-to-state aid. Stronger political self-interests (colonial relationship, columns 9-12) do not appear to be associated with less bypassing, with the exception of military expenditures.
Robustness checks
We perform various checks to assess the robustness of our main results from Table 2. First, we argued above that control of corruption represents a set of other commonly used governance indicators which all capture similar underlying forces. To test whether this is a reasonable assumption, we re-run the regression, employing the other indicators one-by-one as a substitute for control of corruption. The estimated effect of governance on the share of state-to-state aid is statistically significant and goes into the expected direction for all standard indicators (see Table A4 in the appendix). With the exception of Polity IV, the point estimates are also very similar across specifications.
10 There were 656 disasters in 154 countries with a total of 249,137 deaths recorded in 2008. As a consequence, 22
donors delivered emergency aid to 133 recipient countries. A disaster is defined as meeting at least one of the following criteria: (i) ten or more people reported killed, (ii) hundred or more people reported affected, (iii) declaration of a state of emergency, (iv) call for international assistance.
Second, if differences in aid delivery are due to differences in recipients’ need, the observed relationship between governance and aid delivery may be spurious. We offer suggestive evidence for the health and education sector that different needs do not drive our finding. Specifically, we add sector-specific indicators of recipient needs. For the analysis of aid for health, we additionally control for infant mortality rates in 2005. For the analysis of aid for education, we additionally control for rates of primary school completion in 2005. As Table A5 in the appendix shows, our previous results for the health and education sector from Table 3 are robust to including these sector-specific indicators of need.11 12
Third, to address remaining concerns over potential endogeneity, we apply the instrumental variable approach described above. When instrumenting control of corruption with pronoun drop, the baseline results remains: Better control of corruption increases the share of state-to-state aid. The first stage F-statistic does not point to a weak instrument problem (F-statistic 33.60). The marginal effect of the IV estimate (0.235) is larger than the corresponding baseline estimate for the same sample (0.077), indicating a downward bias of the un-instrumented estimates. The direction of the bias is consistent with the notion that the inflow of foreign aid may deteriorate government institutions (e.g., Bräutigam and Knack 2004; Djankov et al. 2008).
Fourth, as governance varies at the level of recipient countries, standard errors could alternatively be clustered at the recipient, not donor country level. As Table A6 in the appendix shows, changing the level of clustering generally does not change the level of significance. The exception is the share of powerless population which becomes marginally insignificant (p=0.199).
Fifth, we exclude recipient countries from the sample if they fall into the lowest or top percentile of the governance measures. This is to test whether our results are driven by recipient countries with extreme values in their governance measures. Restricting the sample leaves our results unaffected (see Table A7 in the appendix). Given that the sample size is more than halved, however, the marginal effect of the human rights score is no longer precisely estimated in the joint specification (column 5).
Sixth, if absolute amounts of aid flows to a given country are small in magnitude, donors may well channel the total amount either through state or through non-state actors to minimize transaction costs. It may hence be the case that our results are merely driven by small aid flows and that the relationship between governance and state-to-state aid is much weaker for larger aid flows. To
11 Likewise our main results from Table 2 are robust to additionally controlling for the number of battle deaths,
infant mortality and primary school completion rates (results are available upon request).
12 In an additional check we also show that our main results from Table 2 are robust to excluding governance aid,
which may be biased towards non-governmental delivery, when computing the share of state-to-state aid (results are available upon request).
address this possibility, we weight observations by the share of aid a recipient country receives from the total amount of aid committed across the globe.13 Using these weights does not affect our results (see Table A8 in the appendix). If anything, the marginal effects become even larger.
Seventh, we investigate whether our results also hold for different years. Specifically, we re-run the analysis for the years 2011 and 2005, i.e. three years after and before 2008, the year on which our main estimates are based. To keep this task manageable, we only use readily coded entries in OECD’s Creditor Reporting System and do not hand-code missing values of the channel of aid delivery. This considerably reduces the sample for 2005. Nevertheless, our main results are robust to using data from 2005 and 2011, with the exception of the share of powerless population in 2005 (see Table A9 in the appendix). This impression holds when we do not use hand-coded observations for 2008 to make point estimates more comparable over the years.14 If anything, the relationship between governance and state-to-state aid is even stronger in 2011 than in 2008.
Overall, the various checks performed above suggest that our results are robust to using different specifications, estimation methods, data or samples.
4.2. Recipient governance and the absolute amount of aid channeled through state and non-state actors
In the previous section, we have shown that donors channel a higher share of aid through non-state actors in recipient countries with weak governance. However, this result does not allow us to assess whether adjustments mainly occur in state-to-state or in state-to-non-state allocations. In addition, bypassing state actors would hardly matter for a recipient country if overall donor engagement in that country were low. Arguably, channeling lower absolute, not relative amounts through state actors (and higher amounts through non-state actors) would provide a clearer indication that bypassing also matters in quantitative terms. In this subsection, we therefore investigate the absolute amounts of aid that are delivered through state and non-state channels.
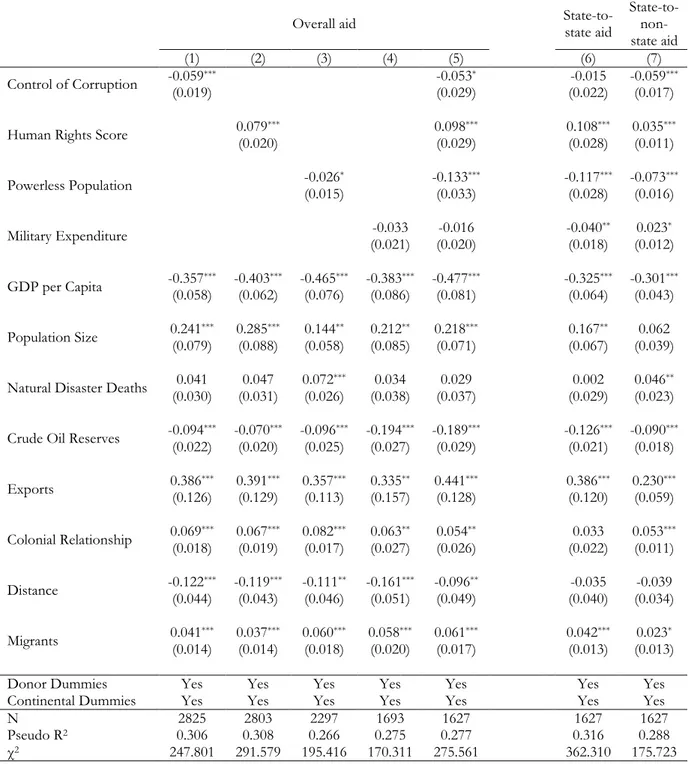
We start by following the general literature on aid allocation and use the logged amount of total aid including both state-to-state and state-to-non-state aid as dependent variable (and the same set of explanatory variables as introduced above). Table 5 reports the results. As before, columns 1-4 show the results of single specifications for each of the four governance measures, and column 5 shows the results of a joint specification. All explanatory variables have the predicted relationship with total
13 In a similar vein, our results are also robust to limiting the sample to countries that do not belong to the bottom
decile in terms of absolute amounts of aid received or population size (results are available upon request).
14 Hence, there is no evidence that aid transactions for which the channel of delivery is readily coded systematically
aid and are consistent with the results of previous studies. Aid flows increase with population size, exports and colonial relationship and decrease with GDP per capita, distance and oil reserves. Our first governance measure, control of corruption, reproduces the finding of Alesina and Weder (2002) that more corrupt countries receive more aid (column 1). However, the other governance measures, in particular the human rights score (column 2) and the share of powerless population (column 3), indicate that recipient governance is taken into account when determining the overall amount of aid, with better governed countries receiving more aid. These results hold in the joint specification. As a next step, to assess whether bypassing also occurs for absolute amounts of aid, we now use absolute amounts of state-to-state and state-to-non-state aid as dependent variables. The specification is the same as above, which allows us to directly compare the results and to assess how allocation through different channels contributes to the overall response of foreign aid to different levels of governance. Columns 6 and 7 of Table 5 show the results for the joint specification for state-to-state and state-to-non-state aid, respectively. The aggregate finding of more aid flowing to more corrupt countries (column 5) appears to reflect an increasing use of non-state channels (column 7), whereas the amount of state-to-state aid is not affected by differences in corruption levels (column 6). There is thus evidence for bypassing corrupt governments even in absolute amounts of aid. The marginal effect is sizeable. A one standard deviation increase in control of corruption is associated with a decrease in the absolute amount of state-to-non-state aid by about 6%. Poor governance as captured by the other three measures is associated with significantly lower amounts of aid being delivered through state actors. Countries with low human rights scores and weak representation of the population also receive less aid through non-state actors, even though the quantitative importance of this effect is markedly smaller. By contrast, in countries with higher military expenditures, more aid is channeled through non-state actors, which again points to bypassing in absolute amounts.
5. Conclusion
We have shown that donor countries use aid delivery channels to discriminate between recipient countries with good and poor levels of governance when allocating foreign aid. In countries with poor levels of governance, donors bypass state institutions and deliver more aid through non-state actors in relative terms and, for the case of corruption and military expenditures, also in absolute terms. This finding qualifies the common verdict of the aid allocation literature that recipient merit is not taken into account. Our estimates corroborate Alesina and Weder’s (2002) finding that more corrupt countries receive higher amounts of total aid, but show that this aid is channeled through non-state rather than state actors. Donors who bypass recipient governments are likely to be driven
by developmental concerns because political and economic self-interests could be pursued much more easily through direct government-to-government contact.
When assessing the different aid channels from a development perspective, it is not donor motives per se that matter but rather how aid can be rendered effective in promoting growth and poverty reduction in recipient countries. Recent research (Dreher and Kilby 2010; Manoiu and Reddy 2010) has provided some evidence supporting the view that aid is most likely to raise growth if it is allocated according to developmental needs. This reasoning might also apply to the particular case of funds channeled through non-state actors. Another strand of the literature stresses the detrimental effects that large amounts of aid inflows are likely to have on institutional quality, for instance by giving rise to rent seeking behavior (Djankov et al. 2008), which would also point to a higher effectiveness of foreign aid allocated through non-government channels.
The case for bypassing recipient governments is reinforced by the poor record of past efforts to use policy conditionality as a means of initiating reforms that are deemed necessary for aid to be effective (Oehler et al. 2012; Svensson 2003). Yet, in the donor community there is a strong opinion (Tavakoli and Smith 2013) that donors should remain engaged with local administrations in order to raise democratic accountability and strengthen administrative capacities. This is expected to be achieved by focusing on local ownership of reforms rather than relying on externally imposed conditions, but conclusive evidence that donors can indeed contribute to institutional improvements in recipient countries with weak governance is so far lacking. Given this insecurity, bypassing appears to be a rational strategy for donors who care for poor people in weakly governed countries.
References
Alesina, A., and D. Dollar (2000). Who Gives Foreign Aid to Whom and Why? Journal of Economic Growth 5(1): 33-63.
Alesina, A., and B. Weder (2002). Do Corrupt Governments Receive Less Foreign Aid? American Economic Review 92(4): 1126-1137.
Berthelemy, J. C. (2006). Bilateral Donor’s Interest versus Recipient’s Development Motives in Aid Allocation: Do All Donors Behave the Same? Review of Development Economics 10: 224-240. Boone, P. (1996). Politics and the Effectiveness of Foreign Aid. European Economic Review 40(2):
289-329.
Bräutigam, D., and S. Knack (2004). Foreign Aid, Institutions and Government in Sub-Saharan Africa. Economic Development and Cultural Change 52: 255-286.
Bueno de Mesquita, B., and A. Smith (2009). A Political Economy of Foreign Aid. International Organization 63(2): 309-340.
Burnside, C., and D. Dollar (2000). Aid, Policies and Growth. American Economic Review 90(4): 847-868.
Cederman, L.-E., B. Min and A. Wimmer (2010). Why Do Ethnic Groups Rebel? New Data and Analysis. World Politics 62(1): 87-119.
Cingranelli, D., and D. Richards (2010). The Cingranelli-Richards (CIRI) Human Rights Dataset. http://www.humanrightsdata.org.
Clist, P. (2011). 25 Years of Aid Allocation Practice: Whither Selectivity? World Development 39(10): 1724-1734.
Department for International Development (DfID) (2011). How We Decide Where Aid is Spent.
http://www.dfid.gov.uk/What-we-do/How-UK-aid-is-spent/.
Dietrich, S. (2013). Bypass or Engage? Explaining Donor Tactics in Aid Allocation. International Studies Quarterly, 57(4): 698-712.
Davis, L. (2012). An Extension of the Kashima and Kashima (1998) Linguistic Dataset. Mimeo, Union College.
Djankov, S., J. Montalvo, and M. Reynal-Querol (2008). The Curse of Aid. Journal of Economic Growth 13(3): 169-194.
Dreher, A., and C. Kilby (2010). The Impact of Aid on Growth Revisited: Do Donor and Recipient Characteristics Make a Difference? Economics Letters 107(3): 338-340.
Dreher, A., P. Nunnenkamp, and R. Thiele (2008). Does US Aid Buy UN General Assembly Votes? A Disaggregated Analysis. Public Choice 136(1/2): 139-164.
Dreher, A., Mölders, F., and P. Nunnenkamp (2010). Aid Delivery through Non-Governmental Organizations: Does the Aid Channel Matter for the Targeting of Swedish Aid? The World Economy 33(2): 147-176.
Easterly, W. (2007). Are Aid Agencies Improving? Economic Policy 22(52): 633-678.
Faye, M., and P. Niehaus (2012). Political Aid Cycles. American Economic Review 102(7): 3516-3530. Heston, A., R. Summers and B. Aten (2012). Penn World Table Version 7.1. Center for International
Comparisons of Production, Income and Prices at the University of Pennsylvania.
Hodler, R, and P. Raschky (2014). Regional Favoritism. Quarterly Journal of Economics 129(2):995-1033.
Hoeffler, A., and V. Outram (2011). Need, Merit, or Self-Interest: What Determines the Allocation of Aid. Review of Development Economics 15(2): 237-250.
Hout, W. (2007). The Politics of Aid Selectivity: Good Governance Criteria in World Bank, Dutch and US Development Assistance. Routledge.
Personal Pronoun Use. Journal of Cross-Cultural Psychology 29(3): 461-486.
Kaufmann, D., A. Kraay and M. Mastruzzi (2009). Governance Matters VIII –Aggregate and Individual Governance Indicators 1996–2008. World Bank Policy Research Working Paper 4978.
Knack, S. (2013). Aid and Donor Trust in Recipient Country Systems. Journal of Development Economics 101: 316-329.
Kuziemko, I., and E.D. Werker (2006). How Much Is a Seat on the Security Council Worth? Foreign Aid and Bribery at the United Nations. Journal of Political Economy 114(5): 905-930.
Licht, A.N., C. Goldschmidt and S.H. Schwartz (2007). Culture Rules: The Foundations of the Rule of Law and other Norms of Governance. Journal of Comparative Economics 35(4): 659-688.
Manoiu, C., and S. Reddy (2010). Development Aid and Economic Growth: A Positive Long-Run Relation. Quarterly Review of Economics and Finance 50(1): 27-39.
Mayer and Zignago (2011). Notes on CEPII’s Distances Measures (GeoDist). CEPII Working Paper 2011-25.
Neumayer, E. (2003). The Pattern of Giving Aid: The Impact of Good governance on Development Assistance. Routledge, London and New York.
Nunnenkamp, P., and H. Öhler (2011). Aid Allocation through Various Official and Private Channels: Need, Merit and Self-Interest as Motives of German Donors. World Development 39(3): 308-323. Nunnenkamp, P., and R. Thiele (2013). Financing for Development: The Gap between Words and
Deeds since Monterrey. Development Policy Review 31(1): 75-98.
Oehler, H., Nunnenkamp, P., and A. Dreher (2012). Does Conditionality Work? A Test for an Innovative US Aid Scheme. European Economic Review 56(1): 138-153.
Papke, L.E., and J.M. Wooldridge (1996). Econometric Methods for Fractional Response Variables with an Application to 401(k) Plan Participation Rates. Journal of Applied Econometrics, 11(6): 619-632.
Roodman, D. (2007). The Anarchy of Numbers: Aid, Development, and Cross-Country Empirics. World Bank Economic Review 21(2): 255-277.
Santos Silva, J. M. C., and S. Tenreyro (2006). The Log of Gravity. Review of Economics and Statistics 88(4): 641-658.
Santos Silva, J. M. C., and S. Tenreyro (2011). Further Simulation Evidence on the Performance of the Poisson Pseudo-Maximum Likelihood Estimator. Economics Letters 112(2): 220-222.
Spolaore, E., and R. Wacziarg (2013). How Deep are the Roots of Economic Development? Journal of Economic Literature 51(2): 325-369.
Svensson, J. (2003). Why Conditional Aid Does Not Work and What Can Be Done About It. Journal of Development Economics 70(2): 381-402.
Tabellini, G. (2008). Institutions and Culture. Journal of the European Economic Association 6(2-3): 255-294.
Tavakoli, H., and G. Smith (2013). Back under the Microscope: Insights from Evidence on Budget Support. Development Policy Review 31(1): 59-74.
Werker, E., and F. Ahmed (2008). What Do Nongovernmental Organizations Do? Journal of Economic Perspectives 22(2): 73-92.
World Bank (1998). Assessing Aid: What Works, What Doesn’t, and Why. Oxford: Oxford University Press.
Figures and Tables
Figure 1: Share of state-to-state aid in 2008, overall and by donors
Table 1: Correlation matrix of governance indicators Control of
Corruption Human Rights Score Population Powerless Expenditure Military Control of Corruption 1
Human Rights Score 0.279 1
Powerless Population -0.243 -0.063 1
Table 2: Governance and the share of state-to-state aid
(1) (2) (3) (4) (5)
Control of Corruption 0.074(0.015) *** 0.043(0.017) **
Human Rights Score 0.078(0.013) *** (0.021) 0.035*
Powerless Population -0.030(0.011) *** -0.021(0.011) **
Military Expenditure -0.026(0.013) ** -0.028(0.015) *
GDP per Capita 0.038(0.019) ** 0.078(0.021) *** 0.087(0.024) *** 0.096(0.026) *** (0.026) 0.027 Population Size (0.023) 0.013 0.068(0.024) *** (0.023) 0.056** (0.026) 0.043 0.062(0.026) ** Natural Disaster Deaths -0.058(0.018) *** -0.067(0.018) *** -0.061(0.016) *** -0.044(0.023) * -0.043(0.024) * Crude Oil Reserves 0.034(0.012) *** 0.025(0.011) ** (0.013) -0.003 (0.015) -0.007 (0.018) 0.016 Exports (0.017) 0.026 (0.017) 0.014 (0.019) 0.030 (0.028) 0.012 (0.028) 0.022 Colonial Relationship (0.009) 0.009 (0.009) 0.014* (0.011) -0.003 (0.007) -0.006 (0.007) -0.008 Distance (0.020) -0.024 (0.019) -0.023 (0.020) -0.018 (0.026) -0.032 (0.028) -0.030 Migrants (0.012) 0.002 (0.013) 0.008 (0.012) 0.002 (0.016) 0.012 (0.015) 0.008
Donor Dummies Yes Yes Yes Yes Yes
Continental Dummies Yes Yes Yes Yes Yes
N 2151 2130 1933 1431 1394
Pseudo R2 0.438 0.439 0.426 0.459 0.474
χ2 98.618 120.578 65.882 85.017 101.625
The table reports marginal effects for a one standard deviation increase in the independent variables from fractional logit estimates. The dependent variable is the share of state-to-state aid. Standard errors clustered at the donor country level in parentheses. *** denotes statistical significance at the 1 percent level, ** at the 5 percent level, and * at the 10 percent level.
Table 3: Governance and the share of state-to-state aid across sectors
(1) (2) (3) (4) (5) (6)
Infrastructure
Aid Production Aid Education Aid Health Aid Governance Aid Emergency Aid
Specification 1 Control of Corruption (0.002) 0.000 0.035 ** (0.018) 0.040 ** (0.017) 0.094 *** (0.018) 0.113 *** (0.020) (0.002) -0.000 N 698 988 1431 1251 1459 943 Pseudo R2 0.417 0.400 0.511 0.416 0.409 0.466 Specification 2 Human Rights Score (0.001) -0.000 (0.017) 0.016 0.029 * (0.015) 0.100 *** (0.021) 0.042 ** (0.018) (0.003) 0.005 N 698 984 1421 1240 1446 924 Pseudo R2 0.417 0.398 0.507 0.415 0.392 0.465 Specification 3 Powerless Population (0.002) -0.001 (0.012) -0.012 (0.014) -0.014 -0.037 *** (0.014) -0.028 * (0.017) (0.002) 0.001 N 648 930 1329 1180 1372 911 Pseudo R2 0.424 0.390 0.505 0.392 0.391 0.460 Specification 4 Military Expenditure (0.001) 0.000 (0.028) -0.029 (0.009) 0.003 (0.024) 0.022 (0.017) 0.006 -0.011 *** (0.003) N 486 703 1001 863 1022 625 Pseudo R2 0.461 0.423 0.507 0.437 0.405 0.482
The table reports marginal effects for a one standard deviation increase in the independent variables from fractional logit estimates. The dependent variable is the share of state-to-state aid in each sector. All regressions include the full set of control variables, donor dummies and continental dummies. The different sample sizes are explained by the fact that the sector-specific share of state-to-state aid for a given donor-recipient country pair is only defined for non-zero volumes of aid and many donors are only active in a subset of the sectors under consideration. Standard errors clustered at the donor country level in parentheses. *** denotes statistical significance at the 1 percent level, ** at the 5 percent level, and * at the 10 percent level.
Table 4: Governance interacted with donors’ self-interest and the share of state-to-state aid Economic Self-interest:
Exports Economic Self-interest: Crude Oil Reserves Colonial Relationship Political Self-interest:
(1) (2) (3) (4) (5) (6) (7) (8) (9) (10) (11) (12)
Control of Corruption 0.051(0.011) *** 0.047(0.012) *** 0.051(0.011) ***
Human Rights Score 0.056(0.011) *** 0.051(0.011) *** 0.056(0.011) ***
Powerless Population -0.022(0.008) *** -0.020(0.008) ** -0.022(0.008) ** Military Expenditure -0.024(0.009) ** -0.021(0.009) ** -0.019(0.010) * Control of Corruption* Self-interest -0.012 * (0.007) -0.019 * (0.010) (0.018) 0.030
Human Rights Score*
Self-interest -0.020 ** (0.008) -0.032 *** (0.008) (0.033) 0.035 Powerless Population* Self-interest -0.024 ** (0.009) -0.018 ** (0.008) (0.026) 0.012 Military Expenditure* Self-interest 0.025 *** (0.008) 0.019 *** (0.006) 0.051 ** (0.023) Exports (0.010) 0.019* (0.012) 0.018 (0.013) 0.015 (0.018) 0.014 (0.011) 0.015 (0.012) 0.009 (0.013) 0.020 (0.018) 0.007 (0.011) 0.015 (0.012) 0.007 (0.013) 0.019 (0.018) 0.006 Crude Oil Reserves (0.009) 0.021** (0.008) 0.013 (0.009) -0.001 (0.011) -0.008 (0.012) 0.013 (0.012) -0.016 (0.009) -0.001 (0.011) -0.009 0.024(0.009) ** (0.009) 0.017* (0.009) -0.002 (0.011) -0.005 Colonial Relationship (0.026) 0.021 (0.025) 0.035 (0.044) 0.001 (0.028) -0.012 (0.028) 0.026 (0.026) 0.040 (0.042) -0.008 (0.029) -0.010 (0.031) 0.023 (0.029) 0.030 (0.037) -0.010 (0.028) -0.010
Other Controls Yes Yes Yes Yes Yes Yes Yes Yes Yes Yes Yes Yes
Donor Dummies Yes Yes Yes Yes Yes Yes Yes Yes Yes Yes Yes Yes
Continental Dummies Yes Yes Yes Yes Yes Yes Yes Yes Yes Yes Yes Yes
N 2151 2130 1933 1431 2151 2130 1933 1431 2151 2130 1933 1431
R2 0.436 0.437 0.427 0.459 0.436 0.438 0.425 0.458 0.435 0.435 0.424 0.457
F 9.52 12.19 8.63 8.29 9.83 37.12 6.73 7.34 21.40 9.68 6.24 7.27
The table reports marginal effects for a one standard deviation increase in the independent variables from OLS estimates. The dependent variable is the share of state-to-state aid. The interaction variables interact the respective governance indicator with the proxy of self-interest indicated in the column title. The proxy for self-interest is exports of the donor to the recipient country in columns 1-4, crude oil reserves of the recipient country in columns 5-8, and a former colonial relationship between the donor and recipient country in columns 9-12. Standard errors clustered at the donor country level in parentheses. *** denotes statistical significance at the 1 percent level, ** at the 5 percent level, and * at the 10 percent level.
Table 5: Determinants of absolute amounts of overall aid (including both state and state-to-non-state aid), state-to-state aid and state-to-state-to-non-state aid
Overall aid State-to-state aid State-to- non-state aid
(1) (2) (3) (4) (5) (6) (7)
Control of Corruption -0.059(0.019) *** -0.053(0.029) * (0.022) -0.015 -0.059(0.017) *** Human Rights Score 0.079(0.020) *** 0.098(0.029) *** 0.108(0.028) *** 0.035(0.011) *** Powerless Population -0.026(0.015) * -0.133(0.033) *** -0.117(0.028) *** -0.073(0.016) *** Military Expenditure (0.021) -0.033 (0.020) -0.016 -0.040(0.018) ** (0.012) 0.023* GDP per Capita -0.357(0.058) *** -0.403(0.062) *** -0.465(0.076) *** -0.383(0.086) *** -0.477(0.081) *** -0.325(0.064) *** -0.301(0.043) *** Population Size 0.241(0.079) *** 0.285(0.088) *** (0.058) 0.144** (0.085) 0.212** 0.218(0.071) *** 0.167(0.067) ** (0.039) 0.062 Natural Disaster Deaths (0.030) 0.041 (0.031) 0.047 0.072(0.026) *** (0.038) 0.034 (0.037) 0.029 (0.029) 0.002 0.046(0.023) ** Crude Oil Reserves -0.094(0.022) *** -0.070(0.020) *** -0.096(0.025) *** -0.194(0.027) *** -0.189(0.029) *** -0.126(0.021) *** -0.090(0.018) *** Exports 0.386(0.126) *** 0.391(0.129) *** 0.357(0.113) *** (0.157) 0.335** 0.441(0.128) *** 0.386(0.120) *** 0.230(0.059) *** Colonial Relationship 0.069(0.018) *** 0.067(0.019) *** 0.082(0.017) *** (0.027) 0.063** 0.054(0.026) ** (0.022) 0.033 0.053(0.011) *** Distance -0.122(0.044) *** -0.119(0.043) *** -0.111(0.046) ** -0.161(0.051) *** -0.096(0.049) ** (0.040) -0.035 (0.034) -0.039 Migrants 0.041(0.014) *** 0.037(0.014) *** 0.060(0.018) *** 0.058(0.020) *** 0.061(0.017) *** 0.042(0.013) *** (0.013) 0.023*
Donor Dummies Yes Yes Yes Yes Yes Yes Yes
Continental Dummies Yes Yes Yes Yes Yes Yes Yes
N 2825 2803 2297 1693 1627 1627 1627
Pseudo R2 0.306 0.308 0.266 0.275 0.277 0.316 0.288
χ2 247.801 291.579 195.416 170.311 275.561 362.310 175.723
The table reports marginal effects for a one standard deviation increase in the independent variables from poisson pseudo maximum likelihood estimates. The dependent variable is the logged absolute amount of overall aid (including both state-to-state and state-to-non-state aid) in columns 1-5, the logged absolute amount of state-to-state aid in column 6 and the logged absolute amount of state-to-non-state aid in column 7. Standard errors clustered at the donor country level in parentheses. *** denotes statistical significance at the 1 percent level, ** at the 5 percent level, and * at the 10 percent level.
Appendix
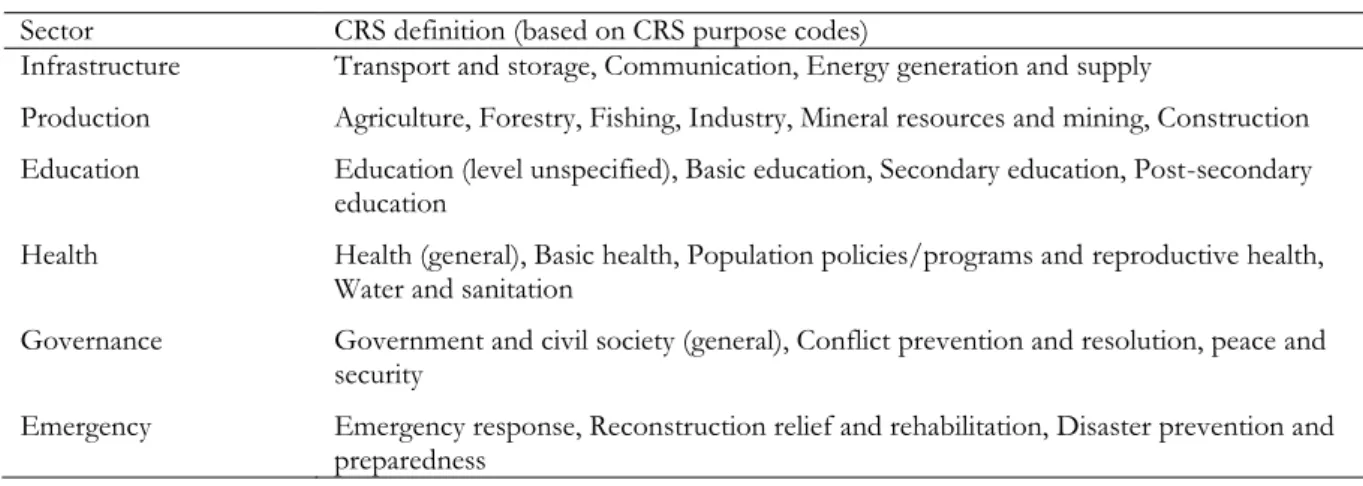
Table A1: Definition of aid sectors based on the classifications of the Creditor Reporting System Sector CRS definition (based on CRS purpose codes)
Infrastructure Transport and storage, Communication, Energy generation and supply
Production Agriculture, Forestry, Fishing, Industry, Mineral resources and mining, Construction Education Education (level unspecified), Basic education, Secondary education, Post-secondary
education
Health Health (general), Basic health, Population policies/programs and reproductive health, Water and sanitation
Governance Government and civil society (general), Conflict prevention and resolution, peace and security
Emergency Emergency response, Reconstruction relief and rehabilitation, Disaster prevention and preparedness
Table A2: Description of variables
Variable name Description Data source
Share of State-to-state Aid Aid that was channeled through the public sector of a recipient country as share of total aid that a given donor committed to a recipient country in 2008
OECD’s Creditor Reporting System
State-to-state Aid Absolute amount of aid that was channeled through the public sector of a recipient country by a given donor in 2008 (in million USD, logged)
OECD’s Creditor Reporting System
State-to-non-state Aid Absolute amount of aid that was channeled through NGOs, multi-lateral organizations or other non-state development actors by a given donor in 2008 (in million USD, logged)
OECD’s Creditor Reporting System
Control of Corruption Perceptions of the extent to which public power was exercised for private gain, including both petty and grand forms of corruption, as well as “capture” of the state by elites and private interests in the recipient country in 2005
World Bank’s Worldwide
Governance Indicators (Kaufmann et al., 2009)
Human Rights Score (Physical
Integrity Index) Respect for internationally recognized human rights as measured by the incidences of torture, extrajudicial killings, political imprisonment and politically motivated disappearances in the recipient country in 2005
Cingranelli-Richards Human Rights dataset (Cingranelli and Richards 2010)
Powerless Population Share of the population who belonged to an ethnic group whose representatives held no political power at the national or regional level in the recipient country in 2005
Ethnic Power Relations dataset (Cederman et al. 2010)
expenditures that was spent on the military in the recipient country, averaged over 2000-2008 (in %)
Indicators
GDP per Capita Gross domestic product per capita in PPP of the recipient country in 2005 (logged)
Penn World Tables (Heston et al. 2012)
Population Size Population of the recipient country
in 2005 (in 1000, logged) Penn World Tables Natural Disaster Deaths Number of deaths due to natural
disasters in the recipient country, aggregated over 2000-2008 (logged)
EM-DAT: The OFDA/CRED International Disaster Database Crude Oil Reserves Crude oil proven reserves in the
recipient country in 2005 (in billion barrels, logged)
U.S. Energy Information Administration
Exports Value of exports from a donor to a recipient country in 2005 (in USD, logged)
IMF Direction of Trade Statistics
Colonial Relationship Dummy for colonial relationship between a donor and a recipient country after 1945
CEPII GeoDist Database (Mayer and Zignago 2011)
Distance Geodesic distance between a donor and a recipient country (great circle formula, logged)
CEPII GeoDist Database
Migrants Number of migrants from the
recipient country as share of donor country’s total population in 2000
Global Migrant Origin Database of the Development Research Centre on Migration, Globalization and Poverty,
Penn World Tables
Table A3: Summary statistics
Mean Std. Dev. Min. Max. Obs.
Share of State-to-state Aid 0.541 0.405 0 1 2352
Overall Aid (logged) 1.462 1.773 0 8.365 3322
State-to-state Aid (logged) 1.016 1.563 0 8.137 3322
State-to-non-state Aid (logged) 0.83 1.233 0 6.751 3322
Control of Corruption -0.473 0.686 -1.680 1.461 3146
Human Rights Score 4.543 2.186 0 8 3080
Powerless Population 0.095 0.197 0 0.85 2442
Military Expenditure (in %) 10.001 6.445 1.589 42.806 1716
GDP per Capita (logged) 8.061 1.063 5.335 10.26 3036
Population Size (logged) 8.584 2.106 3.012 14.076 3036
Natural Disaster Deaths (logged) 5.371 2.884 0 12.113 3322
Crude Oil Reserves (logged) 0.460 0.985 0 4.843 3036
Exports (logged) 15.542 4.182 0 25.106 3118
Colonial Relationship 0.03 0.171 0 1 3300
Distance (logged) 8.841 0.623 5.601 9.85 3300