Science Arts & Métiers (SAM)
is an open access repository that collects the work of Arts et Métiers Institute of
Technology researchers and makes it freely available over the web where possible.
This is an author-deposited version published in: https://sam.ensam.eu Handle ID: .http://hdl.handle.net/10985/20057
To cite this version :
Mohamad EL YOUSSEF, Adrien VAN GORP, Stephane CLENET, Abdelkader BENABOU, Pierre FAVEROLLE, JeanClaude MIPO, Yannick LAVALLEY, Christiane COUR, Thomas LECUPPE -Slinky stator : The impact of manufacturing process on the magnetic properties - In: 2017 IEEE International Electric Machines and Drives Conference (IEMDC), Etats-Unis, 2017-05-21 - 2017 IEEE International Electric Machines and Drives Conference (IEMDC) - 2017
Any correspondence concerning this service should be sent to the repository Administrator : archiveouverte@ensam.eu
Slinky Stator: The impact of manufacturing process
on the magnetic properties.
Mohamad EL YOUSSEF
12, Adrien VAN GORP
2, Stéphane CLENET
1, Abdelkader BENABOU
1,
Pierre FAVEROLLE
3, Jean-Claude MIPO
3, Yannick LAVALLEY
4, Christiane COUR
4, Thomas LECUPPE
41Univ. Lille, Centrale Lille, Arts et Metiers ParisTech, HEI, HeSam, EA 2697 - L2EP – Laboratoire d’Electrotechnique et d’Electronique de Puissance, F-59000 Lille, France
2Arts & Metiers ParisTech; Mechanics, Surfaces and Materials Processing (MSMP); 8, boulevard Louis XIV 59046 Lille, France
3Valeo-2 Rue André Charles Boulle, 94000 Créteil, France 4R.Bourgeois-25, Rue de Trépillot BP 1077 25002 Besançon, France
Abstract—The manufacturing of a slinky stator core is the result of a sequence of difference processes: straightening, punching, rolling….. It has been shown in the literature that manufacturing processes lead to a degradation of the magnetic properties. However, it is really difficult from the state of art to classify them a priori from the most influent to the less. In order to determine the most influent processes, it is necessary the evaluate quantitatively the impact of impact of each process. In this paper, a campaign of magnetic characterization is carried out on FeSi 1.3% specimens extracted after each process on the manufacturing line of a slinky stator. Samples have different shapes, so different characterization methods were used to determine the normal curves and total losses. Results show that the dispersion in raw material is quite important and depends on the level of induction. Straightening and training processes deteriorate the magnetic material properties and dispersion after both processes is higher than the raw material one. The effect of rolling and cutting are the most harmful compared to the other manufacturing processes, while the compacting process shows a benefic effect.
Keywords—slinky stator, iron losses, manufacturing process, electrical steel, magnetic measurements.
I. INTRODUCTION A. Context
Energy efficiency and performances of electrical components are important aspects in embedded systems, especially in automotive. The claw pole generator employed for the on-board electrical energy production is one of critical components. The efficiency and performances are directly linked to the magnetic material properties, which are degraded during the process of fabrication of the stator and the rotor. The stator of this electrical machine is manufactured using the slinky process instead of the conventional one which consists in stacking laminations. In fact, the slinky process enables in the case of a claw pole machine to save raw materials (85% to 35%) [1]. The process consists in rolling up a single band of punched lamination in a spiral way to form the stator shape. The manufacturing process leads to material structure modification and involves mechanical and thermal stresses according to the process, which generally deteriorates the
magnetic properties. According to Lim et al. the slinky stator is less efficient than the conventional one [2]. In addition, Ramarotafika [3] found a large dispersion in the slinky stator performances, coming from the same processes line. In the following, we will give a brief state of art about the effect of some manufacturing processes on the Fe-Si laminations characteristics. These processes are involved in the slinky processes line.
B. Review of Manufacturing Mrocesses and Influence on the Magnetic Performances
1) The cutting techniques
Punching and laser cuttings are the two widespread methods in stator lamination cutting. Punching is suitable for big series due to its speed whereas laser cutting is preferred for prototypes and special machines. Reported studies show that magnetic properties are sensitive to the cutting method. A comparison between different cutting techniques can be found in [4]. It shows that, at 60Hz and 1.5 T, the variations, due to the cutting method, of the losses and the permeability can be up to 10% and 20% respectively.
In the slinky case, punching is the suitable cutting method. It is made by a forceful shearing with a precisely shaped die. Several studies treat deeply the impact of punching process on the mechanical properties. Ben Ismail [6] has established a correlation between the plastic strain, and its magnetic properties degradation (falls of permeability) in the vicinity of the cut edge using experimental analysis combined with numerical simulation. Moreover Ramde [7] gives a calculation methodology in order to optimize the quality of the cut edge and loads of tools. Also in [8], Hambli presents an algorithm to predict the geometry of the sheared profile, the mechanical state of the sheared zone, the burr height, the force penetration curve and the wear evolution of the punch versus the number of the blanking cycles. Experimentally, Jana [9] analyses the effects of varying the punch-die clearance and the hardness of the specimen on the surface finish and quality of blanked specimens corresponding to different metals. While Kuo et al.[10] investigates the degradation due to the punching process using three needle probes arranged in a special way to
pick up the flux around the area of the cutting edge and the flux of the unaffected center area, respectively.
Four parameters are taken into account: the clearance, the cutting speed, the tool geometry and clamping existence. In [11], Maillard shows that the cutting edge is defined with four zones: the height of the imprint, the sheared height, the snatched one and the burr height. Other works treat the impacted distance from the cut edge by punching. The distance is estimated relying on several methods, mechanically by measuring the hardness on the surface [12] magnetically by using the needle probe method [13] or basing on the grain size detection with microscopy [14].
2) Welding
Laser welding is the most used method thanks to its speed and quality in series welding. The welding quality depends on different parameters, such as the power, the number of welded lines, the diameter of the spot and the penetration depth. As in the cutting case, most of the studies don’t take into account the influence of the parameters. Schoppa et al. [15] investigates the impact of welding by changing the number of welding lines on a 20 stacked 0.5 mm laminations. Results show that the magnetic properties degradation is mainly observed between 0.4T and 1.4T. The welding process induces thermal stresses and structure modification in the welded zone which leads to small strains. In [16], Markovits analyses the effect of different parameters on the welded seam
geometry. He shows that the smaller are the depth and the
width of seam, the less is the magnetic loss.
3) Compacting
In literature, studies mention that the effect of compaction has been always harmful. Arshad et al. [17] shows that pressing damages the insulation which causes more eddy current losses. It may also cause a deterioration of the material and hence higher hysteresis losses. In [18], Clerc et al. mentions a 20% decrease of the magnetic permeability in regions of moderate induction (0,7-1,2 T) at a compression of 8 MPa and negligible effects at low (< 0,5 T) and high (> 1,5 T) induction levels.
4) Annealing:
In metallurgy, the annealing process is a heat treatment. It alters the physical and sometimes chemical properties of the material to increase its ductility and reduce its hardness. It consists in heating a material above its recrystallization temperature, maintaining a suitable temperature, and then cooling. This process is also used to eliminate the residual stresses. Bertoldi et al. [19], indicates that the annealing process allows recovering some of the lost magnetic quality during the above-mentioned manufacturing processes. It shows that the magnetic properties depend on the annealing temperature and a reduction up to 40% on the total losses can be reached. Despite its benefits, the annealing is prohibited on the stator due to the coated insulation that could be damaged under the effect of the high temperature.
C. Purpose
In order to improve the slinky stator performances, the degradation of magnetic properties during manufacturing process should be determined. However, in the literature, the impacts of the different cutting, shaping and assembling processes are treated separately. No study exists in which all processes are examined and compared in terms of impact within a given manufacturing process line. It is almost impossible to quantify from the state of state the effect on the magnetic properties of each process of the manufacturing line. This study has to be done directly on the manufacturing by extracting and characterizing samples after each process. In this paper, the whole process of slinky stators manufacturing is investigated. A methodology is proposed to quantify the process degradations on the magnetic properties (B(H) curves and total losses) in order to find the most harmful process. First, the whole process of the slinky stator manufacturing is preliminarily described. Then magnetic measurements, carried out on different specimens extracted after each step of the process, are analyzed. Finally, the results are discussed and compared qualitatively to the one of the state of art.
II. SLINKY PROCESS DESCRIPTION
The description of conventional electric stator manufacturing can be found in [1]; a stator is formed from laminated steel sheets. The raw material is presented as a huge roll called mother coil (MC). The sheet is unrolled, flattened and then punched. A group of punched sheets is stacked then compressed to eliminate the air gap between the sheets and finally welded to maintain the package. As the conventional stators, the slinky process includes almost the same processes (Fig.1). The main difference locates between the cutting and the welding processes.
A. Raw Material
The Manufacturer receives the material as a coil rolled sheet (MC). The MC is put on a wheel to be charged continuously in the process line.
B. Straightening and Training
The aim of the straightening is to flatten the rolled sheet and prepare it to be punched properly. The sheet crosses a group of rotating cylinders (rollers). After straightening, the flat sheet passes between two cylinders in order to drag the sheet along all the next processes. In these two processes the applied forces on the sheet can lead to a plastic deformation and consequently an increase in the hardness and the work hardening rate.
C. Punching
After training, the flattened sheet is punched and teeth are formed. At the end of this process, four toothed strips are formed. As the geometry of the cutting tool impacts on the cut edge state, the tool is regularly sharpened.
D. Rolling
After cutting, the sheet is rolled (Fig.2); it is forced to pass a circular arc path then rotates around a cylinder to form a helical shape. This process involves plastic deformation in the sheet. No study shows the impact of rolling on the magnetic properties, but Lunge [20] gives the distribution of the stress along the width of the rolled sheet. Consequently, by modifying the mechanical properties, this process has also an impact on the magnetic characteristics but it hasn’t been quantified yet.
E. Welding & Compacting
The helix called slinky is pressed and well-adjusted in such a way that the teeth of each turn are stacked on the teeth of the previous turn. Then the slinky core is welded on its outer periphery along the axial direction in order to maintain the stator package. The welded package is finally compacted to fulfill the dimension specifications of the package.
III. SPECIMENS &CHARAcTERIZATION
The slinky stator is obtained from several processes that have an impact on the magnetic properties. However, the relative impact of each process is not obvious to determine from the state of art where the parameters of the process under study (speed, temperature, composition of the material…) are not necessarily given. To be further able to propose a strategy for reducing the deterioration of magnetic properties, an experimental investigation of each fabrication steps is required. Once the impact of each fabrication step has been quantified on the magnetic material characteristics, the most impacting processes can be determined in order to be improved. To reach the goal, different samples are extracted after each process on the manufacturing line. They have different shapes: non-punched sheets, punched sheets and packages (Fig.1).
The non-punched sheets were characterized with a standard method, the Single Sheet Tester (SST). For the punched sheets, which have a complex shape, standard magnetic characterization techniques are not adapted. Therefore, the samples were extracted from the punched sheet taking care that the method of cutting has almost no impact on the magnetic characteristics. The lamination packages are wound and characterized as a torus sample.
A. Non-punched Sheet
To characterize the raw material and the non-punched laminations after straightening and training, samples with dimensions of 50mmx200mm well fitted for the SST, were cut. All samples were cut with water jet to avoid any stresses (mechanical or thermal) around the edge zone. Moreover, to prevent oxidation of the cut edge after cutting, samples were drowned in the ethanol then dried.
B. Punched Sheet
In order to show the impact of punching, samples with the same dimensions should be extracted after the training process with a less impacting technique that can be considered as reference. In our case, the sample shapes are complex and
their dimensions are in the order of the mm. Consequently, the water jet method was rejected. The electrical discharge machining (EDM) technique was preferred to limit the impact of the cutting. Samples were cut with a finishing step. It is done with low power (low spark) to avoid heating. In order to eliminate the heated region resulting from the first step.
Fig. 1. Received specimens after each manufacturing process
Fig. 2. Rolling process.
In Fig.3, the shape of the different samples is given. The edge color in this figure represents the cutting method; black represents the EDM and red represents the punching.
The considered samples do not present a regular geometry, and therefore the section is not constant. The evaluation of magnetic flux density B and magnetic field H is not possible in this case because their distribution is not homogenous along the flux path in the sample. Therefore, the results will be presented in term of the magnetic flux flowing the sample which is conservative versus the magnetomotive force (MMF) deduced from the current in the primary coil (N*I). A comparison between these two types of samples, presented in Fig.3, can give us an estimation of the punching process’s impact on the edge parallel to the flux density flow. Primary
and secondary coils are manually wound around the teeth to create the MMF and measure the flux respectively.
C. Slinky Packages.
The extracted samples after rolling, welding and compacting (see Fig.1) are made from an helical strip. These packages have the same weight, being extracted at different steps of the process, but they do not present exactly the same shape and height. In Fig.4, the different samples are presented. In the case of samples before welding, the shape presents a wavy surface that was adjusted with stems and maintained with plastic ribbons (Fig.4a). The welded packages have almost the same height as the previous ones, but with a flat surface (Fig.4b,4c). In fact after rolling, samples are adjusted and pressed lightly in such a way to have a flat surface. After welding the package is compacted, so the air gap between sheets is eliminated, which means that the height of the compacted stator (Fig.4d) is smaller than the welded one (Fig.4c). According to the package shape and the process types, the impacted region is located on stator yoke, teeth are not exposed to any mecanical or thermal stresses.
Rolling involes plastic and elastic strain in the yoke part whereas the welding induces thermal stress. To characterize the impact of the processes (rolling, welding, compacting) on the yoke, this one is wound like a torus (Fig. 5).
Fig. 3. Samples cut, by EDM (a), by punching (b)
Fig. 4. Samples after rolling (a & b), Welding (c) and Compacting (d)
Fig. 5. Stator yoke supposed equivalent to a torus core
The creating flux flows mainly through the yoke which has almost a constant section. It is then possible to determine an average B(H) curve and also the losses.
IV. RESULTS
The principle of magnetic characteristic measurements consists in creating a varying magnetic flux by means of a current I passing through a primary coil placed on the ferromagnetic core. The magnetic flux is determined by integrating the voltage measured at the terminals of a secondary coil. In the following, the results and comparisons are presented in terms of the normal curve and total losses except for punched sheet. The normal curve gives the coordinates (Hmax,Bmax) of the tip of the hysteresis loop in function of the maximum magnetic field Hmax.
Preliminary measurements were carried out in order to show the dispersion of magnetic properties on the raw material provided by the mother coil (MC). The samples are extracted for different locations (beginning, middle, and end) of the MC; for each location, 8 samples are characterized. The results of these characterizations are given in Table 1 with the mean and the standard deviation (STD) and the confidence level (CL=2*STD/mean ) associated to the magnetic field required to reach a specific magnetic flux density value in the material for a frequency of 50 Hz. In addition, Table 2 shows the evolution, versus the frequency, of the mean, the STD and CL of total losses for an induction of 1T.
Table. 1 Mean, Standard Deviation (STD) and Confidence Level (CL and CL0) of the magnetic field in function of the magnetic flux density at 50 Hz.
Magnetic field (A/m) Flux density 0 (T) 0,1 (T) 0,25 (T) 0,5(T) 0,75 (T) mean 0 24.41 32.46 41.40 48.62 STD 0 4.65 3.13 2.94 3.01 CL - 0.38 0.20 0.14 0.12 CL0 - 0.076 0.039 0.012 0.011 Flux density 1 (T) 1,25(T) 1,5(T) 1,75 (T) 1,8 (T) mean 59.27 97.20 370.25 5165.30 7125.32 STD 3.59 9 55.91 540.27 502.79 CL 0.12 0.18 0.30 0.20 0.14 CL0 0.007 0.007 0.005 0.004 0.004
Table. 2. Mean, Standard Deviation (STD) and Confidence Level (CL ) of total losses in function of the frequency for a magnetic flux density of 1 T.
For an accurate study the CL is compared with the characterization repeatability confidence level on one sample (CL0). The confidence interval CL0 is calculated from several B(H) curve measured on the same sample (CL0 is solely the Confidence Level of the measurement process). Results show that the measurements are accurate. CL0 does not exceed 0.08 and is always 5 times lower than CL showing that a variability on the raw magnetic material exists. The confidence level CL% belongs to the interval [12%-30%] and depends on the magnetic flux density levels. However, one can notice that the variability is less pronounced on the total losses. They decrease with the frequency to reach 3.4% at 1000Hz.
A. Straigthening and Training
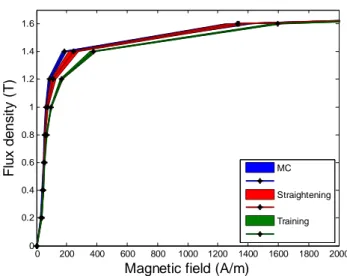
In order to emphasize the impact of straightening and training, magnetic measurements performed on sheet samples withdrawn after both processes are compared with the ones of the raw material. Note that the magnetic characteristics are measured on 9 MC samples, 6 samples after straightening and 6 samples after training. Fig.6, presents normal curves at a frequency of 50 Hz. It appears a difference between 0.8 and 1.6 T. In fact, after both processes, the required magnetic field to magnetize the material increases meaning that each process yields a degradation of the material. We can note that the impact of the training process is more pronounced.
Fig.7, shows the mean of the total losses evolution and their deviation with frequency for a magnetic flux density of 1T. It is noticed that total losses increase from one process step to another. Also, the ratio of the total losses increases, with respect to the MC sample losses, is almost constant with frequency. It is about 8.75% after straightening and 20% after training. The second interesting phenomenon is that the dispersion of total losses after both processes, especially the straightening one increases with frequency. It is 3.3 times the dispersion on MC in case of straightening while it is 2.4 times in case of training at 1000 Hz. A non-repetability of the plastic strain distribution due to the two processes could explain this dispersion.
B. Cutting
As it was mentioned before, the magnetic properties cannot be quantified accurately because of the complex sample shape (tooth shape). Instead of the normal curve, the evolution of the Flux with the magnetomotive force N*I is analyzed. Figure 8 presents a comparison between Flux (N*I) curves obtained on two samples one punched (extracted on the manufacturing line) and one cut by EDM (see III.B).
0 200 400 600 800 1000 1200 1400 1600 1800 2000 0 0.2 0.4 0.6 0.8 1 1.2 1.4 1.6
Magnetic field (A/m)
F lu x d e n s it y ( T ) MC Straightening Training
Fig. 6. Normal curves for MC, Straightening and training at 50 Hz
Fig. 7 Evolution of total losses with frequency for a magnetic flux density of 1T for MC, Straightening and training
The impact of the punching process along the edges parallel to the flux circulation is clearly visible (Fig.8). For a given magnetomotive force, the magnetic flux value for the sample obtained by punching is less than the one obtained by EDM where the effect of cutting can be considered negligible. This result indicates the global permeability deterioration due to the cutting edge. Obviously, this noticeable behaviour must be put in the context of the considered geometry that presents a tooth width of few mm and so that is very sensitive to the edge degradation due to the process of cutting.
As the magnetic behavior, the impact of punching is also pronounced on the material total losses. Fig.9 presents the total losses evolution in function of the frequency for a linkage flux equal to 3.6 µWeber, correspond to the maximal total losses ratio. The total losses in the case of punched samples are higher than the EDM ones.
losses (W/Kg) Frequency 50 (Hz) 100 (Hz) 250 (Hz) 500 (Hz) 750 (Hz) 1000 (Hz) Mean 1 2.64 10.46 31.94 63.49 102.20 STD 0.033 0.087 0.326 0.859 1.216 1.770 CL 0.066 0.066 0.062 0.054 0.038 0.034
C. Rolling, Welding and Compacting.
As they are measured likewise, measurements on packages after welding and compacting will be compared to the rolled one. In Fig.10, we can see the normal curves measured at 50Hz. We remind that on the package it is possible from the measurement of N*I and the flux to reconstruct a B(H) curve (see III.C). The B(H) curve after rolling and welding are nearly similar. Regarding, the compacting process, its effect can be divided into two regions. Under the 0.75T, the normal curve is above the one obtained after welding and whereas it is the opposite above this value.
For total losses, results are presented in Fig.11, where the samples obtained after rolling are taken as reference. For the low frequencies, losses for welded samples are slightly higher than the rolled ones, while the compacted ones are 20.24% higher at 5Hz. Now if we look at the of the total losses in function of the frequency, we can see that the total losses for welded samples, compared to the rolled ones, increase faster.
20 40 60 80 100 120 140 160 180 200 220 0 1 2 3 4 5 x 10⁻⁶ F lu x ( w e b e r) N*I (A) Punch EDM
Fig. 8. Evolution of linkage flux versus the magnetomotive force N*I at 50Hz.
0 100 200 300 400 500 600 700 800 900 1000 0 0.5 1 1.5 2 2.5 Frequency (Hz) T o ta l lo s s e s ( W ) 0 100 200 300 400 500 600 700 800 900 10001.3 1.4 1.5 1.6 1.7 1.8 Punch EDM Ratio
Fig. 9. Evolution of total losses with frequency for a magnetic flux of 3.6 µWeber for Punching and EDM.
While those for compacted samples decrease from 20.24% at 5Hz to 2.49% at 500Hz. Slinky process have been investigated in terms of impact on the magnetic properties. Due to the samples shapes, the effect of rolling alone could not be quantified. Despites this, the impact of rolling could be highlited qualitatively. In the Fig.12, we present a graph giving the magnetic field value corresponding to a magnetic flux density of 1T. It appears clearly a degradation of the material characteristics after the steps of punching and rolling with a required magnetic field to reach 1T 9 times greater.
To determine which process among punching and rolling is the most influent, we present also in Fig.12 the required magnetic field to reach the same flux value in the case of a cutting by punching and EDM (see IV-B) . The maximum ratio (Fig.8) of the magnetic field values is equal to 3. Moreover, the width of the stator yoke is equal to 5 mm while the mean width of the sample characterized in IV-B is about 2.4 mm. The effect of punching will be more pronounced in the case of the sample than in the case of the package.
0 500 1000 1500 2000 2500 3000 0 0.2 0.4 0.6 0.8 1 1.2 1.4 1.6
Magnetic field (A/m)
F lu x d e n s it y ( T ) Rolling Welding Compacting
Fig. 10 Normal curves for MC, Straightening and training at 50 Hz
0 50 100 150 200 250 300 350 400 450 500 0 10 20 30 40 50 60 70 Frequency (Hz) T o ta l lo s s e s ( W /K g ) Rolling Welding Compacting
Fig. 11. Evolution of total losses with frequency for a magnetic flux density of 1T for MC, Straightening and training.
5 5,,6611%% 8 8,,9911%% 8 8,,4422%% 1 1,,9988%% 1 122,,9900%% 2 2,,4499%% 7 7,,2211%% 2 200,,2244%% Maximum ratio
Consequently, we can definetly deduce that the impact of rolling on the stator yoke is really significant, it is even the most harmfull process.
On total losses, the effect of rolling could not be investigated alone. In Fig.13, the left graph presents the total losses evolution after each process for a magnetic flux density of 1T at 500Hz. The right graph presents also the total losses for punching and EDM for a flux of 3.6 µWeber at 500Hz which corresponds also to the maximum ratio. The total losses on the stator yoke after punching and rolling is 1.5 times the training ones. While punching alone is 1.4 times the EDM ones.
As the width of the specimens is not the same, the effet of rolling on total losses could not be deduced. This global comparison emphasizes the effect of the different manufacturing processes on the stator yoke and the effect of punching on the stator’s teeth on the magnetic properties.
0 100 200 300 400 500 600 700 800 900 1000 Raw m ate rial Stra ighten ing Tra
ininPung chin g + Ro
lling W
eldinComg pac ting M a g n e ti c f ie ld ( A /m ) 0 5 10 15 20 25 30 35 40 45 50 EDMPun ching M a g n e to m o ti v e f o rc e ( A )
Fig. 12. The required magnetic field to reach 1T after each process (left) & the required magnetomotive force to reach 3.6 µWeber (right) at 50Hz.
0 10 20 30 40 50 60 70 Raw m ate rial Straigh tening Trainin g Pun ching & Ro lling W
eldinComg pac ting T o ta l lo s s e s ( W /K g ) 0 0.1 0.2 0.3 0.4 0.5 0.6 0.7 0.8 EDM Pun ching T o ta l lo s s e s ( W )
Fig. 13 the total losses evolution along the Slinky process for 1T (left) & total losses for teeth samples for 3.6×10e -06 Weber (righ) at 500Hz.
V. DISCUSSION
The experimental results will be now discussed and verified within the frame of the state of art. First, let us specify that, in the literature, no study exists about the effect of straightening and training on magnetic properties. As both processes are based on rotating cylinders on the sheet metal surface with an applied force, the effect of both processes must be close to the cold rolling effect. Hou and Lee [21] have investigated the effect of effective rolling strain, in the range 0-0.147 for a flux density of 1.5T and a frequency of 50 Hz. It was found that permeability is inversely proportional to the square root of strain. This explains the results shown in Fig.6, for an induction above 0.8T. After each process, the strain level is higher so the permeability decreases. Also, they found that hysteresis losses increase with the square root of strain. However, eddy current losses decrease with the increase of square root of strain. If the total losses is approximated by the sum of the hysteresis losses and the eddy current losses (excess losses are neglected), there is a kind of compensation leading to a constant increase, with respect to the reference case, of the total losses (Fig.7). In [22], Baudouin et al. have shown that cold rolling is less detrimental on the magnetic properties compared to the tensile deformation. The effect of punching on the magnetic properties (Fig.8 and Fig.9) has been widely treated in the literature. The origin of the degradation is related to the involved plastic strain coming with residual stresses near the punched edge. Regarding the rolling process effect, it has not been investigated in previous studies. But, as this process acts on the material like a flexion force which involves plastic compressive strain in the inner edge region, and plastic tension strains in the outer edge region of the yoke, some studies can be used to extrapolate qualitatively on the bending process effect. In fact, the effect of plastic strains on the magnetic properties has been widely discussed, especially to emphasize that the overall magnetic properties are drastically ruined from the beginning of the plastic deformation and a strong magneto-plastic anisotropy effect appears [23]. This could explain the severe magnetic degradation that is observed after the rolling step. In [24] Hug
et al. mention that magnetic deterioration is related to the
dislocation density. In [25] Hug mentions that internal stresses affect also the magnetic behavior, while the question is how the effects between dislocation density and residual stresses could be discriminated. In [26] Iordach et al. present the magnetic properties evolution under tensile plastic strains effect in loaded and unloaded states. They show that the magnetic properties in loaded state are less detrimental than the unload one. This effect is explained by the residual stresses involved after plastic deformation. In the loaded case, the applied force tends to oppose to the residual stresses, so the magnetic properties are found less ruined. The impact of welding is observed to be negligible on the normal curves, but affects the total losses. As it is known, welding induces thermal stresses and affects magnetic properties. The fact that the normal curve after welding is not significantly modified could be explained by the stator yoke shape.
Finally, the effect of compaction shown in Fig.10 and Fig.11 does not totally match with the conclusions find in the literature. The decreasing in total losses could be due to the result presented by Hug in [25]. He mentions that the plastic straining tends to strongly decrease the dynamic losses. This phenomenon may be due to the increase of the electrical resistivity with plastic strain. This proposal explains well our results knowing that the insulation is not damaged.
VI. SUMMARY
The manufacturing line of a slinky stator is a sequence of several processes. A laminated mother coil sheet is unrolled, flattened, punched, rolled, welded and then compacted. The impact of each process on the magnetic properties has been investigated. Measurements of normal B(H) curves and total losses were carried out on samples extracted after each process. As products after each fabrication step don’t have the same shape, different characterization methods were used. The main conclusions of this measurement campaign are the following. First, a non-negligible dispersion in the raw material properties has been observed and its level changes with induction levels and frequencies. Besides, straightening and training processes modify the magnetic properties. The dispersion induced by both processes is higher than for the raw material dispersion. The welding effect seems to be the less detrimental process, while the compacting process shows positive behavior. Then, the rolling and cutting steps are found to be the most detrimental compared to the other processes. The total losses are multiplied by a factor greater than 2 after this step of the slinky stator manufacturing. To obtain a less detrimental process of slinky stator manufacturing, the rolling and the punching process should be optimized.
Thus, future works will focus on these two processes. Till now, the rolling impact hasn’t been investigated yet. A methodology is required to link the geometrical parameters (the radius, the width of the yoke…) and their impact on the magnetic properties. The cutting process is well discussed in the literature; magnetic properties could be less ruined if optimal process parameters were found. In the same way, the parameters of the punching process (cutting speed, clearance…) should be optimized.
REFERENCES
[1]. F. Libert and J. Soulard, “Manufacturing methods of stator cores with concentrated windings,” in Power Electronics, Machines and Drives,
2006. The 3rd IET International Conference on, 2006, pp. 676–680.
[2]. M.S.Lim, J.H.Kim, and J.P.Hong, “Experimental Characterization of the Slinky-Laminated Core and Iron Loss Analysis of Electrical Machine,”
IEEE Trans. Magn., vol. 51, no. 11, pp. 1–4, 2015.
[3]. R.Ramarotafika, “Modélisation stochastique de la variabilité des propriétés magnétiques des matériaux ferromagnétiques : Application sur des stators de machines électriques.” 2012.
[4]. M. Emura, F. J. G. Landgraf, W. Ross, and J. R. Barreta, “The influence of cutting technique on the magnetic properties of electrical steels,” J.
Magn. Magn. Mater., vol. 254, pp. 358–360, 2003.
[5]. Y.Kurosaki, H.Mogi, H.Fujii, T.Kubota, and M. Shiozaki, “Importance of punching and workability in non-oriented electrical steel sheets,” J.
Magn. Magn. Mater., vol. 320, no. 20, pp. 2474–2480, Oct. 2008.
[6]. A.B.Ismail, “Modélisation De La Découpe Des Tôles Ferromagnétiques.” 2007.
[7]. S.Ramde, “Simulation Numérique D’une Opération De Découpage Et Méthodologie De Calcul Pour Optimiser La Qualité De La Pièce Découpée Et Les Sollicitations De L’outillage.” 2010.
[8]. R. Hambli, “BLANKSOFT: a code for sheet metal blanking processes optimization,” J. Mater. Process. Technol., vol. 141, no. 2, pp. 234–242, Oct. 2003.
[9]. S. JANA and N.S. ONG, “Effect Of Punch Clearance In The High-Speed Blanking Of Thick Metals Using An Accelerator Designed For A Mechanical Press.” 1988.
[10]. Shih-Kang Kuo,Wen-Chieh Lee, Sheng-Yang Lin, Chen-Yuan Lu, “The Influence of Cutting Edge Deformations on Magnetic Performance Degradation of Electrical Steel.pdf.” 2014.
[11]. André Maillard, “Etude Experimentale Et Theorique Du Decoupage,” 1991.
[12]. F.Ossart, E.Hug, O.Hubert, C.Buvat, R.Billardon, “Effect of punching on electrical steels: experimental and numerical magneto-mechanical analyses.” .
[13]. A.Pumnikov ,“Modification of the magnetic properties of non oriented electrical steels by the production of electromagnetic devices.” 2004. [14]. K.Senda, M.Ishida, Y.Nakasu, and M.Yagi, “Influence of shearing
process on domain structure and magnetic properties of non-oriented electrical steel,” J. Magn. Magn. Mater., vol. 304, no. 2, pp. e513–e515, Sep. 2006.
[15]. A.Schoppa, J.Schneider, C.D.Wuppermann, and T.Bakon, “Influence of welding and sticking of laminations on the magnetic properties of non-oriented electrical steels,” J. Magn. Magn. Mater., vol. 254, pp. 367– 369, 2003.
[16]. T.Markovits and J.Takács, “Edge welding of laminated steel structure by pulsed Nd:YAG laser,” Phys. Procedia, vol. 5, pp. 47–52, 2010. [17]. W.M.Arshad et al.,“Incorporating lamination processing and component
manufacturing in electrical machine design tools,” in Industry Applications Conference, 2007. 42nd IAS Annual Meeting. Conference Record of the 2007 IEEE, 2007, pp. 94–102.
[18]. A.J.Clerc and A.Muetze, “Measurement of Stator Core Magnetic Degradation During the Manufacturing Process,” IEEE Trans. Ind. Appl., vol. 48, no. 4, pp. 1344–1352, Jul. 2012.
[19]. P.Bertoldi, A.T. de Almeida, and H.Falkner, Eds., Energy efficiency
improvements in electric motors and drives. Berlin : New York:
Springer, 2000.
[20]. K.Lunge, “Handbook of metal forming.” 1995.
[21]. C.K.Hou and S.Lee, “Effect of rolling strain on the loss separation and permeability of lamination steels,” Magn. IEEE Trans. On, vol. 30, no. 2, pp. 212–216, 1994.
[22]. P.Baudouin and Y.Houbaert, “The study of two different strain paths on the deterioration of the magnetic properties of non-oriented electrical steels.” 2003.
[23]. E.Hug, O.Hubert, and M.Clavel, “Some aspects of the magnetomechanical coupling in the strengthening of nonoriented and grain-oriented 3% sife alloys,” Magn. IEEE Trans. On, vol. 33, no. 1, pp. 763–771, 1997.
[24]. E.Hug, O.Hubert, I.Guillot, “Effect of strengthening on the magnetic behaviour of ordered intermetallic 2% V-CoFe alloys.” 2000.
[25]. E.Hug, O.Hubert, and J.J.V.Houtte, “Effect of internal stresses on the magnetic properties of non-oriented Fe–3wt.% Si and (Fe, Co)–2wt.% V alloys,” Mater. Sci. Eng. A, vol. 332, no. 1, pp. 193–202, 2002. [26]. V.E.Iordache, F.Ossart, and E.Hug, “Magnetic characterisation of
elastically and plastically tensile strained non-oriented Fe–3.2% Si steel,” J. Magn. Magn. Mater., vol. 254, pp. 57–59, 2003.