Dorion: HEC Montréal and CIRPÉE François: HEC Montréal and CIRPÉE
Grass: Corresponding author. HEC Montréal and CIRPÉE [email protected]
Jeanneret: HEC Montréal and CIRPÉE
We thank the editors Craig Lewis and Chris Veld, and an anonymous referee, as well as Tolga Cenesizoglu, Jean-Sébastien Michel, and participants at the 2013 IFM2 Mathematical Finance Days for helpful comments. François
Cahier de recherche/Working Paper 14-03
Convertible Debt and Shareholder Incentives
Christian Dorion
Pascal François
Gunnar Grass
Alexandre Jeanneret
Abstract:
Given equity’s convex payoff function, shareholders can transfer wealth from
bondholders by increasing firm risk. We test the existing hypothesis that convertible debt
reduces this classical agency problem of risk-shifting. First, we derive a measure of
shareholders’ risk incentives induced by convertible debt using a contingent claims
framework. We then document that when risk-shifting incentives are high, the propensity
to issue convertible (rather than straight) debt increases and the negative stock market
reaction following convertible debt issue announcements is amplified. We further
highlight that convertible debt is the only type of security that affects business risk
durably downwards. Our conclusions support the agency theoretic rationale for
convertible debt financing especially for financially distressed firms.
Keywords: Convertible bonds, Risk-shifting, Asset substitution, Agency conflict,
Financial distress, Asset volatility, Contingent claims
1. Introduction
Equity provides shareholders with a call option on the underlying firm. Because option values are an increasing function of risk, shareholders can transfer wealth from bondholders by increasing asset risk, leading to the classical risk-shifting (or asset substitution) agency conflict between shareholders and bondholders.
An appropriately designed convertible debt issue (Jensen and Meckling (1976) and Green (1984)) can reduce this agency conflict because conversion forces existing shareholders to share the firm’s upside potential as new sharehold-ers are carved in when convertible bondholdsharehold-ers choose to convert. This mitigates incentives for existing shareholdsharehold-ers to engage in asset substitution.
The asset substitution problem has been widely analyzed in theoretical studies on agency conflicts. Yet, De Jong and Van Dijk (2007) and Graham et al. (2002) conclude from large-scale CFO surveys that managers care little about asset substitution in practice. This may be attributable to the observation that incentives to engage in asset substitution are most acute when firms are financially distressed and that most respondents are unlikely to be financially distressed at the time of the survey. In line with this perspective, Grass (2010) challenges the notion that ex-ante concerns about asset substitution are pervasive. Consistent with his view, Eisdorfer (2008) notices that broad empirical support for this agency conflict is scarce and provides specific evidence of risk-shifting in financially distressed firms.
The first objective of this paper is to gauge the economic magnitude of risk-shifting and the potential benefits from issuing convertible debt. To evaluate the economic significance of risk-shifting incentives, we develop a simple contingent claims framework that quantifies the magnitude of shareholders’ incentives to increase risk. We then introduce “equity vega” as a measure of the potential economic loss associated with the risk-shifting incentives of shareholders (RSI).1 We compute RSI for a broad sample of U.S. firms. On average, shareholders of firms that already have outstanding convertible debt can increase the value of their equity claim by nearly 2% if they increase asset volatility by 5%. Had those firms not used convertible debt financing, this increase would have been 2.6%, implying that convertible debt has reduced RSI by 0.6 percentage points across all sample firms. A closer look at the distribution of issuers reveals that most firms are largely unaffected by asset substitution problems, indicating that RSI
1Equity vega is defined here as the partial derivative of equity value to an instantaneous change in the volatility of the underlying assets. This interpretation is somewhat loose, as we consider the sensitivity of equity to discrete changes in volatility. Our main results use a volatility change of 5%.
is highly skewed. The incentives are most pronounced for a small number of highly levered issuers that have high exposure to such incentives. For example, one percent of the firms we consider have equity vegas that exceed 25%. In line with Eisdorfer (2008), our results suggest that the change in risk-shifting incentives induced by convertible debt is more economically significant for the subset of firms close to financial distress.
Our second objective is to consider whether risk-shifting incentives are empirically relevant. Our approach is threefold. First, we conduct an event study to understand how RSI influences the market reaction to convertible debt issuance. We show that shareholders perceive convertible debt issue more negatively when risk-shifting incentives are stronger. We also explore the cross-sectional variation in RSI to investigate the determinants of the announcement of convertible debt issuances and find that issue size, regulated status and CEO ownership are important explanatory variables. Overall, the evidence is consistent with the observation that convertible debt financing can mitigate agency costs associated with asset substitution. Second, we analyze the evolution of firm risk around such offerings and compare it to changes in risk around straight debt and equity offerings. We document both a strong short-term drop and a long-lasting reduction in firm risk around the issuance of convertible debt. Third, we study the decision to issue convertible debt. Results from a multinomial logit model Ã˘a la Brown et al. (2012) show that firms with high risk-shifting incentives are more likely to issue convertible debt. The RSI-induced preference for convertible debt is even stronger when firms are financially distressed. The findings are robust across various controls and sub-samples.
The remainder of this paper is structured as follows. In Section 2, we review the literature on the use of convertible debt financing. The contingent claims analysis of risk-shifting incentives is conducted in Section 3 along with an empirical estimation of RSI for a large sample of U.S. firms that have issued convertible debt. Section 4 investigates the announcement effects of convertible debt issues. The dynamics of business risk around convertible debt issuance is examined in Section 5, and Section 6 studies the effect of RSI on the decision to issue convertible debt. Section 7 concludes. Methodological details are presented in the Appendix.
2. Previous Studies
Why do firms issue convertible debt and why do investors buy it? Despite the widespread use of convertible bonds as financing instruments, these questions remain challenging both theoretically and empirically. In this section, we
present a broad overview of the common theories explaining the existence of convertible debt together with empirical evidence, and continue with a review of studies related to convertible debt financing and risk-shifting.
2.1. Convertible Debt Financing
Early studies suggest that convertible debt can be attractive to young companies due to its relatively low coupon. Brennan and Schwartz (1988) highlight that convertible debt cannot provide firms with a “free lunch” because it does not reduce the overall costs of financing. However, it does decrease the initial interest expense and can thus be advantageous to companies that will need liquidity in the near future. Along these lines, Mayers (2000) suggests that callable convertible bonds, which allow the issuer to force conversion, can be used by companies that have sequential financing needs due to growth options. In case these options turn out to be valuable in the future, firms can force the conversion of bonds into equity and raise additional financing. If the growth options do not turn out to be valuable, bonds are not converted, and excessive financing leading to overinvestment is prevented. Mayers’ argument is supported by the observation that especially small companies with high growth rates use convertible debt for financing, as documented in Lee and Figlewicz (1999). Lyandres and Zhdanov (2013) provide another investment-based explanation for issuing convertible debt. They show using a theoretical framework that the issuance of convertibles helps alleviate the underinvestment problem (debt overhang, Myers 1977).
Stein (1992) argues that firms use convertible debt as backdoor equity financing. Given information asymmetries between management and investors, equity issues are relatively unattractive. In line with the pecking order theory, a firm therefore prefers to issue less risky securities for financing. However, debt financing can be expensive given the high cost of financial distress and potential risk-shifting problems (see Choi et al. (2010)). Callable convertible bonds allow forced conversion and are attractive for firms that are optimistic about their future stock price performance. Following a stock price increase, firms can force conversion to bring equity into their capital structures. Stein (1992) and Mayers (2000) suggest that convertible debt is particularly interesting for high-growth companies. Jalan and Barone-Adesi (1995) add that even though it is backdoor equity, convertible debt provides the benefit of interest tax deductibility until conversion, which equity does not. Stein’s (1992) argument is supported by empirical evidence that high-quality firms issue debt, medium-quality firms issue convertible debt, and low-quality firms issue equity (see Lewis et al. (1998)).
Other studies claim that convertible debt financing can be used as a signalling instrument. Nyborg (1995) studies the signalling effect of the choice of call policy. He argues that the advantages of convertible debt as delayed equity are only maintained if conversion is voluntary. Nyborg’s claim explains the observation that firms, on average, delay forced conversion until the conversion value reaches a substantial premium of 43.9% on call prices. Kraus and Brennan (1987) argue that convertible debt can be used to convey information about firm risk.
Brennan and Schwartz (1988) also use information asymmetries about firm risk to justify the use of convertible debt. However, Brennan and Schwartz’s argument is not based on signalling. Rather, they observe that the value of convertible debt is less sensitive to changes in the issuer’s risk than is straight debt because the value of the convertible’s straight debt (warrant) component decreases (increases) in asset risk. The researchers argue that, given uncertainty about the true asset volatility, convertible debt is easier to price than straight debt, and investors may therefore be willing to provide funds on better terms.
2.2. Convertible Debt and Risk-Shifting
Equity payoff is a convex function of firm value. Shareholders can therefore increase the value of their claim by augmenting firm risk. In doing so, shareholders transfer wealth from the owners of straight debt, whose payoff function is concave. As argued by Jensen and Meckling (1976) and Green (1984), convertible debt can reduce this classical agency problem of risk-shifting (also called asset substitution): If equity values are above the strike price of the conversion option (which corresponds to a warrant), convertible debt investors will exercise the option and convert their bonds to newly issued shares, diluting the wealth of old shareholders who now must share the firm’s upside potential. The introduction of convertible debt thus alters the payoff function of equity such that the incentives of existing shareholders to shift risk via asset substitution decrease. Green (1984) concludes that the right convertible design can align the objectives of firm and equity value maximization.
Multiple studies show different limitations of Green’s (1984) argument. Using game theoretical analysis, François et al. (2011) show that Green’s results do not necessarily extend to a multi-period setting. Frierman and Viswanath (1993) argue that the effectiveness of convertible debt in reducing the risk-shifting problem is limited if investors can trade derivatives written on firm assets. According to Chesney and Gibson-Asner (2001) and Grass (2010), the risk-shifting problem is less severe when accounting for the possibility of default before debt maturity. In contrast,
Hennessy and Tserlukevich (2009) argue that shareholders always benefit from increases in asset risk if the firm is close to default.
Several empirical studies support the relevance of risk-shifting for the choice of convertible debt as a financing in-strument. Lewis et al. (1999) observe that price reactions around convertible debt issues are conditioned on investors’ expectation of whether or not they are used to reduce agency conflicts. The researchers suggest that both asset substi-tution and information asymmetries are motives for issuing convertibles. Krishnaswami and Devrim (2008) provide empirical evidence that the agency cost of debt determines the choice of convertible over straight debt financing. King and Mauer (2012) show that the call policy for convertible bonds is, in part, designed to reduce agency conflicts between equity and debt.
Additionally, several studies examine the long-term change in different measures of risk around convertible debt issues. Lewis et al. (2002) report decreases in asset and equity betas and increases in idiosyncratic and total risk for their sample period 1979-1990. They conclude that not all issuers use convertible debt financing to reduce agency conflicts. Zeidler et al. (2012) confirm the decrease in systematic equity risk for the years 1980-2002 and document that this change is more pronounced for small firms.
In summary, the discussion about whether convertible debt can and does mitigate risk-shifting is not over. Vari-ous theoretical studies questioning Green’s (1984) argument contrast with scarce empirical evidence supporting the general notion that convertible debt is used to mitigate the agency conflicts of debt financing. We add to the existing literature by isolating the effects of convertible debt on the value of risk-shifting for a broad dataset using a contingent claims framework. Understanding what drives these changes in incentives is not obvious. As pointed out by Siddiqi (2009), who uses simulation techniques to derive the optimal financing mix, agency costs of risk-shifting are very sensitive to the capital structure choice.
Our paper contributes to the literature by measuring risk-shifting incentives and quantifying the economic signifi-cance of the risk-mitigating role of convertible debt.
3. The Magnitude of Risk-Shifting Incentives
Risk-shifting incentives can create an agency conflict if the magnitude of such incentives is economically signif-icant. In this section, we propose a measure of risk-shifting that we first discuss in a numerical analysis and that we then employ in a comprehensive empirical study.
3.1. Measuring the Benefits from Risk-Shifting
The proposed measure is based on the pricing of equity as an option on firm assets. We start by introducing the pricing framework employed in this study.
We consider that firms are financed with a combination of equity E, straight debt DS, and subordinated convertible
debt DC. All debt matures at time T , which also corresponds to the time of conversion.2 The face values of straight
and convertible debt are denoted by FSand FC, and r is the risk-free rate. All three claims add up to firm value V :
V = E + DS+ DC. (1)
This framework allows us to price all three securities using standard pricing formulae for European options. The values of equity, straight debt and convertible debt as contingent claims are given by:
E = C (K = FS+ FC, ·) − αC ! K = FS+FC α, · " , (2) DS= FSe−rT− P (K = F S, ·), (3) and DC= FCe−rT+ P (K = FS, ·) − P(K = FS+ FC, ·) + αC ! K = FS+ FC α , · " , (4)
where C(K, ·) and P(K, ·) are the values of a European call and put option on firm value, calculated as a function of strike price K and other pricing parameters using the Black and Scholes (1973) and Merton (1974) pricing formulae.
2This assumption is reasonable for any firm with a moderate payout policy, no shocks to firm value dynamics and for which forced conversion can be ruled out by assuming that the convertible is non-callable. Empirically, Nyborg (1995) observes that even if a convertible is callable, firms tend to significantly delay the use of their call option for forcing conversion.
Finally, α is the conversion ratio expressed in percentage terms. It is equal to the fraction of total equity owned by the new shareholders and thus measures the dilution of existing equity induced in case of conversion.
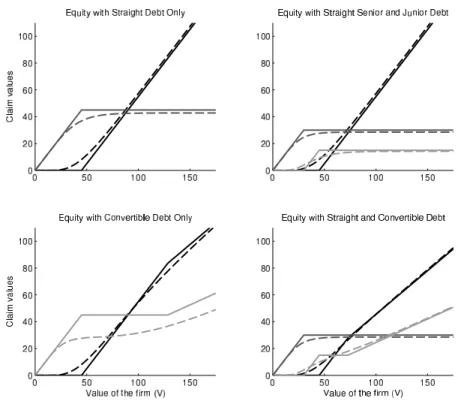
Figure 1 illustrates how these securities can be viewed as options written on firm assets. In the simple Black and Scholes (1973) and Merton (1974) framework (upper left graph), shareholders own a call option, while debt holders hold a combination of a risk-free bond and a short put option on firm value. This is due to their payoff structure: Equity holders have unlimited upside potential and thus benefit from positive firm developments. At the same time, equity holders have limited liability if the firm defaults. Debt holders, however, lose a part or all of their investment if the firm defaults, but never get more than the pre-agreed face value at debt maturity - even if firm value increases substantially.
[Figure 1 about here.]
In contrast, the owners of convertible debt (both lower graphs in Figure 1) participate in the firm’s upside potential as their payoff increases beyond the face value of the convertible if asset values are high enough to make the conversion valuable. Convertible debt financing affects the payoff and thus the pricing of equity: If the option to convert the bond into equity is in the money, owners of convertible debt will exercise it. As opposed to the exercise of a plain vanilla call option on a stock, the exercise of the conversion option corresponds to the exercise of a warrant. This means that old shareholders must share the payoff with new shareholders as new equity is issued and existing equity is diluted (stock settled convertibles).
The last decade has witnessed a surge in the issuance of cash-settled convertibles. Lewis and Verwijmeren (2011, 2013) show that this trend can be attributed to changes in accounting rules. The cash settlement provision hardly af-fects the risk incentive mitigation effect of convertibles, however. Indeed, by selling a conversion option, shareholders commit to sharing the upside benefits with convertible debt holders. This in turn creates the concavity in shareholders’ payoff, which essentially provides the disincentive for risk-shifting. Admittedly, the cash settlement provision allows shareholders to avoid dilution upon conversion. Equity holders are thus obliged to share the upside firm value but not voting rights with convertible debt holders. Compared to cash-settled convertibles, stock-settled convertibles might therefore induce a stronger disincentive for risk-shifting, as their conversion entails for shareholders a loss in value and control.
In practice, most firms using convertible debt are also partly financed with straight debt. This is important for our study because we are interested in the agency conflict between shareholders and the owners of straight debt (also referred to as bondholders). Whenever a firm is financed with both convertible and straight debt, we assume the former to be subordinated. The lower right graph thus represents the capital structure that is at the center of our study. Shareholders have incentives to increase firm risk under the simple capital structure (see the upper left graph in Figure 1). Given their convex payoff, shareholders benefit from the higher upside potential, but do not have to be concerned about the increased downside of risky investments. The change in the value of their claim following an increase in risk can be computed using the formula that prices equity as a contingent claim.
We now introduce an intuitive measure of the value of risk-shifting. Based on Equation 2, we calculate sharehold-ers’ risk-shifting incentives, RSI, as follows:
RSI =E (σV+ κ, T, ·)
E (σV, T, ·) − 1, (5)
where κ describes an exogenous shift in firm risk. The RSI measure captures by how many percentage points the value of equity changes given a shift in firm risk. It is thus a direct measure of the value of risk-shifting to shareholders. We examine the classical agency conflict arising from the incentive of shareholders to steal wealth from bondholders by risk-shifting. Shareholders will typically risk-shift by increasing firm risk as long as their payoff is convex in firm value. We thus restrict our analysis to κ > 0.
3.2. Numerical Analysis
Figure 2 displays RSI and the dollar value of risk-shifting, E (σV+ κ, T, ·) − E (σV, T, ·), as a function of asset
value. Interestingly, the dollar value gain from risk-shifting admits a maximum for relatively low asset value (see left graph of Figure 2). Indeed, in the extreme cases (asset value being very low or very high), the value of equity gets very close to the intrinsic value of the call option on assets. The speculative value being close to zero, there is not much to gain (in dollars) from risk-shifting. In relative terms (which is what shareholders care about), the story is quite different. The right graph of Figure 2 shows indeed that shareholders’ incentive to increase risk is highest for low firm values, that is, in financial distress, both under straightdebtonly financing (black line) and a straight debt
-convertible debt mix.3Convertible debt in the capital structure clearly attenuates the risk-shifting incentive.
[Figure 2 about here.]
Overall, we note that the change in the value of risk-shifting induced by convertible debt can amount to several percentage points, which clearly is economically significant. Second, convertible debt has the strongest impact on risk-shifting incentives for firms in financial distress. Firms with little debt are distant from default and, in contrast to shareholders of distressed firms, their shareholders cannot steal a significant amount of wealth from bondholders by risk-shifting. In line with this finding, Eisdorfer (2008) documents a tendency of firms in financial distress to take on risky projects even if they generate little or no value.
3.3. Empirical Estimation of Risk-Shifting Incentives
In the following subsection, we estimate the effect of convertible debt on shareholders’ risk-shifting incentives for a broad sample of U.S. firms.
3.3.1. Data and Parameters
Our sample covers the period 1984 to 2010 and consists of all firm-year observations with reported convertible debt financing. We exclude observations for which the central accounting and stock market variables needed to compute pricing parameters are not available in the Compustat and CRSP databases.4 The sample includes 17,867 firm-year observations. Appendix A provides details on the calculation of the different pricing parameters and variables.
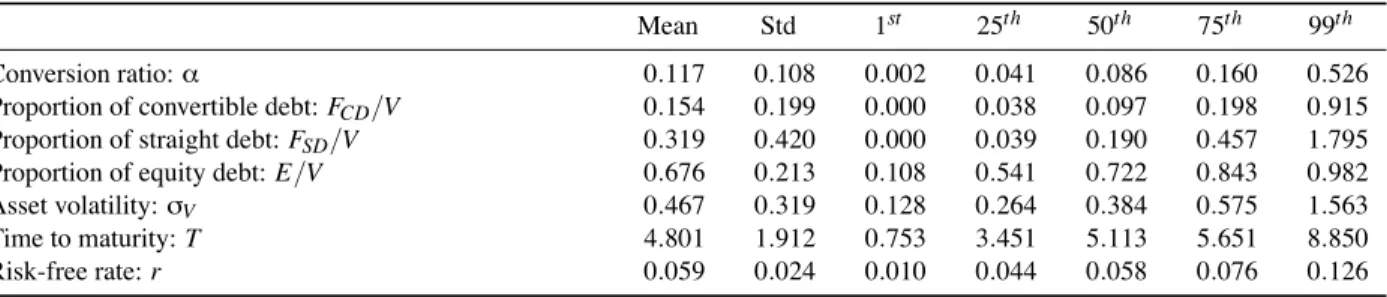
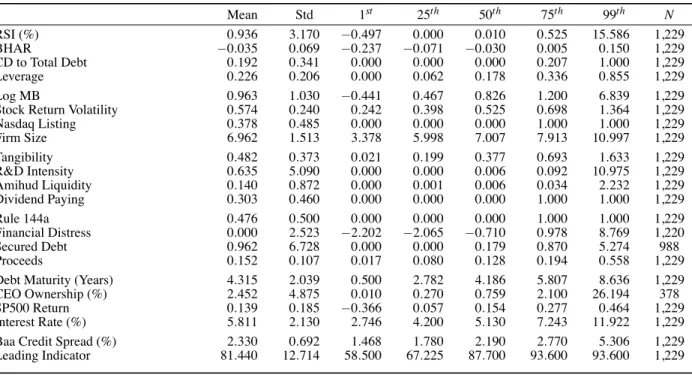
Table 1 displays descriptive statistics for our parameter estimates, which are in line with those documented in the previous literature. As outlined in Section 2, issuing convertible debt is particularly interesting for young, small, and risky firms with high growth.
[Table 1 about here.]
3Given that the face value of debt is fixed in Figure 2, low firm values correspond to high leverage. For the lowest firm values displayed, firms can be considered in financial distress.
4Specifically, we require the availability of the Compustat items DLTT, DLC, DCVT, SIC, and CSHO, and the CRSP items SHROUT, PRC, and RET.
On average, firms with convertible debt are substantially leveraged (with book leverage close to 50%) and have risky operations (with asset volatility at approximately 47%).5However, we note some strong heterogeneity in lever-age, business risk, and conversion ratio.
3.3.2. Results
Table 2 shows empirical estimates for shareholders’ risk-shifting incentives for a comprehensive sample of firms that use convertible debt financing. It also reports how they are affected by convertible debt. We compute the risk-shifting incentives, RSI, with and without convertible debt. The first row of each panel shows the increase in share-holder value following a rise in firm risk by κ under the actual capital structure, including convertible debt financing.
[Table 2 about here.]
Panel (a) of Table 2 indicates that, on average, shareholders can increase the value of their claim by nearly 2% if they increase asset volatility by 5%. Comparing average and median values indicates that the distribution of RSI is highly skewed. For the majority of firms, risk-shifting incentives are negligible, and firms are therefore unaffected by the asset substitution problem. However, a small number of firms exhibit a high exposure to such risk. For the top one percent of firms, a 5% increase in asset volatility induces a 25% increase in equity value.
Shareholders benefit from increases in firm risk under most capital structures. However, in some scenarios, con-vertible debt can encourage shareholders to reduce asset risk in order to lower the likelihood of conversion and thus the dilution of existing shares. Therefore, RSI can be either positive or negative.
The second row displays statistics for the distribution of RSI computed for hypothetical firms in which convertible debt financing has been replaced with straight debt financing (that is, the conversion ratio is set to zero). Shareholders will always benefit from increases in firm risk under this simple financing mix of straight debt and equity. The third row reports the difference between the true RSI and the hypothetical RSI (second row minus first row values) and is positive by construction. For the average firm, the presence of convertible debt decreases the value of risk-shifting by
5Our estimate of asset risk is higher than that reported in various other studies, in particular because of the covered time period that includes the 2008 financial crisis. Eisdorfer (2008) reports an average asset volatility of 25% for a comprehensive sample covering the years 1963 to 2002 and thus including early years during which asset risk was low. Eom et al. (2004) calculates an average asset risk of 23% for a sample of large issuers of corporate bonds. For a more comparable sample covering the period 1980-2003, Bharath and Shumway (2008) report clearly higher values. They calculate median volatilities of 46% and 42% using the iterative measure by Crosbie and Bohn (2003), and their own measure, respectively.
almost 0.6 percentage points: Without convertible debt, shareholders could have increased the value of their claim by 2.6% instead of 2% had they increased asset volatility by 5%. Inspection of panels 2 (a), 2 (b) and 2 (c) shows that RSI and changes in RSI almost linearly increase with κ. Hence, the RSI metric, as a sensitivity measure, is largely unaffected by the choice of κ.
Overall, the results presented in Table 2 are consistent with the hypothesis that the issuance of convertible debt can substantially reduce the benefits from risk-shifting.
4. Announcement Effects of Convertible Debt Issues
The main objective of this paper is to investigate whether convertible debt financing can help alleviate the classical agency problem between equity holders and bondholders. Convertible debt financing reduces shareholders’ incentives to increase risk and limits their potential to transfer wealth from bondholders. We therefore expect equity prices to decrease and the value of straight debt to increase upon issuance of convertible debt. Our model further predicts pricing effects to be particularly pronounced for firms with strong RSI that are in financial distress. We test these predictions by conducting a detailed event study of 1,229 convertible bond offerings on the issuer’s equity returns. We also explore the effect on a firm’s cost of debt.
4.1. Computation of Abnormal Equity Returns
Our primary dataset includes convertible debt offerings made between 1984 and 2010 that are included in the SDC Platinum database. Following common methodology, we delete offerings made by financial firms. As discussed later in this paper, regulation can have an impact on the agency problem of risk-shifting. We therefore also exclude utilities and firms active in the telecommunications sector – which was only deregulated at the end of the last century – from our main sample and examine them in a separate analysis. Furthermore, we follow Duca et al. (2012) and only include standard types of convertible bonds. Specifically, we exclude mandatory convertibles, exchangeable bonds, and convertible preferred stock. Finally, we delete all observations from the sample for which we are not able to obtain the necessary data to construct our control variables.
returns (BHARs). The event window spans one day before to one day after the event.6The event date determination strictly follows the approach of Duca et al. (2012) and is detailed in Appendix B. We define a stock’s BHAR as the difference between its return and the return predicted by a one-factor market model, where the market index is given by the CRSP value-weighted index.7 Parameters of the market model are estimated over a window of 255 trading days ending 31 days before the event. Returns must be available for at least 90 days during the estimation window. In case an event falls on a non-trading date, we change it to the next trading date.
We observe negative and significant abnormal returns around the announcement of convertible debt offerings. Over the 1984-2010 period, the average 3-day effect is -3.5% (see Table 3(a)). Both the sign and the magnitude are in line with previous studies. Dann and Mikkelson (1984) show that shareholders earn significant abnormal returns of -2.31% on the announcement date of convertible debt offerings. Similarly, Eckbo (1986) reports an average two-day abnormal return relative to the announcement date that varies between -1.2% and -1.8%, and shows that the effect increases for lower debt ratings. Duca et al. (2012) show that the 3-day effect varies between -1.7% over the 1984-1999 period and -4.6% over the period 2000-2008. Henderson and Zhao (2013) find a similar two-day announcement effect (-4.78%) over the period 2000-2010.8
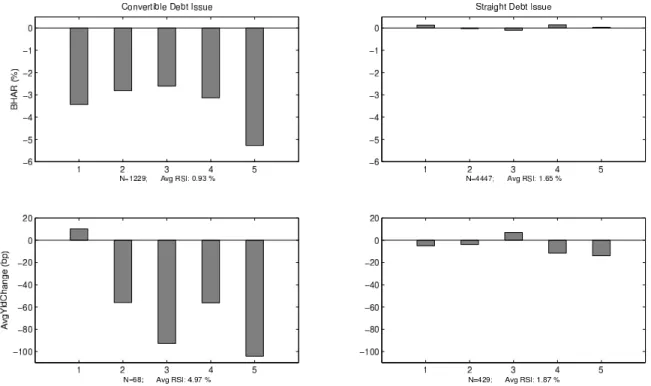
Figure 3 displays the average announcement effect on BHARs by quintiles of RSI. Consistent with our prediction, the market reaction to convertible debt issues appears more pronounced when the level of risk-shifting is high (top-left panel). In contrast, the emission of straight debt does not seem to affect shareholder wealth, regardless of the level of RSI (top-right panel).
[Figure 3 about here.]
4.2. Regression Analysis of Announcement Effects
We now conduct a cross-sectional analysis of the relation between the stock price effects around the issuance date and the characteristics of both the issuer and the issued security. In line with De Jong et al. (2011) and Duca et al.
6Consistent with Duca et al. (2012), we include the day following the event in order to capture the reaction to an announcement made after the closing of the stock markets. Our results are robust to using an event window spanning only two days.
7Given that we examine short term announcement effects, BHARs are virtually identical to traditional cumulative abnormal returns; the corre-lation between the two equals 99.9%.
8This result holds for convertible issuers that are not conducting concurrent transactions. In their analysis, Henderson and Zhao (2013) show that the announcement effect varies when convertible issuers conduct concurrent transactions.
(2012), we run a regression of abnormal returns (BHAR) on a set of variables of interest. In particular, we focus on the firm’s level of RSI as presented in subsection 3.1 and explained in detail in Appendix A.
4.2.1. Control Variables
Our set of control variables is similar to that used in Brown et al. (2012). Because the authors document significant differences between firms that issue convertible debt privately versus publicly, we include a dummy that equals one for all Rule 144a placements. Our baseline specification includes issuer-specific and market-wide variables.
As far as issuer-specific controls are concerned, we include the logarithm of the market-to-book ratio, a dummy for whether the issuer’s stock is listed on Nasdaq, firm size as measured by the logarithm of the issuer’s total assets, the fraction of property plant and equipment over total assets (referred to as asset tangibility), the ratio of research and development expenses over sales (referred to as R&D intensity), the Amihud (2002) measure for equity liquidity, and a dummy for dividend-paying firms.
Market-wide variables include the one-year stock market return computed on the S&P500, the 10-year Treasury rate, the average spread of Moody’s Baa corporate bonds over the 10-year Treasury rate, and the Conference Board’s Leading Economic Indicator. Appendix C provides a detailed definition of each of the control variables.
[Table 3 about here.]
Table 3 reports descriptive statistics for control variables for firms issuing convertible debt or straight debt. The two groups of firms exhibit different characteristics. Compared to firms issuing straight debt, firms issuing convertible debt have a profile that is more in line with a younger firm: They are smaller, have less leverage, less tangible assets, more growth opportunities, more volatile equity returns, and are more likely to be listed on the Nasdaq.
4.2.2. Effect of Risk-shifting Incentives
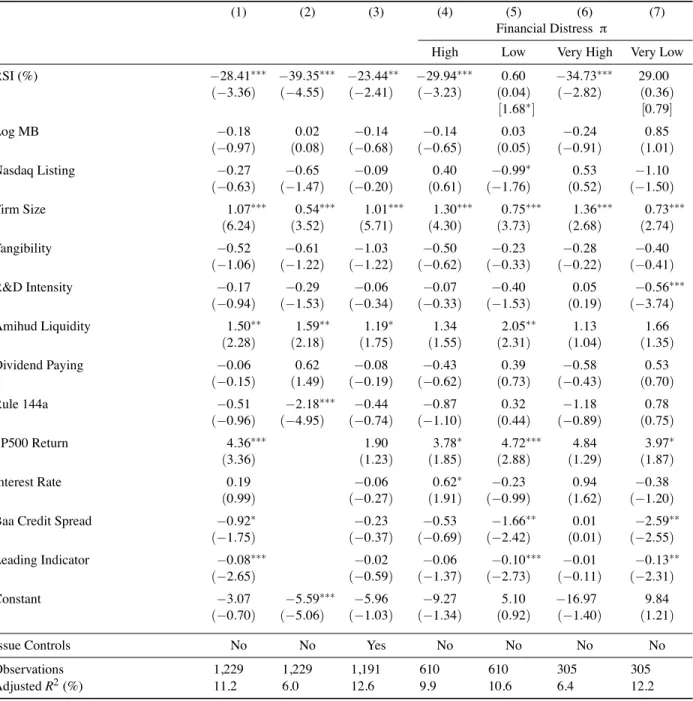
We now test whether the reaction of stock prices to convertible debt announcements can be attributed to variations in shareholders’ risk-shifting incentives. Table 4 reports the results of different regression specifications with BHARs over the window (-1,+1) relative to convertible debt issuances as the dependent variable.
Column (1) shows that RSI enters significantly and negatively, suggesting that a convertible debt issue is perceived more negatively by shareholders when risk-shifting incentives are stronger. The interpretation of a coefficient of -28.41 is as follows. A one standard deviation increase in RSI (equal to 0.0317) decreases BHARs from its average of -3.5% to -4.4%. The marginal change is -0.9% (i.e. 0.0317 × − 28.41), which is economically sizable. The effect of RSI remains large and significant when excluding market-wide variables (see Column (2)), as well as when including issue-specific variables (see Column (3)).9
4.2.3. Analysis by Distress Level
The issuance of convertible debt limits the possibility for shareholders to steal wealth from bondholders. Equity returns to convertible debt announcements should be more negative for firms with significant credit risk, as the benefits from risk-shifting are highest for these companies. We test the hypothesis that convertible debt can mitigate agency conflicts in financially distressed firms by conditioning the announcement effects on the credit risk level. Our measure of credit risk is based on the study of Campbell et al. (2008) and explained in Appendix C.
The baseline regression is run on subsamples broken down by credit risk levels: above and below the median (Columns (4) and (5)) or top and bottom quartiles (Columns (6) and (7)). In line with our prediction, we observe that equity values are particularly sensitive to the level of RSI when firms are in financial distress. RSI coefficients obtained from regressions fitted on subsamples of high versus low credit risk issuers are substantially different in terms of their magnitude. The difference, however, can hardly be pinned down statistically. Given that the average RSI of low credit risk firms is extremely small, the RSI coefficients for the low credit risk subsamples thus have high standard errors. Accordingly, we only observe a weak statistical significance of the difference for the split along the median, but not along quartiles.
4.2.4. Cross-Sectional Variations in the Effect of RSI
We now explore cross-sectional variations in the effect of RSI to better understand which firms are more affected by the announcement of convertible debt issuance through RSI. For each variable of interest, we break down the
9The issue-specific variables considered are from Duca et al. (2012). They consist of dummies indicating whether the convertible bond is non-callable, whether it is the first time the firm issues convertible debt, whether the issue date equals the announcement date used in the event study, and two time dummies indicating whether the issue was announced between 1/1/2000 and 14/9/2008 or between 15/9/2008 and 31/12/2009.
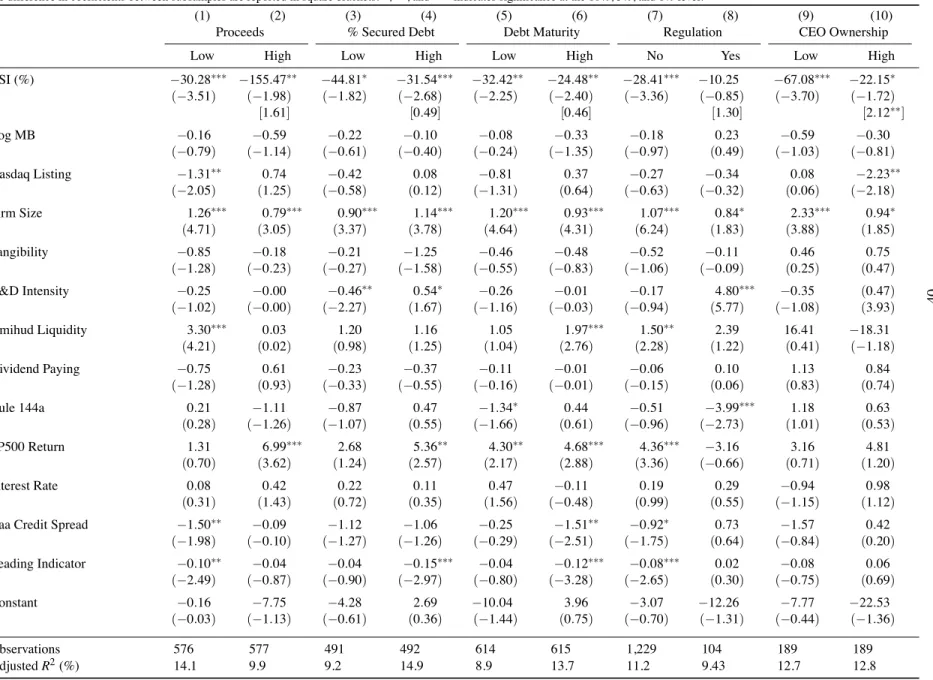
sample according to the median, and run the baseline regression on the two subsamples. Table 5 reports the results. The negative market reaction following convertible debt issuance is consistent with the correction of an agency conflict between shareholders and creditors. All else equal, the greater the size of the convertible debt issue, the stronger the mitigation of the agency conflict. In line with this intuition, we find that large issue size is associated with a strong contribution of RSI to the negative market reaction (see the RSI coefficients in Columns (1) and (2)).
When debt is secured, we expect the agency conflict to be mitigated, implying that RSI should play a smaller role in explaining the BHARs. Similarly, short-term debt is commonly viewed as a disciplining financing tool that reduces the magnitude of agency conflicts. Along this line, the effect of RSI should be weaker when debt maturity is short. The data indicates, however, that the effect of RSI is similar across debt maturity and whether debt is secured or not (the RSI coefficients have comparable magnitude and significance in Columns (3) and (4) as well as Columns (5) and (6) in Table 5).
Regulated firms may not have shareholder value maximization as their only objective. Consequently, these firms are less concerned with the asset substitution problem, and we expect the market reaction to convertible debt issuance to be little affected by RSI in regulated industries. Our regression results indicate that the effect of RSI becomes indeed insignificant when it comes to regulated firms.10
The CEO’s decision to issue convertible debt can weakly or strongly reduce the shareholder-bondholder agency problem, depending on the alignment of his interests with those of shareholders, as measured by the CEO’s equity share. We therefore expect the negative market reaction to exhibit a stronger dependance on the level of RSI when the CEO has a low equity share. This is indeed what we observe in the data (see Columns (9) and (10)).
[Table 5 about here.]
4.3. Changes in Yield Spreads
To further examine the extent to which convertible debt issues help attenuate the agency problem between share-holders and bondshare-holders, we now analyze the effect of such announcements on the value of straight debt. In particular, we examine changes in yield spreads on straight bonds issued by firms previous to their announcement of a convertible
bond offer. Our sample includes 68 announcements occurring in such a setting. The number of events for which all required data is available is small, as explained in detail in Appendix B. Nonetheless, estimating the announcement effects of convertible debt issues on the change in average yield spread is useful.
On average, yield spreads decrease by 0.60% following the announcement of convertible debt. The reduction in the costs of debt is both statistically and economically significant. As argued previously, the agency conflict between shareholders and bondholders should be particularly pronounced for firms close to financial distress. If convertible debt can indeed reduce shareholder incentives to shift risk, bondholders should benefit most from convertible debt if the issuing firm has a high level of RSI.
Figure 3 displays average announcement effects on firm yield spreads by quintiles of RSI (lower-left panel). Consistent with the analysis of equity returns, the market reaction captured by the change in yield spreads is highest for firms whose shareholders have the strongest incentives to shift risk.11 In contrast, no clear pattern emerges when we focus on straight debt issues (right panels).
In sum, convertible debt issues are bad news for equity holders and good news for creditors, especially when the agency conflict between shareholders and bondholders is severe, as indicated by a high RSI. Figure 3 shows this wealth transfer from bondholders to shareholders. It is consistent with the view that convertible debt reduces the benefits of risk-shifting to shareholders, decreasing their expected cash flows and increasing those to bondholders.
5. Impact on Real Investment Decisions
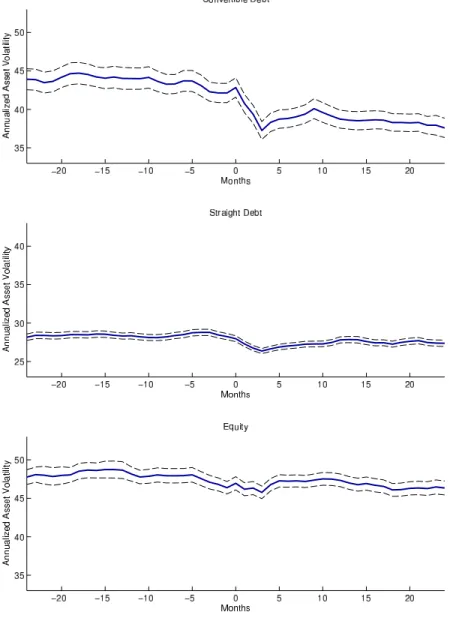
Another way to examine the risk-mitigating effect of convertible debt is to investigate the level of investment in risky projects following the issuance of such security. To this end, we study the dynamics of firm volatility before and after convertible debt is emitted. We examine the asset volatility that is inverted from equity price dynamics using the Bharath and Shumway (2008) methodology.12
[Figure 4 about here.]
11The increase in the value of straight debt is significant for the upper four RSI quintiles. This can be explained by the fact that the average RSI is very high for the subsample of 68 firms issuing convertible debt, which already have straight bonds outstanding as of the announcement date.
12Alternatively, we computed asset volatility using the iterative method described by Crosbie and Bohn (2003). Results are robust to this choice and available upon request.
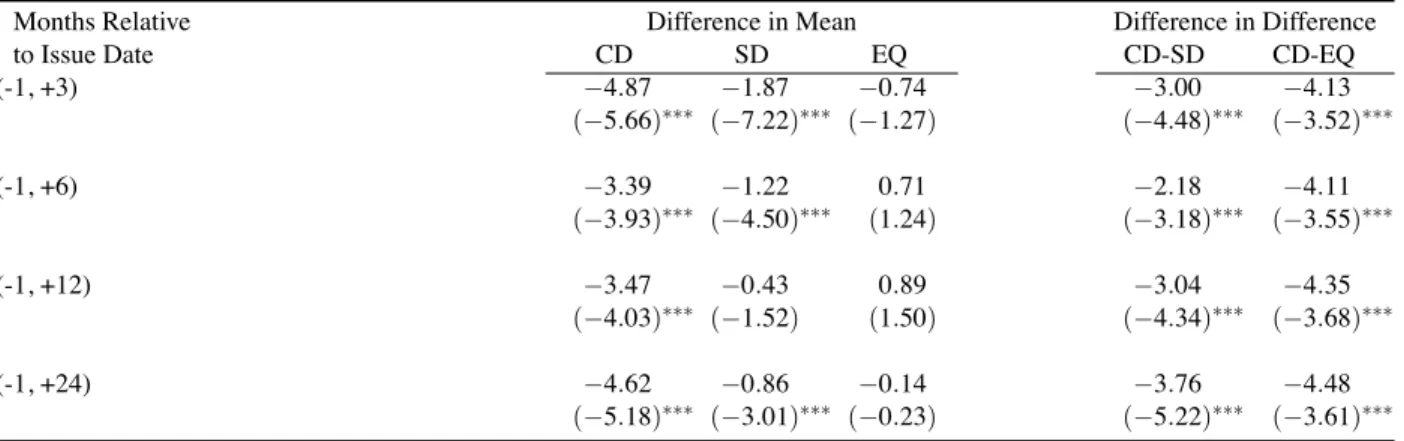
Figure 4 illustrates a clear decline in asset volatility after the issuance of convertible debt. We observe a strong drop in the short run and a long-lasting reduction. Table 6 reports a decrease of 4.87 percentage points (4.62 percentage points) in asset volatility three months (two years) following the issuance of convertible debt. In contrast, the issuance of other types of securities (equity or straight debt) induces a weaker, short-term decrease in asset volatility that vanishes after a few months. Table 6 reports a drop in asset volatility induced by equity or straight debt that is substantially lower in magnitude than the one induced by convertible debt. Convertible debt therefore appears to be the only type of security that affects business risk durably downwards.
[Table 6 about here.]
6. Risk-Shifting Incentives and the Decision to Issue Convertible Debt
So far, we have examined the consequences of issuing convertible debt. However, risk-shifting incentives should also influence the decision to issue convertible debt (as opposed to straight debt) in the first place. The aim of this section is to analyze whether firms with higher RSI are more prone to issue convertible debt rather than straight debt. We also explore how this effect varies with firm characteristics.
We follow the approach of Hovakimian et al. (2001) and Brown et al. (2012) and employ a multinomial logit model to predict the issuance of convertible debt. As shown in these studies, controlling for the possibility of issuing equity is important when examining the choice between straight and convertible debt.
Table 7 reports the results of a multinomial logit regression for which the dependent variable is zero for straight debt issues (base case), one for convertible debt issuance and two for equity issuance. As our analysis focuses on the decision to issue straight or convertible debt, we only report results for this alternative. Results for the equity issuance decision are available upon request. The baseline model is the same as in Section 4. We add two variables to control for the firm’s capital structure prevailing a quarter before the announcement of new debt issue, firm leverage and the ratio of convertible debt to total debt. As indicated by the positive and strongly significant RSI coefficients, firms with higher risk-shifting incentives prefer to issue convertible debt. This result holds with and without market-wide controls (see Columns (1) and (2)).
When choosing their financing sources, firms may be limited to using one type of debt or another. This raises a concern if the dependent variable reflects a choice between convertible and straight debt financing. To address this issue, we run the regression on a restricted sample of firms that already had convertible debt in their capital structures before the new issue. For these firms, we find that the effect of RSI remains significant and at least as strong as in the baseline case.
We finally explore how the level of credit risk affects the preference for convertibles induced by RSI. As in Section 4, the baseline regression is run on subsamples broken down by credit risk levels. When splitting the sample of observations along the median financial distress metric (see Columns (4) and (5)), the influence of RSI on the choice of the type of debt is largely unaffected by credit risk. It nevertheless appears stronger for distressed firms when splitting the sample into quartiles (see Columns (6) and (7)). The same finding also holds for the subset of firms that already have convertible debt outstanding (see Columns (8) and (9)).
7. Conclusion
As equity resembles a call option on firm assets, shareholders can steal wealth from bondholders by increasing asset volatility. This article examines whether convertible debt can reduce this classical agency problem of risk-shifting. The following four results support this hypothesis.
First, we show that both the magnitude of the agency conflict and its mitigation through convertible debt can be economically significant. To show this, we propose a simple measure of shareholders’ risk-shifting incentives, RSI. It is calculated as the percentage change in the option value of equity due to an increase in asset volatility. We estimate RSI for a comprehensive data set of firms using convertible debt financing. Even though risk-shifting incentives are low for the majority of companies, a small number of firms exhibit a high exposure to the risk-shifting problem: For the top one percent of firms, a 5% increase in asset volatility induces a 25% increase in equity value. In the upper percentile, convertible debt reduces the benefits of risk-shifting by more than 4%. Second, we examine the announcement effects of convertible debt issues on the value of equity and straight debt and document a wealth transfer from shareholders to bondholders, which is particularly pronounced for firms with high RSI. Share prices drop by 3.5%, while the cost of debt decreases by 0.6% around the announcement of convertible issues. This wealth transfer
is consistent with our main hypothesis: if convertible debt reduces the benefits of risk-shifting for shareholders, it decreases their expected cash-flows and increases those of bondholders. We do not observe a wealth transfer around the announcement of straight debt offerings. Third, we document that the level of investment in risky projects – as proxied for by asset volatility – decreases following the issuance of convertible debt. The drop in volatility is substantially lower around equity and straight debt offerings. Finally, an ex-ante analysis of the decision to issue convertible debt shows that firms with higher risk-shifting incentives prefer using convertible debt over straight debt. Our findings suggest that even though risk-shifting is not a concern in most companies, it affects claim values, financing choice and operational decisions for a subset of firms, particularly those close to financial distress. Convert-ible debt appears to be one way of mitigating this agency conflict.
References
Amihud, Y., 2002. Illiquidity and stock returns. Journal of Financial Markets 5, 31–56.
Barclay, M.J., Smith, C.W., 1995. The maturity structure of corporate debt. Journal of Finance 50, 606–631.
Bharath, S., Shumway, T., 2008. Forecasting default with the merton distance to default model. Review of Financial Studies 21, 1339–1369.
Black, F., Scholes, M., 1973. The pricing of options and corporate liabilities. Journal of Political Economy 81, 637–654.
Brennan, M.J., Schwartz, E.S., 1988. The case for convertibles. Journal of Applied Corporate Finance 1, 55–65.
Brown, S.J., Grundy, B.D., Lewis, C.M., Verwijmeren, P., 2012. Convertibles and hedge funds as distributors of equity exposure. Review of
Financial Studies 25, 3077–3112.
Campbell, J.Y., Hilscher, J., Szilagyi, J., 2008. In search of distress risk. Journal of Finance 63, 2899–2939.
Chesney, M., Gibson-Asner, R., 2001. Reducing asset substitution with warrant and convertible debt issues. Journal of Derivatives 9, 39–52.
Choi, D., Getmansky, M., Henderson, B., Tookes, H., 2010. Convertible bond arbitrageurs as suppliers of capital. Review of Financial Studies 23,
2492–2522.
Crosbie, P., Bohn, J., 2003. Modeling default risk. Working Paper, KMV Corporation , 1–31.
Dann, L.Y., Mikkelson, W.H., 1984. Convertible debt issuance, capital structure change and financing-related information: Some new evidence.
Journal of Financial Economics 13, 157–186.
De Jong, A., Dutordoir, M., Verwijmeren, P., 2011. Why do convertible issuers simultaneously repurchase stock? An arbitrage-based explanation.
Journal of Financial Economics 100, 113–129.
De Jong, A., Van Dijk, R., 2007. Determinants of leverage and agency problems: A regression approach with survey data. The European Journal
of Finance 13, 565–593.
Duca, E., Dutordoir, M., Veld, C., Verwijmeren, P., 2012. Why are convertible bond announcements associated with increasingly negative issuer
stock returns? An arbitrage-based explanation. Journal of Banking and Finance 36, 2884–2899.
Eckbo, B.E., 1986. Valuation effects of corporate debt offerings. Journal of Financial Economics 15, 119–151.
Eisdorfer, A., 2008. Empirical evidence of risk-shifting in financially distressed firms. Journal of Finance 63, 609–638.
Eom, Y.H., Helwege, J., Huang, J.Z., 2004. Structural models of corporate bond pricing: An empirical analysis. Review of Financial Studies 17,
499–544.
François, P., Hübner, G., Papageorgiou, N., 2011. Strategic analysis of risk-shifting incentives with convertible debt. Quarterly Journal of Finance
1, 293–321.
Frierman, M., Viswanath, P., 1993. Agency problems of debt, convertible securities, and deviations from absolute priority in bankruptcy. Journal
of Law and Economics 37, 455–476.
Graham, J.R., Lemmon, M.L., Wolf, J.G., 2002. Does corporate diversification destroy value? Journal of Finance 57, 695–720.
Grass, G., 2010. The impact of conglomeration on the option value of equity. Journal of Banking and Finance 34, 3010–3024.
Henderson, B.J., Zhao, B., 2013. More than meets the eye: Convertible bond issuers’ concurrent transactions. Journal of Corporate Finance
(forthcoming).
Hennessy, C.A., Tserlukevich, Y., 2009. Taxation, agency conflicts, and the choice between callable and convertible debt. Journal of Economic
Theory 143, 374–404.
Hovakimian, A., Opler, T., Titman, S., 2001. The debt-equity choice. Journal of Financial and Quantitative Analysis 36, 1–24.
Jalan, P., Barone-Adesi, G., 1995. Equity financing and corporate convertible bond policy. Journal of Banking and Finance 19, 187–206.
Jensen, M.C., Meckling, W.H., 1976. Theory of the firm: Managerial behavior, agency costs and ownership structure. Journal of Financial
Economics 3, 305–360.
King, T.H.D., Mauer, D.C., 2012. Determinants of corporate call policy for convertible bonds. Journal of Corporate Finance (forthcoming).
Kraus, A., Brennan, M.J., 1987. Efficient financing under asymmetric information. Journal of Finance 42, 1225–1243.
Krishnaswami, S., Devrim, Y., 2008. The role of convertible bonds in alleviating contracting costs. Quarterly Review of Economics and Finance
48, 792–816.
Lee, H.W., Figlewicz, R.E., 1999. Characteristics of firms that issue convertible debt versus convertible preferred stock. Quarterly Review of
Economics and Finance 39, 547–563.
Lewis, C.M., Rogalski, R.J., Seward, J.K., 1998. Agency problems, information asymmetries and convertible debt security design. Journal of
Financial Intermediation 7, 32–59.
Lewis, C.M., Rogalski, R.J., Seward, J.K., 1999. Is convertible debt a substitute for straight debt or for common equity? Financial Management
28, 5–27.
Lewis, C.M., Rogalski, R.J., Seward, J.K., 2002. Risk changes around convertible debt offerings. Journal of Corporate Finance 8, 67–80.
Lewis, C.M., Verwijmeren, P., 2011. Security design and contract innovation. Journal of Corporate Finance 17, 809–831.
Lewis, C.M., Verwijmeren, P., 2013. Cash-settled convertible bonds and the value relevance of their accounting treatment. Journal of Corporate
Finance (forthcoming).
Lyandres, E., Zhdanov, A., 2013. Convertible debt and investment timing. Journal of Corporate Finance (forthcoming).
Mayers, D., 2000. Convertible bonds: Matching financial and real options. Journal of Applied Corporate Finance 13, 8–21.
Merton, R.C., 1974. On the pricing of corporate debt: The risk structure of interest rates. Journal of Finance 29, 449–470.
Myers, S., 1977. The determinants of corporate borrowing. Journal of Financial Economics 5, 147–175.
Nyborg, K.G., 1995. Convertible debt as delayed equity: Forced versus voluntary conversion and the role of call policy. Journal of Financial
Intermediation 4, 358–395.
Siddiqi, M.A., 2009. Investigating the effectiveness of convertible bonds in reducing agency costs: A Monte-Carlo approach. Quarterly Review of
Economics and Finance 49, 1360–1370.
Stein, J.C., 1992. Convertible bonds as backdoor equity financing. Journal of Financial Economics 32, 3–21.
Zeidler, F., Mark, M., Schiereck, D., 2012. Risk dynamics surrounding the issuance of convertible bonds. Journal of Corporate Finance 18,
Appendix
A. Calculation of RSI
We define the strike prices of convertible debt and equity based on reported face values, in line with Eom et al. (2004) and Bharath and Shumway (2008). Specifically, we set the strike price of equity and the strike price of the junior convertible debt equal to the face value of total debt, which we compute as the sum of reported long term debt and debt in current liabilities. We substract the face value of convertible debt to obtain the face value of the straight senior debt.
As illustrated in Kraus and Brennan (1987), the strike price of the conversion option embedded in the convertible bond can be computed based on the face value of debt and the dilution measure. Here, the dilution parameter, α, equals the percentage of shares, which would be held by convertible bondholders in case they exercise their conversion option and become new shareholders:
α = NNew
NOld+ NNew, (6)
where NNewis the number of new shares issued in case of conversion and NOldis the number of shares outstanding
be-fore conversion. Up to 1996, this ratio can be computed based on the data items common shares outstanding (CSHO) and common shares reserved for conversion from convertible debt (CSHRC). In 1996, Compustat discontinued the re-porting of CSHRC. For the subsequent firm-years, we account for the historical relation between CSHRC and CSHO, which is given by:
CSHRC = 0.8780 + 0.3309 # FC E
$
ws
CSHO, (7)
where the values 0.8780 and 0.3309 are the coefficient estimates a and b from the pooled linear regression
CSHRC(i,y)= a + b #F C,(i,y) E(i,y) $ ws CSHO + ε(i,y). (8)
the ratio FC/E is winsorized at the 99th percentile.13 The intuition underlying this estimation of CSHRC – which
corresponds to NNew – is as follows: NNew is defined as the number of new shares issued after conversion, and it is
equal to the face value of convertible debt divided by the conversion price. Our estimation implicitly assumes the conversion price to be equal to the current share price times a factor (1 + p). Then, NNew=FECN1+pOld, which we can
estimate using the regression described by Equation 8. This procedure is not only intuitively appealing, but also yields a high fit to the data. The adjusted R2of this regression equals 32.97%.14
Next, we calculate firm risk σV following the approach of Bharath and Shumway (2008), as follows:
σV =D VσD+
E
VσE, (9)
where D = FC+ FDand the volatility of debt equals
σD= .05 + .25σE, (10)
with an equity volatility σEcomputed as the annualized standard deviation of daily stock returns observed over the
252 trading days preceding the fiscal year-end date. While Bharath and Shumway (2008) call their measure “naive”, they show that it is highly correlated to the estimates of firm risk by Moody’s KMV and that, in combination with other parameters, it is a better predictor of default risk than alternative, common measures.
We then derive the time to debt maturity, T , as a face value-weighted average of debt with different maturities as follows. Using the Compustat items long-term debt due in year 1 to 5 (DD1through DD5), we first estimate the time to maturity of long-term debt as
TLT =0.5DD1+ 1.5DD2+ 2.5DD3+ 3.5DD4+ 4.5DD5 DLT + 10 ! 1 −DD1to5 DLT " . (11)
13This means that we set all values in the upper one percent of the distribution of F
C/E equal to the 99thpercentile. Doing so allows us to reduce
the number of outliers that are likely a result of erroneous data.
14Still, to some extent the estimation procedure remains arbitrary. It is therefore important to note that the risk-shifting measures computed based on this parameter are similar to those computed for the subsample for which CSHRC is given, and the one for which we must estimate it. The distribution of α is comparable for both subsamples, also. The averages of α calculated based on estimated and actual values of CSHRC equal 11.6% and 11.8%, respectively.
As reported by Barclay and Smith (1995), the Compustat items debt due in year one to five, DD1to5, appear to contain erroneous data as the ratio of DD1to5to total debt is sometimes larger than one and sometimes below zero. We follow their adjustment and require the ratio to lie between 10% and 110%. In case the ratio lies between 100% and 110%, we scale DD1to5 down by dividing it by the ratio itself. Observations outside of the acceptable range are ignored in the first step and then are assigned the average value of TLT. Based on TLT, we obtain T as:
T = TLT DLT
D + 0.5 DST
D , (12)
where DST is debt in current liabilities. Finally, for observations for which we were not able to compute a value, we
set T to the average T of the aggregate sample.
Based on T , we extract the risk-free rate r from interest rates on constant Treasury securities. To do so, we first construct yield curves using cubic spline interpolation for each event date in our sample and then obtain r as the risk-free rate observed on that date for maturity T .
Finally, we back out an estimate of asset value V from equity values assuming that the relation between equity value and firm value is correctly described by our pricing framework. Observing the value of equity and given all other pricing parameters except V , we can compute V numerically such that it solves Equation 2.15 Relative to the measure used in Eom et al. (2004) and Bharath and Shumway (2008), who set V equal to the market value of equity plus the book value of total debt, this yields more realistic values of V for firms closer to financial distress: Book values of debt are a particularly poor (upward-biased) proxy of the market value of debt for these firms. As pointed out previously, the incentive to shift risk is particularly relevant for such firms. Overstating V by overstating the value of debt would lead to a downward biased estimate of the value of risk-shifting. Calculating V as described allows us to avoid this bias.16
15This is comparable to computing implied option volatilities when all other pricing parameters and the price of an option are observed. 16On average, our estimates of V are 9.77% below the book value-based estimates.
B. Analysis of Announcement Effects
B.1. Event Date
The determination of the event date strictly follows the approach of Duca et al. (2012), who “assume that the public announcement of convertible debt offerings happens on the filing date obtained from SDC.” In footnote 12, Duca et al. state that they “manually cross-check the accuracy of the filing dates by verifying the actual announcement dates obtained from Factiva for 100 convertible bond issues.” The researchers find that the SDC and Factiva dates are identical for all 100 issues. Because their sample (January 1984 to December 2009) is almost the same as ours (January 1984 to December 2010), we rely on the same assumption.
As mentioned by Duca et al. (2012), the filing date is, however, only available for publicly placed convertible bond issues. In their sample, 754 of the 1,436 convertible debt issues were not publicly placed, which is consistent with the 50% proportion of our convertible issues for which SDC does not report a filing date. For the remainder of the convertibles, we manually look up the announcement date in Factiva, as suggested by Duca et al. (2012).
For 50 randomly picked post-1996 issues, we double-check the announcement date obtained from Factiva by looking for the earliest corresponding form on the SEC’s EDGAR system.17 For five of these private issues, we cannot find a corresponding report on EDGAR. For 43 issues, using EDGAR would have led to the exact same date as using Factiva. For the two remaining issues, the issue date in Factiva is one or two days earlier than the date in EDGAR.
B.2. Credit Spread Data
Our initial sample is identical to the main sample of 1,229 convertible debt announcements we use in the study of equity returns. Using names and CUSIP identifiers of the convertible issuer, we match this dataset to the TRACE (Trade Reporting and Compliance Engine) and the Mergent FISD (Fixed Income Securities Database) databases, from which we obtain trading data and information about bond characteristics, respectively. In a first step, we match 868 of the events to issuers for which trading data are reported in TRACE. In total, data for 2,397 bonds from these issuers is
17As noted on EDGAR’s website (http://www.sec.gov/edgar/aboutedgar.htm), “Companies were phased in to EDGAR filing over a three-year period, ending May 6, 1996. As of that date, all public domestic companies were required to make their filings on EDGAR, except for filings made in paper because of a hardship exemption.”
available from both TRACE and FISD. For a large part of these events, trading data is only available for convertible bonds. After discarding all 834 convertible debt issues, the number of events for which bond data is reported in FISD and TRACE falls to 376. A large portion of the remaining bonds were inactive as of the announcement date. That is, the remaining bonds either matured before the date or were issued afterwards. Dropping inactive observations leaves bond observations for 182 announcements. Given that corporate bonds are traded infrequently, this number falls further when we require the bonds to be traded during the event window, as described below.
B.3. Changes in Credit Spreads
In a first step, we calculate the yield spread for each bond trade by subtracting a maturity-matched, risk-free rate from the yield reported in TRACE.18 For each announcement date ADi, we then derive before- and
after-announcement reference dates RD as the dates for which trading data are reported in TRACE, and which are at least two, but no longer than five, days before or after the announcement date. If trades are reported on multiple days before and after the announcement, we use the dates that are closest to the announcement (but still not closer than two days). Thus, RDbe f ore= max(ADi− bi) and RDa f ter= min(ADi+ ai), where biand aiare between 2 and 5. This
procedure yields an average event window of 5.46 days. Increasing the length of the event window would increase the sample size, but would simultaneously yield more noisy estimates of announcement effects. Finally, we define our measure of the announcement effect on credit spreads as
ΔCSi= 1 Ni
Ni
∑
j=1%CSi, j,a f ter−CSi, j,be f ore& , (13)
where CSi, j,be f oreand CSi, j,a f terare the average credit spreads of all trades on bond j reported by the issuing firm i for
the RDbe f oreand RDa f ter. Niis the number of bond issues of firm i with available data.
C. Control Variables
• CD to Total Debt: Convertible debt scaled by total debt. The level of convertible debt is primarily based on Compustat item DCVT. For firms issuing convertibles more than once in the same fiscal period, we account for 18We obtain the risk-free rate from Treasury yield curves constructed using cubic spline interpolation, in the same way we did in Subsection 3.3.1. The maturity used to obtain the risk-free rate is equal to the time between the TRACE trading date and the bond maturity reported in FISD.
the potential impact of previous issues on the capital structure of the firm. Total debt is the sum of long-term debt and debt in current liabilities (Compustat Items (DLTT + DLC)).
• Leverage: Total debt (Compustat items DLTT + DLC) scaled by the sum of total debt and the market value of equity (CRSP items PRC × SHROUT).
• Log MB: The natural logarithm of the ratio of market and book value of equity, where market values are taken from CRSP and the book value of equity equals Compustat item SEQADJ.
• Stock Return Volatility: The annualized standard deviation of monthly stock returns reported in CRSP of up to 10 years before the event. We require at least 12 months of data.
• Nasdaq Listing: Dummy indicating Nasdaq listing. Equals one when Compustat item EXCHG is 14, and zero otherwise.
• Firm Size: The natural logarithm of the sum of the market value of equity (CRSP items PRC × SHROUT) and total debt (Compustat items DLTT + DLC) in millions.
• Tangibility: Plant property and equipment scaled by the book value of assets (Compustat items PPEGT / AT).
• R&D Intensity: R&D expenditure scaled by sales (Compustat items XRD / SALE).
• Amihud Liquidity: Average of the ratio of absolute daily returns and daily trading volume observed during 12 months. We multiply the measure by 106for displaying purposes and require at least three months of data.
• Dividend Paying: Dummy indicating whether a firm pays dividends. The dummy is set to one when Compustat item DVC is above zero.
• Dividend Paying: Dummy indicating whether a debt issue is made under Rule 144a.
• Financial Distress: π = T LMTA∗−NIMTAAV G∗−CASHMTA∗+MB∗−RSIZE∗−PRICE∗−EXRETAV G∗+
SIGMA∗. The variables entering the calculation are identified by Campbell et al. (2008) as the most powerful predictors of corporate default. Specifically, NIMTAAV G, T LMTA, and CASHMTA measure net income, li-abilities and cash holdings relative to an estimate of the market value of assets, respectively. EXRETAV G is
the stock’s 12 months excess return over the S&P500; SIGMA measures equity volatility; RSIZE is the market value of equity relative to the total market value of the S&P500; MB is the market-to-book ratio, and PRICE is the stock price truncated at 15. In line with Campbell et al. (2008), we winsorize all variables at the 5th and
95thpercentile of their distribution. The star∗indicates that we normalize each of the variables by subtracting their mean and dividing by their standard deviation. For further details on the derivation of these variables, see Campbell et al. (2008).
• Secured Debt: Secured long-term debt scaled by total long-term debt (Compustat item DM / DLTT).
• Proceeds: Issue proceeds as reported in SDC Platinum scaled by the sum of total debt (Compustat items DLTT + DLC) and the market value of equity (CRSP items PRC × SHROUT).
• Debt Maturity: Corresponds to the parameter T used to compute RSI and described previously.
• Regulated Industries: Our sample of firms in regulated industries includes all firms with an SIC code from 4810 to 4899, 4910 to 4924, and 4930 to 4941.
• CEO Ownership: Number of shares owned by the CEO scaled by total shares outstanding. Obtained directly from the Compustat ExecuComp database (item SHROWNEXCLOPTSPCT).
• SP500 Return: Return on the S&P 500 index over a 12-month window. Obtained from CRSP.
• Interest Rate: Interest rate on 10-year constant maturity Treasuries. Obtained from the Federal Reserve Bank reports.
• Baa Credit Spread: Average Moody’s Baa corporate bond yield minus the yield on 10-year constant maturity Treasuries. Obtained from the Federal Reserve Bank reports.
• Leading Indicator: Conference Board Leading Economic Indicator obtained from Datastream. It is computed from the following components: the average weekly hours worked by manufacturing workers, the average num-ber of initial applications for unemployment insurance, the amount of manufacturers’ new orders for consumer goods and materials, the speed of delivery of new merchandise to vendors from suppliers, the amount of new or-ders for capital goods (excluding aircraft oror-ders), the amount of new building permits for residential buildings,
the S&P 500 stock index, a credit index, consumer sentiment, and the spread between long and short interest rates.
List of Figures
1 Payoff Diagrams . . . 31
2 Risk-shifting incentives . . . 32
3 Market reaction to security issuances by level of risk-shifting incentives . . . 33
Figure 1: The figure shows payoff (solid lines) and value (dashed lines) of equity (black), straight senior debt (dark grey), straight junior debt (light
grey, upper right) and convertible debt (light grey, lower graphs) as a function of firm value for four different capital structures. The parameters are r=.05, σV=.4, T =1, FS= 45 (upper left graph), FS,sen= 30, FS, jun= 15 (upper right graph), FC= 45, α = .35 (lower left graph), FS,sen= 50,
Figure 2: The figure displays our measure of risk-shifting incentives, RSI, in dollar terms (left graph) and relative terms (right graph). Solid
(dashed) lines represent equity value in a firm financed only with straight debt (with straight and convertible debt). The difference between the two is the reduction in risk-shifting incentives induced by convertible debt. The parameters are: σ = .4, κ=.05, α =.35, r = 0.05, and T =4.
Figure 3: This figure displays the average announcement effect of security issuances on three-day buy-and-hold abnormal returns (BHARs) and
yield spread changes in the upper and lower panels, respectively. Results on convertible debt issues (left panels) are compared with those for straight debt issues (right panels). The average effects are reported by quintiles of risk-shifting incentives (RSI).