HAL Id: hal-02390900
https://hal.archives-ouvertes.fr/hal-02390900
Submitted on 9 Dec 2019
HAL is a multi-disciplinary open access
archive for the deposit and dissemination of
sci-entific research documents, whether they are
pub-lished or not. The documents may come from
teaching and research institutions in France or
abroad, or from public or private research centers.
L’archive ouverte pluridisciplinaire HAL, est
destinée au dépôt et à la diffusion de documents
scientifiques de niveau recherche, publiés ou non,
émanant des établissements d’enseignement et de
recherche français ou étrangers, des laboratoires
publics ou privés.
On the usage of visual saliency models for computer
generated objects
Mona Abid, Matthieu Perreira da Silva, Patrick Le Callet
To cite this version:
Mona Abid, Matthieu Perreira da Silva, Patrick Le Callet. On the usage of visual saliency models for
computer generated objects. 2019 IEEE 21st International Workshop on Multimedia Signal Processing
(MMSP), Sep 2019, Kuala Lumpur, Malaysia. pp.1-5, �10.1109/MMSP.2019.8901782�. �hal-02390900�
On the usage of visual saliency models for
computer generated objects
Mona Abid, Matthieu Perreira Da Silva and Patrick Le Callet
Image Perception Interaction (IPI)Nantes University, LS2N, CNRS, UMR 6004 Nantes, France
{mona.abid, matthieu.perreiradasilva, patrick.lecallet} @univ-nantes.fr
Abstract—Visual attention is a key feature to optimize visual experience of many multimedia applications. 2D visual attention computational modeling is an active research area considering the visualization of natural images on a conventional display. In this paper, we question the ability of such models to be applicable to single computer-generated objects rendered at different sizes (on a conventional display). We benchmark state of art visual attention models and investigate the influence of the viewpoint on those computational models applied on volumetric data and this to get a better understanding of how viewpoint information could be integrated into view-based approaches. To do so, a subjective experiment was conducted and a fine analysis was led using the variance analysis statistical method.
Index Terms—Visual attention models, perception, computer generated objects, computer vision.
I. INTRODUCTION AND PROBLEM STATEMENT
With the emergence of immersive imaging, understanding human visual attention mechanisms is of great importance when optimizing the quality of visual experience.
Such mechanism indicates the regions attracting the human gaze. Generally, visual saliency models aim to predict human fixations as a way to detect saliency [1], [2]. This modeling gives not only an insight into the complex human visual system, but also shows much potential in the wide range of applications using computational saliency such as compression [3], objects segmentation [4], selective rendering [5], visual tracking [6], etc.
In this paper, we are interested in how visual attention is deployed on single computer generated (CG) objects. As user’s interaction is possible in immersive environments, the viewing distance (i.e. distance from which a CG object is seen) is more likely to change leading to a change of the covered visual angle. The viewing distance variation affects not only the perceived levels of details (during the rendering) but also the visual exploration of the perceived object.
–
Visual saliency [7] is the distinct subjective perceptual quality which makes some items in the world stand out from their neighbors and immediately grab our attention. In other words, our attention is attracted to visually salient stimuli.
The field of visual attention computational modeling has bloomed the last two decades reaching impressive results in 2D imaging. Nevertheless, one should carefully examine the conditions on which these models were validated before naively applying them in another context. In fact, most of these computational models have been validated using eye tracking data obtained in fixed conditions (e.g. image displayed on a screen and seen in a fixed viewing field). As a matter of fact, the viewing information is not included as a parameter neither in the annotated datasets (used to train models) such as MIT300 [8], CAT 2000 [9] that were established for the MIT saliency Benchmark (saliency.mit.edu) nor in the computational models themselves.
–
Since the few existing 3D models consider geometry informa-tion only without texture or shading [10], applying them in an immersive environment is very restricted (because of the lack of texture for example).
On the other hand, several promising 2D models [11] that showed high performances could be applied in the immersive context by considering 2D projection views of 3D data, rendered by a specific rule. This would allow to compute visual attention and therefore indicate the regions attracting human gaze. Investigating the impact of viewing distance when con-sidering rendered CG objects could help us understand the influence of such parameter on human gaze and therefore give us an insight of how to integrate this parameter in view-based models to adapt the latter to immersive imaging.
In this work, different CG contents were displayed on a monitor screen with HD resolution. Its typical visual acuity at standardized viewing distance is around 60 pixel/degree. The reason behind contents’ visualization on a conventional display in this preliminary work is to respect the recommended visual acuity. In fact, when it comes to devices used in immersive experiments (i.e. Head Mounted Displays (HMDs)), their corresponding fields of view changes according to their embedded characteristics. This might lead to a different human perceptual experience. Typical visual acuity at standardized viewing distance of a common VR HMD device is around 15 pixel/degree for the HTC vive and 30 pixel/degree for the HTC vive Pro.
II. EYE-TRACKING EXPERIMENT
A. Stimuli generation - Dataset establishment
We designed an experimental protocol to collect gaze data for our research context. Different stimuli have been generated from original CG objects with different shapes, aspect ratio and properties (brightness, richness of details, colorfulness, etc). Our dataset aims to provide a comprehensive and diverse coverage of objects in terms of visual angle for eye-tracking analysis.
CG objects were rendered by considering a specific viewpoint using Unity software. By varying the visual angle and the viewing distance, we could generate diverse rendered objects from a visual attention deployment perspective. For each CG object, we selected an appropriate viewpoint. Afterwards, three scale variants were considered leading to a change of the level of details and occlusion as shown in figure 1. Rendered CG objects were systematically displayed in the center of the monitor screen with a gray background.
Fig. 1. Three variants of the same CG object as rendered in our experiment (the bounding-box in red was not displayed but serves the discussion section III-A).
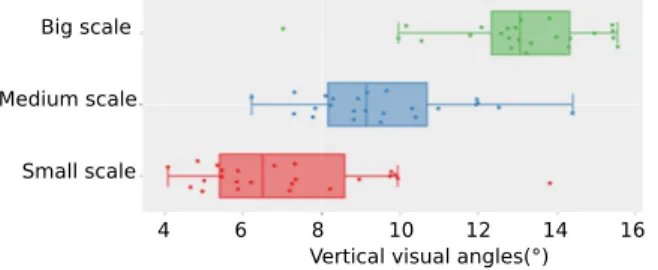
To show the overall difference between semantic scales, me-dian and standard deviation were computed according to the vertical visual angle using box plots as illustrated in figure 2.
Big scale Medium scale
Small scale
4 6 8 10 12 14 16 Vertical visual angles(°)
Fig. 2. Semantic scales boxplot along vertical visual angles.
In total, we considered 72 rendered objects (24 CG objects × 3 size variants).
B. Experimental protocol
We limited this study to rendered objects visualization in HD standardized viewing conditions. In such conditions, rendered objects were presented on a display with native resolution of 1920 × 1080 pixels and frame rate 60fps. It covers 30◦ of visual field horizontally and 17◦ vertically.
The 72 rendered objects covered visual angle ranges of [2◦, 25◦] horizontally and [4◦, 16◦] vertically.
A remote EyeLink 1000 Plus eye-tracker [12] by SR research
was used for data collection, with a 1000Hz sampling rate and a gaze position average accuracy between 0.25◦ and 0.5◦. Thirty university students with normal/ corrected-to-normal vision participated. Non-familiar to eye-tracking experiments, these participants were instructed to explore the image content without any specific task (free-viewing). Every participant attended one session composed of 3 series of 12 stimuli (i.e. 2D views of CG objects) presented in random order.
Each stimulus was displayed for 3 seconds which is sufficient to cover both bottom-up and top-down visual attention behav-iors in a balanced manner.
Calibration was performed before each series. This helped align the gaze data and the display time together in addition to verifying the calibration state of the eye-tracker. To reduce eventual memory effect, each observer can see at maximum 2 scale variants of the same object.
Raw gaze data recorded via the eye-tracker includes saccades, fixations and blinks. Fixations were extracted using specific algorithms [12] allowing to derive ground-truth saliency maps for each object.
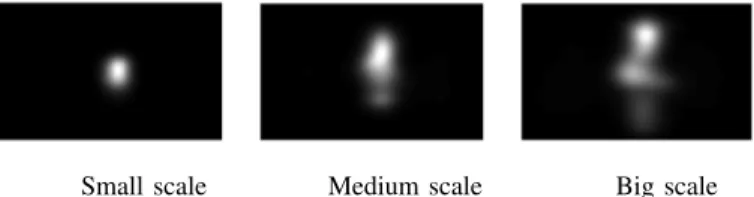
In order the get the saliency map corresponding to every stimulus, a Gaussian distribution with σ = 1◦was applied on fixation points (to take spatial uncertainty into consideration). The obtained saliency maps are displayed in figure 3.
Small scale Medium scale Big scale
Fig. 3. Ground-truth saliency maps of the computer generated object presented in Fig.1
III. DATAANALYSIS
Among best models according to the performances of current state-of-the-art [13] : SALICON [14], SAM Vgg [15], SAM resnet [15], GBVS [16]. Most of these models are based on deep learning architectures.
A. Adapting metrics usage on rendered CG objects
As we are investigating visual attention deployment on single objects, one should consider the visual information of the CG content. Since rendered CG views were shown to subjects on a monitor screen with HD resolution, saliency models were given the same rendering format.
Afterwards, a bounding-box corresponding to the CG object content (see red box figure 1) was considered for saliency eval-uation (when using metrics). Note that without this processing, usual figure of merit of visual attention models (i.e. metric measurements) would be highly biased due to the content-free background. For this reason, when evaluating saliency maps using metric measurements, cropping was applied on both ground-truth saliency maps (derived from the eye-tracking ex-periment) and computed saliency maps (derived from saliency models). This limits the agreement between the model output
and the considered ground-truth to the bounding-box. Since the CG object sizes are different, the cropping window size changes from rendering to another as well as the excited visual angle by observers (cf. figure 1). In other words, the applied cropping window on a given computed saliency map and its corresponding ground-truth are directly related to the CG object size once rendered.
B. Comparing the output of visual attention model with ground-truth saliency map
To measure the ability of visual attention model to predict ground-truth, many metrics have been introduced in the liter-ature, but they do not necessarily provide consensual results [17], [18]. Following these recent results, we adopt for our analysis two widely accepted and standard metrics: Kullback-Leibler Divergence (KLD) [19] and Normalized Scanpath Saliency (NSS) [20] metrics. This choice is also motivated by the fact that a pre-analysis of our data revealed that these two metrics were more sensitive to the visual angle change than the others.
KLD metric measures the dissimilarity degree between pre-dicted and ground-truth saliency maps both seen as probability density functions. The lower measurement value is, the better performance a saliency model has. Whereas NSS metric involves saliency map and a set of fixations. Note that this metric is used exclusively for saliency evaluation. The idea is to measure saliency values at fixation locations along the observers scanpath. The higher NSS value is, the better the saliency model is.
As already mentioned, images given as input to computational models include both bounding-box and content-free back-ground to ensure the same stimuli format shown to observers. Once saliency maps computed, all metrics were evaluated for each stimulus on its cropped window.
Figure 3 illustrates the ground-truth saliency map of the stimuli presented in figure 1. Whereas figure 4 shows the computed saliency map using SALICON model of the same stimuli.
Small scale Medium scale Big scale
Fig. 4. Computed saliency maps using SALICON model of the computer generated object presented in Fig.1
C. Human agreement consideration
The so called ground-truth is the result of the pooling of limited observations, e.g the number of observers, to derive a saliency map. It naturally contains uncertainty as all the observers are not gazing the same. In [21] and [22] methods have been introduced to capture this uncertainty to estimate the coherence, dispersion, congruence or also called agreement between observers. Such indicator can be used to interpret the
performance metric of visual attention model with respect to observers disagreement. In this paper, we adopt the method in [22]. The KLD (or NSS) is computed between the saliency map coming from one observer and the saliency map coming from global human (average human observer). This is iterated over the set of all observers per object. All KLD values (or NSS) are then averaged leading to the estimate of the dispersion-disagreement (DIS) between observers for each object referred as DISmetric in this formula (metric being
either KLD or NSS): DISmetric= 1 n n X i=1 metric(obsi, GT ) (1) In the case of KLD metric, a high value indicates that the visual strategies of observers are different and a low value indicates that the visual attention strategies of observers are quite similar. On the contrary, for NSS metric, a high value indicates that the visual strategies of observers are quite similar and a low value indicates that the visual attention strategies of observers are different. The lower bound is zero and is obtained only if all the observers look at the same set of locations during the same viewing duration.
As this value is the result of a set of limited observations (30 observers), we propose to add the uncertainty on the dispersion-disagreement estimate.
To that end, we estimate 95% Confidence Interval of DIS reflecting the interval of the real DIS value if we had an infinity of observers. In this paper, we assume that metric(obsi, GT ) follows a normal distribution so CI95%
can be derived from standard error.
For KLD metric we consider upper-bound as a baseline: if the KLD value of a model falls bellow the upper-bound baseline (DISKLD+ CI95%,KLD) suggests that the model
is performing below the uncertainty of the ground-truth. On the contrary, for NSS metric lower-bound was considered as the baseline. A model has an accepted performance if NSS value is above this lower-bound (DISN SS−CI95%,N SS).
IV. RESULTS AND DISCUSSION
An evaluation of view-based saliency models’ performance in the context of CG contents (i.e. 2D views taken from a certain viewpoint of CG 3D objects and not natural scenes) was conducted with respect to human disagreement (cf. section IV-A). Moreover, an analysis of variance based on size change and therefore viewing distance variation was considered using KLD and NSS metrics (cf. section IV-B).
A. Model performance with respect to ground-truth uncer-tainty
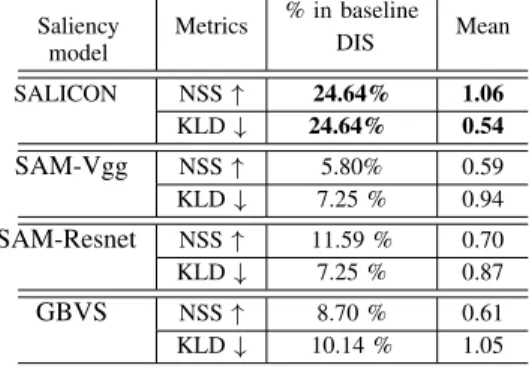
For each saliency model and each metric (KLD and NSS), we report in table I:
• % in baseline DIS: the percentage of objects for which the model succeeds to reach the DIS baseline.
• Mean:the average metric value (KLD or NSS) including the objects that fails to meet the baseline DIS.
TABLE I
METRIC MEASUREMENT FOR DIFFERENT MODELS
Saliency model Metrics % in baseline DIS Mean SALICON NSS ↑ 24.64% 1.06 KLD ↓ 24.64% 0.54 SAM-Vgg NSS ↑ 5.80% 0.59 KLD ↓ 7.25 % 0.94 SAM-Resnet NSS ↑ 11.59 % 0.70 KLD ↓ 7.25 % 0.87 GBVS NSS ↑ 8.70 % 0.61 KLD ↓ 10.14 % 1.05
As shown in table I, according to a given metric (e.g. NSS): SALICON model shows the highest percentage in terms of the baseline DIS’s values and in terms of the computed mean value.
The benchmark between different state-of-the-art saliency models showed that SALICON is the most suitable saliency model (without fine-tuning or model re-training ) in the context of CG contents’ saliency prediction.
The relatively overall low scores (compared to model perfor-mances on the MIT saliency benchmark) could be explained by the fact that CG contents are different from natural scenes on which deep learning models were trained. Note that these performances could be improved by fine-tuning saliency mod-els.
B. Viewing distance impact on computational saliency models Depending on the viewing distance, the viewpoint is more likely to change according to the user’s interaction with the objects held in the immersive scene. In order to study the im-pact of the viewing distance on saliency models in the context of CG objects, a statistical analysis of variance (ANOVA) was considered in order to evaluate if the dependency between a given model and the image size content is statistically significant or not.
According to the computed p-values for a given model and different metrics, it is possible to explain information diversity cause when considering 3 scales and this by getting the statistical significance. Table II synthesizes the outputs of the ANOVA including p-values and f ratios. The former indicates if there is a statistical significance between group means and the latter determines whether the variability between group means is larger than the variability of the observations within the groups.
Based on table II, we can get information about the sensitivity of the saliency models to the stimuli’ scales. For a given metric and a given saliency model, the higher f ratio is the more metrics values change according to the stimuli size (for a same CG object). In fact, if the saliency model takes implicitly the stimulus size of a given object, it would keep almost the performances and there would not be a statistical significance in metric values.
TABLE II
OVERALLANOVAOUTPUT VALUES FORKLDANDNSSMETRICS
Saliency model
Metrics p-value Statistical significance f ratio Salicon NSS 0.0461 X 3.22 KLD 0.0134 X 4.59 SAM-Vgg NSS 0.0062 X 5.47 KLD 0.0011 X 7.54 SAM-Resnet NSS 0.0670 7 – KLD 0.0008 X 7.91
As a result, the evaluated saliency models are not robust to stimuli size change. Moreover, when we consider the small scale of CG object, saliency models have slightly better scores than for medium and big scales. This might be due to the small comparison’s area that leads to small possibility of miss-prediction. This interpretation corresponds to salient regions displayed in figure 3 and figure 4 when compared.
V. CONCLUSION AND PERSPECTIVE
Lately, human interaction in 3D immersive scenes has been an active research topic. Many efforts have been made to understand and predict where humans look to such CG contents. In fact, CG objects are perceived differently from natural scenes on which saliency models were trained and tested. A comparative study was conducted with a subjective experiment to evaluate the most suitable saliency model in the context of CG contents. Moreover, the perceptual impact of the viewpoint on saliency models was investigated as preliminary work.
For future work, re-training deep learning models on CG dataset and adequate fine-tuning will be considered.
Moreover, additionally to viewing distance, the impact of the viewing angle will be investigated in the context of immersive imaging.
ACKNOWLEDGMENT
This research is supported by French National Research Agency ANR in the PISCo (Perceptual Levels of Detail for Interactive and Immersive Remote Visualization of Complex 3D Scenes) project context.
REFERENCES
[1] A. Borji, D. N. Sihite, and L. Itti, “Quantitative analysis of human-model agreement in visual saliency human-modeling: A comparative study,” IEEE Transactions on Image Processing, vol. 22, no. 1, pp. 55–69, Jan 2013.
[2] A. Borji and L. Itti, “State-of-the-art in visual attention modeling,” IEEE Transactions on Pattern Analysis and Machine Intelligence, vol. 35, no. 1, pp. 185–207, Jan 2013.
[3] H. Hadizadeh and I. V. Baji´c, “Saliency-aware video compression,” IEEE Transactions on Image Processing, vol. 23, no. 1, pp. 19–33, 2013. [4] S. J. Oh, R. Benenson, A. Khoreva, Z. Akata, M. Fritz, and B. Schiele,
“Exploiting saliency for object segmentation from image level labels,” in 2017 IEEE Conference on Computer Vision and Pattern Recognition (CVPR). IEEE, 2017, pp. 5038–5047.
[5] L. Dong, W. Lin, C. Zhu, and H. S. Seah, “Selective rendering with graphical saliency model,” in 2011 IEEE 10th IVMSP Workshop: Perception and Visual Signal Analysis. IEEE, 2011, pp. 159–164.
[6] C. Avytekin, F. Cricri, and E. Aksu, “Saliency enhanced robust visual tracking,” in 2018 7th European Workshop on Visual Information Processing (EUVIP). IEEE, 2018, pp. 1–5.
[7] L. Itti, “Visual salience,” Scholarpedia, vol. 2, no. 9, p. 3327, 2007, revision #72776.
[8] T. Judd, F. Durand, and A. Torralba, “A benchmark of computational models of saliency to predict human fixations,” in MIT Technical Report, 2012.
[9] A. Borji and L. Itti, “Cat2000: A large scale fixation dataset for boosting saliency research,” CVPR 2015 workshop on ”Future of Datasets”, 2015, arXiv preprint arXiv:1505.03581.
[10] G. Lavou´e, F. Cordier, H. Seo, and M.-C. Larabi, “Visual attention for rendered 3d shapes,” Comput. Graph. Forum, vol. 37, pp. 191–203, 2018.
[11] A. Borji, “Saliency prediction in the deep learning era: An empirical investigation,” 10 2018.
[12] “Eye tracking with the eyelink eye trackers - sr research ltd.” [Online]. Available: https://www.sr-research.com/
[13] Z. Bylinskii, T. Judd, A. Borji, L. Itti, F. Durand, A. Oliva, and A. Torralba, “Mit saliency benchmark.”
[14] M. Jiang, S. Huang, J. Duan, and Q. Zhao, “Salicon: Saliency in context,” in 2015 IEEE Conference on Computer Vision and Pattern Recognition (CVPR), June 2015, pp. 1072–1080.
[15] M. Cornia, L. Baraldi, G. Serra, and R. Cucchiara, “Predicting human eye fixations via an lstm-based saliency attentive model,” IEEE Trans-actions on Image Processing, vol. 27, no. 10, pp. 5142–5154, Oct 2018. [16] J. Harel, C. Koch, and P. Perona, “Graph-based visual saliency,” in Advances in neural information processing systems, 2007, pp. 545–552. [17] Z. Bylinskii, T. Judd, A. Oliva, A. Torralba, and F. Durand, “What do different evaluation metrics tell us about saliency models?” IEEE transactions on pattern analysis and machine intelligence, vol. 41, no. 3, pp. 740–757, 2018.
[18] M. Kummerer, T. S. Wallis, and M. Bethge, “Saliency benchmarking made easy: Separating models, maps and metrics,” in Proceedings of the European Conference on Computer Vision (ECCV), 2018, pp. 770– 787.
[19] O. Le Meur and T. Baccino, “Methods for comparing scanpaths and saliency maps: strengths and weaknesses,” Behavior research methods, vol. 45, no. 1, pp. 251–266, 2013.
[20] R. J. Peters, A. Iyer, L. Itti, and C. Koch, “Components of bottom-up gaze allocation in natural images,” Vision research, vol. 45, no. 18, pp. 2397–2416, 2005.
[21] A. Torralba, A. Oliva, M. Castelhano, and J. Henderson, “Contextual guidance of eye movements and attention in real-world scenes: the role of global features in object search,” Psychological review, vol. 113, no. 4, 2006.
[22] O. Le Meur, D. Barba, P. Le Callet, and D. Thoreau, “A human visual model-based approach of the visual attention and performance evaluation,” in Human Vision and Electronic Imaging X, vol. 5666. International Society for Optics and Photonics, 2005, pp. 258–267.