HAL Id: hal-01609026
https://hal.archives-ouvertes.fr/hal-01609026
Submitted on 2 May 2018
HAL is a multi-disciplinary open access
archive for the deposit and dissemination of
sci-entific research documents, whether they are
pub-lished or not. The documents may come from
teaching and research institutions in France or
abroad, or from public or private research centers.
L’archive ouverte pluridisciplinaire HAL, est
destinée au dépôt et à la diffusion de documents
scientifiques de niveau recherche, publiés ou non,
émanant des établissements d’enseignement et de
recherche français ou étrangers, des laboratoires
publics ou privés.
Effect of Operating Parameters and Moisture Content
on Municipal Solid Waste Pyrolysis and Gasification
Jun Dong, Yong Chi, Yuanjun Tang, Mingjiang Ni, Ange Nzihou, Elsa
Weiss-Hortala, Qunxing Huang
To cite this version:
Jun Dong, Yong Chi, Yuanjun Tang, Mingjiang Ni, Ange Nzihou, et al.. Effect of Operating
Pa-rameters and Moisture Content on Municipal Solid Waste Pyrolysis and Gasification. Energy and
Fuels, American Chemical Society, 2016, 30 (5), pp.3994-4001. �10.1021/acs.energyfuels.6b00042�.
�hal-01609026�
Effect of Operating Parameters and Moisture Content on Municipal
Solid Waste Pyrolysis and Gasification
Jun Dong,
†,‡Yong Chi,
*
,†Yuanjun Tang,
†Mingjiang Ni,
†Ange Nzihou,
‡Elsa Weiss-Hortala,
‡and Qunxing Huang
††State Key Laboratory of Clean Energy Utilization, Zhejiang University, Hangzhou, Zhejiang 310027, People’s Republic of China ‡Centre RAPSODEE, UMR CNRS 5302, Mines Albi, Université de Toulouse, Campus Jarlard, F-81013 Albi Cedex 09, France
ABSTRACT: Pyrolysis/gasification-based waste-to-energy (WtE) techniques, comprising partial oxidation of waste and subsequent syngas combustion, show potential benefits over direct incineration. To facilitate their development under the specific conditions of China, pyrolysis and gasification of typical municipal solid waste (MSW) are investigated in a fluidized bed reactor. The effect of the equivalence ratio (ER), reaction temperature, and moisture content on MSW conversion is studied. A rising ER increases the syngas yield but decreases the syngas heating value. The combustible gas yield is strengthened at lower ERs and later drops when the ER exceeds 0.4 as a result of the continuously enhanced oxidation reactions. A higher temperature favors pyrolysis reactions but causes an evident decrease in the syngas heating value during gasification. When the ER is at 0.4 and the temperature is at 650 °C, an optimum operating performance is obtained under the specific input simulated MSW (S-MSW) and test conditions, with an energy conversion efficiency of 68.5%. Under such a circumstance, the further increase of the MSW moisture content is effective for stimulating H2production; nevertheless, the quality of syngas degrades, and the energy
conversion efficiency declines. The appropriate MSW moisture content is found to be lower than 20−25%. Besides, emiessions, such as heavy metals and dioxins, are also compared to conventional incineration to verify the environmental feasibility of gasification.
1. INTRODUCTION
With a booming social economy, the rapid generation of municipal solid waste (MSW) and its proper treatment have become one of the most critical challenges for both the government and the general public. It is well-recognized that MSW contains a high proportion of combustible components, and more attention has been paid to use MSW as a biomass for energy recovery. Over the past few decades, incineration has played a gradually rising role in waste management as a result of the advantages of significant waste volume reduction, complete disinfection, and energy recovery.1However, its broader spread is still restricted, owing to the harmful emissions, especially those of dioxins and acidic gases (SO2, NOx, HCl, etc.).2
Besides, excessive corrosion by HCl has limited the maximum steam superheater temperature and, thus, led to relatively low energy efficiency. With the realization of these facts, a more energy-efficient and environmentally sound MSW thermal technique is in urgent demand.
As a novel waste-to-energy (WtE) process, MSW pyrolysis or gasification exhibits several potential benefits over traditional incineration and has received significant attention in recent years.3It is defined as the thermochemical conversion of MSW to combustible products in the absence of oxygen (pyrolysis) or in partial combustion conditions (gasification). In comparison to “single-step” incineration, a pyrolysis/gasification-based WtE technique, i.e., “two-step oxidation”, makes it possible to decrease dioxins and NOxemission as a result of the reducing
atmosphere4 and the gaseous products could be cleaned to remove contaminants prior to the subsequent combustion. Moreover, the homogeneous gas−gas oxidation taking place in the combustor is much easier to control, thus allowing for the
reduction of excess air and increasing the overall plant efficiency.5Basically, this second step has been well-developed;
nevertheless, the pyrolysis or gasification step remains as a core challenge of this technique. Obviously, the quality of the products coming to the downstream combustion chamber depends upon a good operation of the gasifier.6In this context, a deeper understanding of an energy-efficient pyrolysis/ gasification conversion process becomes essential to better develop the “two-step” WtE technique.
However, the operating experience of MSW pyrolysis and gasification plants is quite limited worldwide to date; its industrial application in China has not yet been achieved. It is proven that the pyrolysis and gasification processes are crucially affected by the oprational variables and feedstock properties. For instance, a high MSW moisture content might obviously reduce the reaction temperature and degrade the gasification performance,7 while the equivalence ratio (ER) and temper-ature are important factors that define the tar yield and composition of syngas.6In China, MSW is dominated by high
organic and moisture contents and a low calorific value. Because the MSW characteristics differ significantly from western countries, it is meaningful to investigate the perform-ance of MSW pyrolysis and gasification under the local conditions of China. Especially, the key operating parameters, such as the temperature, ER, and moisture content, should be optimized, and the environmental emissions need to be
examined to facilitate a good and feasible gasification process that is adaptable to China.
Over the past few years, increasing studies on MSW pyrolysis and gasification emerged using different types of reactors, including a fixed bed,2,8,9a fluidized bed,10−12a rotary kiln,13an entrained flow,14and a plasma furnace.15Among these facilities, a fluidized bed is particularly attractive for MSW characteristics in China. Because of the uniform temperature distribution and intense mixing of gas and solids,16a fluidized bed is effective to handle highly heterogeneous or wet fuels. Using a fluidized bed, Xiao et al.17investigated the effect of the ER, bed height, and
fluidization velocity on the gasification of plastic, observing that the ER has the most pronounced effect on syngas production. Ni et al.18revealed the reactive courses and mechanism for the
pyrolysis and gasification of wood waste. Guo et al.19designed a utilization approach for the gasification of wet biomass and determined the optimal condition to maximize the syngas heating value and efficiency. Nevertheless, most of these studies are mainly focused on the use of a single component of MSW; research on mixed components from MSW is still quite lacking.20 On the other hand, to clarify the performance of
mixed MSW, previous works are mostly based on theoretical simulation;20−22experimental studies are rarely assessed. In this sense, pyrolysis and gasification of the most typical mixed MSW are of great significance.
Accordingly, in the present study, pyrolysis and gasification of mixed MSW are experimentally studied in a fluidized bed. The influence of the ER, reaction temperature, and MSW moisture content on products distribution, syngas properties, and energy conversion efficiency is studied. The principle aim is to identify an energy-efficient condition of pyrolysis and gasification under the specific situation of China. Besides, emissions are also compared to conventional incineration to further test the environmental performance of gasification. This knowledge would assist in assessing the potential of pyrolysis/ gasification as a WtE pathway for energy recovery from MSW and provide scientific experience to facilitate the future developing energy-efficient and technically feasible MSW thermal technique.
2. EXPERIMENTAL SECTION
2.1. MSW Characteristics. To ensure the homogeneity of the feedstock in each test, a synthetic, simulated MSW (S-MSW) is used. The S-MSW is prepared in accordance with the annual statistical waste composition in Hangzhou, China.23It is composed of food waste (29 wt % rice and 29 wt % cabbage), cardboard (13 wt %), plastic (17 wt % polyethylene and 3 wt % polyvinyl chloride), textile (2 wt %), timber (5 wt %), and rubber (2 wt %). The major combustible components are considered, and the mineral fraction is represented by the silica sand used as bed material in the furnace. The S-MSW is crushed and sieved into sizes of approximately 2 mm and then dried at 85 °C for 24 h. The characteristics of the S-MSW are shown inTable 1. The moisture content of the S-MSW is 9.2%. To further investigate the effect of moisture, distilled water is then added to the sample to obtain the required moisture content in the S-MSW.
2.2. Test Facilities and Procedures. A schematic diagram of the experimental apparatus is depicted in Figure 1. It is a lab-scale continuously fed fluidized bed reactor, equipped with a cyclone separator as a flue gas cleaning unit. The effective height of the reactor is 1100 mm with an inner diameter of 60 mm. A three-stage alloy resistance wire is used to externally heat the furnace. Three K-type thermocouples are employed to monitor the temperature profile at the top, middle, and bottom of the furnace, respectively. To prevent tar condensing from the flue gas, a heating tape is installed in front of the sampling point to maintain the temperature above 300 °C. Silica sand,
sieved to a size fraction of 0.28−0.45 mm, is used as bed material. The S-MSW is continuously fed into the furnace by a speed-adjustable screw feeder. In each test, the fluidization velocity (Um) is kept
constant at 0.18 Nm s−1, which is 1.5 times the minimum fluidization velocity (Umf). Air and N2act as gasifying agents for gasification and
pyrolysis processes, respectively; they are controlled by valves from the bottom of the furnace. The total inlet gas in each test is kept the same at 2 Nm3 h−1, so that the S-MSW residence time in the furnace is
approximately 6 s. The S-MSW feeding rate is set as a variable and calibrated beforehand by a range of screw speed tests.
The effect of the ER, temperature, and S-MSW moisture content is investigated. The ER is defined as the actual air supply to the stoichiometric air required for complete combustion. A temperature series of 550, 650, 750, and 850 °C is chosen, and ER under each temperature varies from 0 to 0.8 (ER = 0 refers to pyrolysis condition). The moisture level is varied in a range of 9.2−51.7% to represent the changes between the dried waste and realistic raw MSW.23At the start of the test, 400 g of bed material is placed in the reactor and the electric heater is turned on. The S-MSW begins to be supplied once the desired temperature is reached. After the system achieves stability, gas sampling is started. Samples are taken isokinetically, with the gas flow rate ranging from 0.6 to 1.0 L min−1. Liquid products (including tar and water) are trapped in two serpentine condensers, and non-condensable gas is collected using gas bags. After each experiment, the
Table 1. Characteristics of S-MSW Samples
proximate analysis (wt %, air-dried basis)
moisture 9.2
volatile 73.8
fixed carbon 12.8
ash 4.2
lower heating value (MJ kg−1) 22.5 ultimate analysis (wt %, air-dried basis)
C 48.4 H 6.3 O 29.2 N 0.8 S 0.3 Cl 1.6
Figure 1. Schematic diagram of the furnace: (1) screw feeder, (2) reaction chamber, (3) thermocouples, (4) controller, (5) cyclone separator, (6) heating tape, (7) temperature measurement, (8) induced draft fan, (9) serpentine condenser, (10) rotor flowmeter, (11) vacuum pump, and (12) accumulative flowmeter.
electric heater is turned off but N2flow is still maintained until the
furnace reaches room temperature to avoid the oxidation of the char remaining in the bed. The char is collected from the bottom of the furnace, separated from bed material, and weighted. To ensure the reliability of test data, each experiment is repeated 3 times under identical conditions, and the data reported are the average values recorded.
2.3. Analysis Method. Each experiment lasts for approximately 45−60 min after the system achieves stability, and the dry, clean, and cool syngas is collected by a gas bag every 10 min. Gas composition is analyzed using gas chromatography (micro GC-490 analyzer, Agilent). The gas mainly contains N2, CO, CO2, CH4, H2, C2H2, C2H4, and
C2H6. The total gas yield (Nm3kg−1of S-MSW) is quantified on the
basis of the N2balance, according to the molar ratio of N2in the input
and produced gas. The lower heating value (LHV) of the syngas is estimated by means ofeq 1.24For each test, 3−5 gas samples are taken and the data are validated when the measuring variability is within 5%.
To quantify the tar yield, the condensers and connection pipes are flushed by ethanol to avoid tar adhesion. The washing liquors are then heated at 60 °C for ethanol evaporation and weighted. The moisture content of the liquid products is measured by the Karl Fischer titration method, and its LHV is determined following the National Standard GB 384-81. The solid products include fly ash and char; their LHV is determined according to the National Standard GB/T 213-2008. On the basis of the data, product mass distribution of the syngas, condensates, and char is calculated, which represents the mass ratio of the corresponding output product to the input S-MSW and agent gas. The mass balance closure might deviate from 100% probably as a result of several possibilities. Some tars may be condensed and depositing on the furnace wall, leading to the underestimation of the tar produced. The measurement uncertainties may lead to the inaccurate estimation of the syngas yield. Therefore, to ensure the test quality, the criterion of mass balance data acceptance is set at 85− 105%.
Table 2. Effect of the ER and Temperature on Product Distributiona
product mass distribution (wt %) syngas yield (Nm3kg−1of S-MSW)
ER temperature (°C) syngas tarb char total N
2-freec 0 550 60.1 ± 4.7 9.9 ± 0.4 16.9 ± 0.5 1.0 ± 0.1 0.2 ± 0.0 650 64.1 ± 3.6 11.0 ± 0.3 11.9 ± 0.3 1.1 ± 0.1 0.3 ± 0.0 750 66.7 ± 2.5 8.8 ± 0.2 10.7 ± 0.3 1.2 ± 0.1 0.4 ± 0.0 850 68.8 ± 3.8 8.0 ± 0.4 11.6 ± 0.3 1.2 ± 0.1 0.4 ± 0.0 0.2 550 64.9 ± 3.6 4.5 ± 0.2 12.3 ± 0.5 1.3 ± 0.1 0.4 ± 0.0 650 70.7 ± 4.8 6.3 ± 0.3 9.2 ± 0.2 1.4 ± 0.1 0.5 ± 0.0 750 73.4 ± 3.1 4.8 ± 0.3 7.1 ± 0.4 1.4 ± 0.1 0.6 ± 0.0 850 74.3 ± 1.8 3.5 ± 0.2 5.3 ± 0.3 1.4 ± 0.0 0.6 ± 0.0 0.4 550 79.4 ± 2.8 2.8 ± 0.1 8.7 ± 0.4 2.2 ± 0.1 0.6 ± 0.0 650 83.6 ± 2.5 2.2 ± 0.1 5.5 ± 0.2 2.3 ± 0.1 0.8 ± 0.0 750 84.4 ± 1.9 1.8 ± 0.2 5.5 ± 0.3 2.3 ± 0.1 0.8 ± 0.0 850 86.0 ± 3.6 1.5 ± 0.1 4.1 ± 0.2 2.4 ± 0.2 0.8 ± 0.0 0.6 550 85.3 ± 2.4 2.2 ± 0.1 6.1 ± 0.4 3.1 ± 0.1 0.8 ± 0.0 650 87.5 ± 5.2 1.4 ± 0.1 3.6 ± 0.1 3.2 ± 0.3 0.9 ± 0.0 750 87.9 ± 3.9 1.2 ± 0.1 3.1 ± 0.1 3.2 ± 0.2 0.9 ± 0.0 850 89.0 ± 3.2 0.9 ± 0.0 2.7 ± 0.2 3.2 ± 0.2 1.0 ± 0.0 0.8 550 87.3 ± 3.0 1.0 ± 0.1 3.0 ± 0.2 4.0 ± 0.2 0.9 ± 0.0 650 88.4 ± 3.3 0.6 ± 0.0 2.3 ± 0.1 4.0 ± 0.2 0.9 ± 0.0 750 89.1 ± 2.9 0.6 ± 0.0 1.8 ± 0.1 4.0 ± 0.2 1.0 ± 0.0 850 89.7 ± 4.1 0.4 ± 0.0 2.1 ± 0.1 4.0 ± 0.3 1.0 ± 0.0 a
The error bars represent the standard deviation of three independent duplicate tests.bThe moisture content is excluded.cFor N2-free syngas yield,
uncertainty values of 0.0 are presented under all experimental runs as a result of the significant digit limitation.
Table 3. Main Reactions Involved during Waste Gasification1
Oxidation Reactions
R1 C + 1/2O2→ CO −111 MJ kmol−1 carbon partial oxidation
R2 CO + 1/2O2→ CO2 −283 MJ kmol−1 carbon monoxide oxidation
R3 H2+ 1/2O2→ H2O −242 MJ kmol−1 hydrogen oxidation
R4 CnHm+ n/2O2↔ nCO + m/2H2 exothermic CnHmpartial oxidation Gasification Reactions Involving Steam
R5 C + H2O ↔ CO + H2 +131 MJ kmol−1 water-gas reaction
R6 CO + H2O ↔ CO2+ H2 −41 MJ kmol−1 water-gas shift reaction
R7 CnHm+ nH2O ↔ nCO + (n + m/2)H2 endothermic steam reforming Gasification Reactions Involving Hydrogen
R8 C + 2H2↔ CH4 −75 MJ kmol−1 hydrogasification
R9 CO + 3H2↔ CH4+ H2O −227 MJ kmol−1 methanation
Gasification Reactions Involving Carbon Dioxide
R10 C + CO2↔ 2CO +172 MJ kmol−1 Boudouard reaction
R11 CnHm+ nCO2↔ 2nCO + m/2H2 endothermic dry reforming
Decomposition Reactions of Tar and Hydrocarbons
R12 tar → xCnHm+ yH2 endothermic dehydrogenation
To obtain optimum gasification conditions, it is evident that the quantity of the energy escaping the furnace should be maximized to facilitate the subsequent combustion step. The energy conversion efficiency, defined as the total energy contained in the syngas and tar at the gasifier exit divided by the LHV of the S-MSW, is selected as the indicator evaluating the performance of gasification, as shown ineq 2
= + + + + + − LHV (MJ Nm ) 0.126CO 0.358CH 0.108H 0.560C H 0.590C H 0.638C H syngas 3 4 2 2 2 2 4 2 6 (1) = + × ‐ E E
energy conversion efficiency (%)
LHV 100%
syngas tar
S MSW (2)
where CO, CH4, H2, C2H2, C2H4, and C2H6are the molar fractions of
the components in the syngas and Esyngasand Etarare the summations
of chemical energy and sensible energy contained in the syngas and tar, respectively.
3. RESULTS AND DISCUSSION
3.1. Effect of the ER and Temperature. 3.1.1. Product Distribution. The product distribution of syngas, char, and tar is listed in Table 2. The ER is the most important operating parameter in pyrolysis and gasification.6 Results reveal that a higher ER enlarges the mass of product gas and diminishes simultaneously the tar and char yields. For example, at 650 °C, the syngas yield rapidly increases by approximately 39% as ER increases from 0 to 0.8, while the amount of tar reduces sharply from 11.0 to 0.6%. This phenomenon is well in accordance with the mechanism of gasification reactions.1,25 In general, gasification processes can be divided into two main subcourses. The first step is primary pyrolysis, involving the thermal decomposition of MSW that produces volatiles, tar, and char. The second step is the hetero- and homogeneous reactions under a reducing atmosphere, including reactions of O2, H2O,
H2, and CO2 with hydrocarbon gases and the remaining
carbonaceous residues. The main reactions involved are summarized inTable 3. The partial oxidation (reactions R1− R4) will be strengthened at higher values of ER, thereby leading to a decrease in char and tar production and an increase in syngas yield.
The temperature also plays an important role in S-MSW pyrolysis and gasification by affecting all chemical reactions as well as their chemical equilibrium. Table 2 shows that the syngas yield rises from 60.1% (ER = 0 and 550 °C) to 89.7% (ER = 0.8 and 850 °C), accompanied by a gradual char decrease of 31−57%. With an increasing temperature, the tar yield under ERs of 0 and 0.2 first increases to its maximum point at 650 °C and then drops. As for an ER higher than 0.4, the tar yield decreases continuously when the temperature is raised from 550 to 850 °C, in a range of 45−66%. The Waterloo concept is widely accepted to account for the phenomenon:26during biomass decomposition, char, gas, and tar are first formed, followed by the secondary reactions that convert part of the tar into an additional amount of gas and char. With regard to the present study, a higher temperature provides more favorable conditions for primary decomposition of char, which is converted into tar and gas vapors. Subsequently, the secondary cracking of tar (reaction R12) becomes strengthened as the temperature further increases, leading to a decrease in tar production to form more gas.
To ensure a good performance of the pyrolysis/gasification process, the conversion of MSW should be guaranteed in a high
level. Syngas production can be viewed as one of the indicators reflecting this reaction degree. Figure 2 plots the mass
distribution of syngas as a function of the ER and temperature. With an increasing ER, the syngas distribution can be divided into two separate linear-fitted curves. The slope of the curves at lower ERs is pretty large, indicating that the syngas is produced rapidly and ER is the main factor controlling the reaction. The increase of syngas generation becomes slower at higher ER values. The fitted curves are crossed at an ER of around 0.4, which demonstrates that relatively high conversion has already been achieved at such an ER value. Nevertheless, this phenomenon is improper for a temperature of 550 °C; the syngas production still keeps rapid growth for further shifts of the ER value from 0.4 to 0.6. It could be concluded that a low temperature and ER are not suitable for the sufficient conversion of MSW.
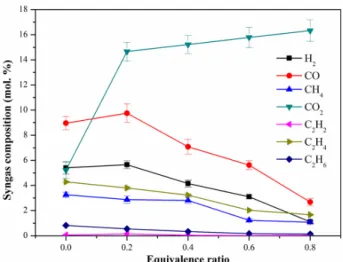
3.1.2. Syngas Characteristics. The effect of the ER on syngas composition is exhibited inFigure 3. With an increasing ER, the concentration of CO2 rises significantly, while
combustible species, such as CO, H2, and hydrocarbons,
show an inverse relation. For the entire range of ERs, the CO2
content increases from 5.2 to 16.3%. The concentration of C2H4 and CH4 is decreased by 61 and 72% when the ER is
increased from 0 to 0.8, respectively. CO and H2contents start
to rise at lower ERs and later drop when the ER exceeds 0.2. In comparison to pyrolysis conditions (ER = 0), the growth of CO and H2observed at an ER of 0.2 can be attributed to the
water-gas reaction (reaction R5) and carbon partial oxidation (reaction R1), together with secondary cracking of tar (reaction R12), enhanced by the heat supply from char oxidation. However, as ER further increases, oxidation reactions dominate and CO and H2 contents are quite linearly decreasing.
The variation of syngas composition as a function of the temperature is shown inFigure 4. Although different ERs are tested under specified temperature ranges, only cases of ER = 0 and 0.4 are discussed here because they are representative of reflecting the effect of the temperature. Results show that the contents of CO and H2 are enhanced as the temperature
increased from 550 to 850 °C. Similar tendencies have been found by Narváez et al. and Luo et al.6,8 According to Le
Chatelier’s principle, the endothermic reactions are favored at a
Figure 2. Effect of the ER and temperature on syngas mass distribution during S-MSW pyrolysis and gasification.
higher temperature. Therefore, the increase in H2 can be
attributed to the water-gas reaction (reaction R5), steam reforming reaction (reaction R7), and dry reforming reaction (reaction R11), while the enhanced Boudouard reaction (reaction R10) and reversed water-gas shift reaction (reaction R6) are responsible for the increase in the CO concentration. Meanwhile, higher temperatures also accelerate CO2
produc-tion. The result follows the same trend as the study by Li et al.27 but is different from the study by Narváez et al.6 The
content of CO2 is mainly controlled by the water-gas shift
reaction (reaction R6) and cracking of tar (reaction R12). A higher temperature accelerates the reaction rate to produce more CO2; at the same time, CO2is consumed as a result of an
endothermic reversed water-gas shift reaction. The final concentration of CO2 could be viewed as the competition
between these two reactions.
With regard to the content of CH4 and C2 hydrocarbons,
pyrolysis and gasification processes behave oppositely. For pyrolysis, CH4and C2hydrocarbons keep an upward trend with
an increasing temperature, whereas under an ER of 0.4, they start to decrease at a temperature higher than 650 °C. CH4 is
mainly recognized as a product of pyrolysis.28 A higher
temperature sharply impacts the heating rate and reaction intensity of the pyrolysis process, allowing for a greater production of light hydrocarbon gases. As ER increases, the heat supplied by oxidation promotes endothermic reforming reactions of hydrocarbon (reactions R7 and R11), which becomes more dominant at a higher temperature and results in the decrease of CH4and C2hydrocarbons.
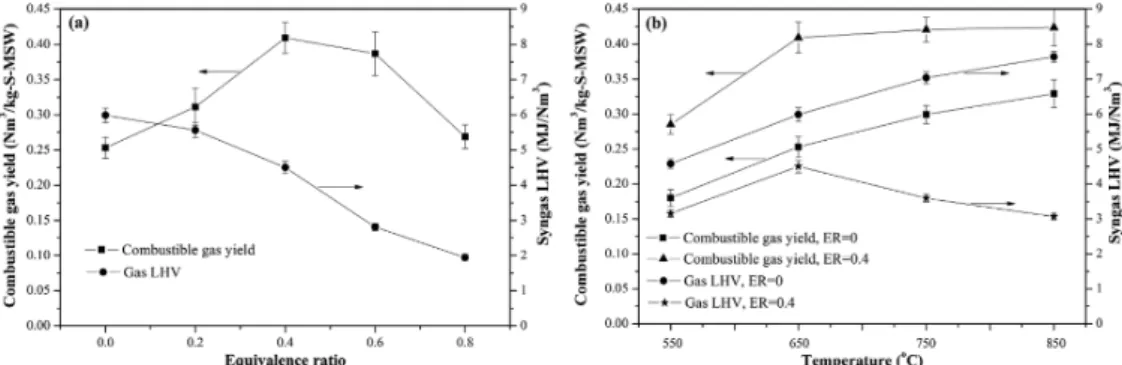
Figure 5dipicts the syngas LHV and combustible gas yield as a function of the ER and temperature. As presented inFigure 5a, the combustible gas yield first rises to its maximum point at an ER of 0.4 and then drops, indicating that increasing the ER to a high value produces syngas with a low quality. The LHV of syngas diminishes crucially with an increasing ER as a result of not only the oxidization of combustible gas but also the enlarging dilution effect of N2. The syngas LHV ranges from
1.9 to 6.0 MJ Nm−3. Previous studies6,29 have demonstrated
that the limit gas quality required for downstream combustion is around 4.0 MJ Nm−3. Therefore, ER values should not exceed ca. 0.5 to guarantee efficient subsequent energy utilization. With respect to the effect of the temperature in
Figure 5b, a higher temperature enhances the syngas LHV and combustible gas yield and leads to better a gas quality for an ER of 0 (pyrolysis only). Nevertheless, at an ER of 0.4, the gas LHV drops when the temperature exceeds 650 °C, mainly because of the sustained decrease in CH4and C2hydrocarbon
contents. It also indicates that an ER of 0.4 is effective to produce more combustible gases, but the syngas LHV is diminished simultaneously compared to pyrolysis conditions.
3.1.3. Energy Conversion Efficiency. Figure 6presents the energy conversion efficiency as a function of the tested ER and temperature. Results demonstrate that ER = 0.4 and temper-ature = 650 °C are the preferred conditions for gasification and the highest efficiency of 68.5% could be obtained. ER = 0.2 and temperature = 750 °C also lead to good performance (65.8% efficiency). The energy losses during gasification may be attributed to several reasons. Unconverted carbon contained in the char makes up a non-negligible proportion of the total energy. On the other hand, heat losses, mainly by conducting and converting, are strengthened in a lab-scale experimental apparatus. The energy conversion efficiency drops if ER is too high because the thermochemical reactions inside the furnace gradually convert from gasification to combustion.30The result is in accordance with recent works. Arena1indicated that ER values around 0.25−0.35 appear to maximize char conversion.
Figure 3. Effect of the ER on syngas composition during S-MSW pyrolysis and gasification (temperature = 650 °C; the result of N2is
not presented). The error bars represent the standard deviation of three independent duplicate tests.
Figure 4. Effect of the temperature on syngas composition during S-MSW pyrolysis and gasification (the result of N2is not presented): (a) ER = 0
Niu et al.20 simulated the MSW gasification in a bubbling fluidized bed and observed that the optimum ER was 0.35. On the other hand, it is also found that the energy conversion efficiency of gasification decreases greatly when the temperature exceeds 650−750 °C. However, an increasing temperature has a positive effect on the pyrolysis process. At 850 °C, the energy conversion efficiency reaches a high level that is comparable to the optimal conditions aforementioned. Nevertheless, it needs to be emphasized that pyrolysis is an endothermic process; i.e., additional thermal energy is requested to maintain the reaction, whereas autothermal gasification could be achieved at an ER of around 0.3−0.4.31Research has shown that the energy input for
pyrolysis at 500 °C equals 9% of the MSW high heating value.32
It could be concluded that, under the test conditions, an ER of around 0.4 and a temperature of around 650 °C are the most suitable for the efficient conversion of MSW for a pyrolysis/ gasification-based WtE process.
3.2. Effect of the S-MSW Moisture Content. The effect of the S-MSW moisture content has been studied at ER = 0.4 and temperature = 650 °C. In viewing the syngas composition inFigure 7, it is seen that a 61% increase in the H2content is
achieved on raising the moisture content to 51.7%, because the water-gas shift reaction (reaction R6) is favored at a higher steam partial pressure. CO is consumed producing CO2 and
H2, causing a decrease in CO and an increase in CO2
accordingly. The contents of CH4 and C2 hydrocarbons
decrease straightforward with an increasing water quantity as a result of enhanced reforming reactions.
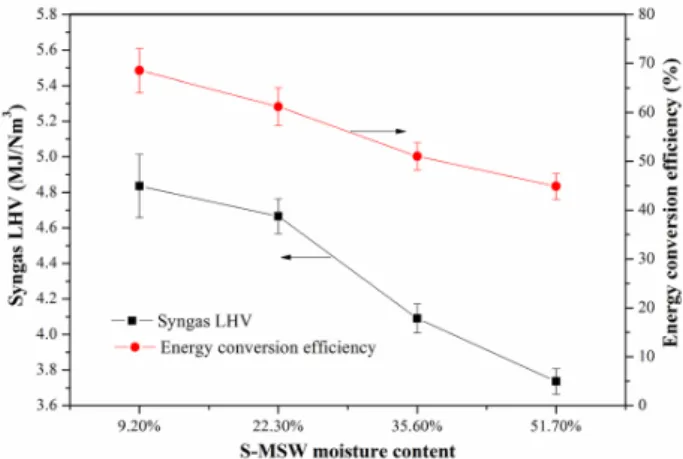
The gasification performance for different S-MSW moisture contents is presented inFigure 8. When the moisture content is increased, the syngas LHV declines continuously from 4.5 to 3.2 MJ Nm−3, while the energy conversion efficiency decreases from 68.5 to 44.9%. This indicates that the gain in H2 of the
syngas could not compensate for the loss of energy as a result of the reduced CO, CH4 and C2 hydrocarbon generation.
Doherty et al.33 reported a similar result that rising feedstock moisture degrades the gasifier performance. Because the moisture content of the raw MSW in China is relatively high (normally more than 40−50%),34 the input MSW should be
predried prior to gasification. Nevertheless, evaporation of a high content of water consumes additional energy; therefore, it is necessary to adapt the S-MSW moisture content to a suitable level. McKendry35 pointed out that fuel with a moisture content above 30% makes ignition difficult. With regard to the results in Figure 8, the syngas LHV drops rapidly if the moisture content is higher than 22.3%. Considering the balance between syngas quality and energy conversion efficiency, the moisture content of the feedstock should be lowered to at least ca. 20−25% to guarantee the gasification performance.
Figure 5. Combustible gas yield and syngas LHV during S-MSW pyrolysis and gasification: (a) effect of the ER (temperature = 650 °C) and (b) effect of the temperature (ER = 0 and 0.4). The error bars represent the standard deviation of three independent duplicate tests.
Figure 6. Effect of the ER and temperature on energy conversion efficiency during S-MSW pyrolysis and gasification. The error bars represent the standard deviation of three independent duplicate tests.
Figure 7. Effect of the moisture content on syngas composition during S-MSW pyrolysis and gasification (studied at ER = 0.4 and temperature = 650 °C; the result of N2is not presented). The error
bars represent the standard deviation of three independent duplicate tests.
3.3. Comparison of Environmental Emissions be-tween Gasification and Incineration. For the overall feasibility of a MSW thermal technique, the environmental performance is also a crucial factor. Therefore, an analysis is conducted comparing the emissions from gasification and conventional incineration. The pyrolysis/gasification-based WtE process provides a potential benefit to realize premixed flames and reduce the excess air of the plant. Premixed flames can yield substantial reduction of NOx,5while lower excess air
contributes to make air pollution control less costly and complex. Arena1 has reviewed some certified emissions from several existing waste gasification plants. The data indicate that gasification is able to meet the regulatory constraints of both the European Community and Japanese standards. Moreover, this process also allows for raw syngas treatment between the gasifier and the combustor. Especially, HCl could be removed prior to combustion, thus offering opportunities to increase the steam superheater temperature or to use the syngas in higher efficiency applications, such as a gas turbine or reciprocating engine.
Toxic emissions, such as heavy metals and dioxins, are regarded as the major resistance from MSW thermal techniques. The partitioning of heavy metals during MSW gasification and incineration was compared by a series of tests in our previous study, using the same reactor and feedstock.36It is found that gasification retains the volatilization of Cu, Ni, and Cr but favors Zn evaporation, because metals are mainly reduced to their elemental form or sulfide. Cd and Pb are active during both gasification and incineration processes; thus, effective pollution control devices should be equipped to minimize their environmental impact. Besides, the dioxin emission from waste gasification and incineration was also compared in our previous work.37 Results indicate that
gasification could strongly inhibit the formation of dioxins, which could be served as powerful evidence to consider a pyrolysis/gasification-based WtE technique a competitor of the current MSW incineration.
4. CONCLUSION
Pyrolysis and gasification of MSW are investigated in a fluidized bed reactor. The effect of the ER, temperature, and moisture content has been studied. Results reveal that ER is the
dominant factor determining both product distribution and characteristics. Increasing the ER boosts oxidation reactions, thus ultimately improving the syngas yield but decreasing its LHV. The combustible gas yield is strengthened at lower ERs as a result of the increase in CO and H2 contents but later
drops when the ER exceeds 0.4. The temperature is found to have a significant influence on the decomposition reactions. A higher temperature accelerates CH4 and C2 hydrocarbon
production from pyrolysis but causes an evident decrease in syngas LHV during gasification. The optimal process perform-ance under the specific input S-MSW and test conditions is found at an ER of 0.4 and a temperature of 650 °C, and the energy conversion efficiency, defined as the ratio of energy at the gasifier exit, is attained at 68.5%. Under such conditions, the increase of the MSW moisture content facilitates steam reforming reactions to increase H2 production, yet the syngas
LHV declines, lowering the energy conversion efficiency. To guarantee gasification performance, MSW should be predried to a moisture content of ca. 20−25%. An environmental analysis verifies that gasification is able to meet the emission limitations. In comparison to conventional incineration, the reductive atmosphere constrains the metal oxidation for potential heavy metal recycling and also the formation of dioxins is inhibited.
In conclusion, the present study assists in developing a pyrolysis/gasification-based WtE technique under the local conditions of China. It is expected that the data obtained can serve as a guideline for identifying more efficient and feasible MSW processes, and the accumulated experiences could render alternative MSW thermal techniques in China more com-petitive.
■
AUTHOR INFORMATION Corresponding Author *Telephone: +86-0571-87952687. Fax: +86-0571-87952438. E-mail:chiyong@zju.edu.cn. NotesThe authors declare no competing financial interest.
■
ACKNOWLEDGMENTSThis project is supported by the National Natural Science Foundation of China (51276168) and the Program of Introducing Talents of Discipline to University (B08026).
■
REFERENCES(1) Arena, U. Process and technological aspects of municipal solid waste gasification. A review. Waste Manage. 2012, 32 (4), 625−639.
(2) Kwak, T.-H.; Maken, S.; Lee, S.; Park, J.-W.; Min, B.-r.; Yoo, Y. D. Environmental aspects of gasification of Korean municipal solid waste in a pilot plant. Fuel 2006, 85 (14), 2012−2017.
(3) Bridgwater, A. V. Review of fast pyrolysis of biomass and product upgrading. Biomass Bioenergy 2012, 38, 68−94.
(4) Noma, T.; Ide, K.; Yoshikawa, J.; Kojo, K.; Matsui, H.; Nakajima, R.; Imai, K. Development of waste gasification and gas reforming system for municipal solid waste (MSW). J. Mater. Cycles Waste Manage. 2012, 14 (3), 153−161.
(5) Consonni, S.; Viganò, F. Waste gasification vs. conventional Waste-To-Energy: A comparative evaluation of two commercial technologies. Waste Manage. 2012, 32, 653−666.
(6) Narváez, I.; Orío, A.; Aznar, M. P.; Corella, J. Biomass gasification with air in an atmospheric bubbling fluidized bed. Effect of six operational variables on the quality of the produced raw gas. Ind. Eng. Chem. Res. 1996, 35 (7), 2110−2120.
Figure 8. Effect of the moisture content on syngas LHV and energy conversion efficiency during S-MSW pyrolysis and gasification (studied at ER = 0.4 and temperature = 650 °C). The error bars represent the standard deviation of three independent duplicate tests.
(7) Kaewluan, S.; Pipatmanomai, S. Gasification of high moisture rubber woodchip with rubber waste in a bubbling fluidized bed. Fuel Process. Technol. 2011, 92 (3), 671−677.
(8) Luo, S.; Xiao, B.; Hu, Z.; Liu, S.; Guan, Y.; Cai, L. Influence of particle size on pyrolysis and gasification performance of municipal solid waste in a fixed bed reactor. Bioresour. Technol. 2010, 101 (16), 6517−6520.
(9) Pérez, J. F.; Melgar, A.; Benjumea, P. N. Effect of operating and design parameters on the gasification/combustion process of waste biomass in fixed bed downdraft reactors: An experimental study. Fuel 2012, 96, 487−496.
(10) Arena, U.; Di Gregorio, F. Gasification of a solid recovered fuel in a pilot scale fluidized bed reactor. Fuel 2014, 117, 528−536.
(11) Kim, Y. D.; Yang, C. W.; Kim, B. J.; Kim, K. S.; Lee, J. W.; Moon, J. H.; Yang, W.; Yu, T. U.; Lee, U. D. Air-blown gasification of woody biomass in a bubbling fluidized bed gasifier. Appl. Energy 2013, 112, 414−420.
(12) Di Gregorio, F.; Zaccariello, L. Fluidized bed gasification of a packaging derived fuel: energetic, environmental and economic performances comparison for waste-to-energy plants. Energy 2012, 42 (1), 331−341.
(13) Donatelli, A.; Iovane, P.; Molino, A. High energy syngas production by waste tyres steam gasification in a rotary kiln pilot plant. Experimental and numerical investigations. Fuel 2010, 89 (10), 2721− 2728.
(14) Hernández, J. J.; Aranda-Almansa, G.; Bula, A. Gasification of biomass wastes in an entrained flow gasifier: Effect of the particle size and the residence time. Fuel Process. Technol. 2010, 91 (6), 681−692. (15) Zhang, Q.; Dor, L.; Fenigshtein, D.; Yang, W.; Blasiak, W. Gasification of municipal solid waste in the Plasma Gasification Melting process. Appl. Energy 2012, 90 (1), 106−112.
(16) Li, X.; Grace, J.; Lim, C.; Watkinson, A.; Chen, H.; Kim, J. Biomass gasification in a circulating fluidized bed. Biomass Bioenergy 2004, 26 (2), 171−193.
(17) Xiao, R.; Jin, B.; Zhou, H.; Zhong, Z.; Zhang, M. Air gasification of polypropylene plastic waste in fluidized bed gasifier. Energy Convers. Manage. 2007, 48 (3), 778−786.
(18) Ni, M.-j.; Xiao, G.; Chi, Y.; Yan, J.-h.; Miao, Q.; Zhu, W.-l.; Cen, K.-f. Study on pyrolysis and gasification of wood in MSW. J. Environ. Sci. 2006, 18 (2), 407−415.
(19) Guo, F.; Dong, Y.; Dong, L.; Jing, Y. An innovative example of herb residues recycling by gasification in a fluidized bed. Waste Manage. 2013, 33 (4), 825−832.
(20) Niu, M.; Huang, Y.; Jin, B.; Wang, X. Simulation of syngas production from municipal solid waste gasification in a bubbling fluidized bed using Aspen Plus. Ind. Eng. Chem. Res. 2013, 52 (42), 14768−14775.
(21) Xiao, G.; Ni, M.-j.; Chi, Y.; Jin, B.-s.; Xiao, R.; Zhong, Z.-p.; Huang, Y.-j. Gasification characteristics of MSW and an ANN prediction model. Waste Manage. 2009, 29 (1), 240−244.
(22) Chen, C.; Jin, Y.-Q.; Yan, J.-H.; Chi, Y. Simulation of municipal solid waste gasification in two different types of fixed bed reactors. Fuel 2013, 103, 58−63.
(23) Dong, J.; Ni, M.; Chi, Y.; Zou, D.; Fu, C. Life cycle and economic assessment of source-separated MSW collection with regard to greenhouse gas emissions: a case study in China. Environ. Sci. Pollut. Res. 2013, 20 (8), 5512−5524.
(24) He, M.; Hu, Z.; Xiao, B.; Li, J.; Guo, X.; Luo, S.; Yang, F.; Feng, Y.; Yang, G.; Liu, S. Hydrogen-rich gas from catalytic steam gasification of municipal solid waste (MSW): Influence of catalyst and temperature on yield and product composition. Int. J. Hydrogen Energy 2009, 34 (1), 195−203.
(25) Knoef, H.; Ahrenfeldt, J. Handbook Biomass Gasification; BTG Biomass Technology Group: Enschede, Netherlands, 2005.
(26) Van de Velden, M.; Baeyens, J.; Brems, A.; Janssens, B.; Dewil, R. Fundamentals, kinetics and endothermicity of the biomass pyrolysis reaction. Renewable Energy 2010, 35 (1), 232−242.
(27) Li, J.; Liao, S.; Dan, W.; Jia, K.; Zhou, X. Experimental study on catalytic steam gasification of municipal solid waste for bioenergy
production in a combined fixed bed reactor. Biomass Bioenergy 2012, 46, 174−180.
(28) Gómez-Barea, A.; Leckner, B. Modeling of biomass gasification in fluidized bed. Prog. Energy Combust. Sci. 2010, 36 (4), 444−509.
(29) Belgiorno, V.; De Feo, G.; Della Rocca, C.; Napoli, R. Energy from gasification of solid wastes. Waste Manage. 2003, 23 (1), 1−15. (30) Werle, S. Impact of feedstock properties and operating conditions on sewage sludge gasification in a fixed bed gasifier. Waste Manage. Res. 2014, 32 (10), 954−960.
(31) Zhang, Y.; Li, B.; Li, H.; Liu, H. Thermodynamic evaluation of biomass gasification with air in autothermal gasifiers. Thermochim. Acta 2011, 519 (1), 65−71.
(32) Baggio, P.; Baratieri, M.; Gasparella, A.; Longo, G. A. Energy and environmental analysis of an innovative system based on municipal solid waste (MSW) pyrolysis and combined cycle. Appl. Therm. Eng. 2008, 28 (2), 136−144.
(33) Doherty, W.; Reynolds, A.; Kennedy, D. The effect of air preheating in a biomass CFB gasifier using ASPEN Plus simulation. Biomass Bioenergy 2009, 33 (9), 1158−1167.
(34) Huang, Q.; Wang, Q.; Dong, L.; Xi, B.; Zhou, B. The current situation of solid waste management in China. J. Mater. Cycles Waste Manage. 2006, 8 (1), 63−69.
(35) McKendry, P. Energy production from biomass (part 3): gasification technologies. Bioresour. Technol. 2002, 83 (1), 55−63.
(36) Dong, J.; Chi, Y.; Tang, Y.; Ni, M.; Nzihou, A.; Weiss-Hortala, E.; Huang, Q. Partitioning of Heavy Metals in Municipal Solid Waste Pyrolysis, Gasification, and Incineration. Energy Fuels 2015, 29 (11), 7516−7525.
(37) Dai, Q. PCDD/Fs and PAHs emission in sewage sludge thermal treatment. Doctoral Thesis, Zhejiang University, Hangzhou, China, 2015.