Examen des effets comparatifs de l'adaptation sur les réponses des
neurones des couches supra et infragranulaires à l'aide de
stimulations visuelles et acoustiques dans le cortex visuel du chat
par Nayan Chanauria
Département des Sciences Biologiques
Faculté des arts et sciences
Thèse présentée
en vue de l’obtention du grade de Doctorat (Ph. D.) en Sciences Biologiques
ii
Faculté des études supérieures: Département de Sciences Biologiques,
Faculté des arts et sciences
Cette thèse intitulée
Examen des effets comparatifs de l'adaptation sur les réponses des neurones des couches
supra et infragranulaires à l'aide de stimulations visuelles et acoustiques dans le cortex
visuel du chat
Présentée par
Nayan ChanauriaA été évaluée par un jury composé des personnes suivantes
Dr. Annie AngersPrésident-rapporteur
Dr. Stéphane MolotchnikoffDirecteur de recherche
Dr. Jean RouatCodirecteur
Dr. Frédérique DuboisMembre du jury
Dr. Denis BoireExaminateur externe
iii
Dans le cortex visuel primaire (V1 ou l’aire 17) du chat, les neurones répondent aux orientations spécifiques des objets du monde extérieur et forment les colonnes d'orientation dans la zone V1. Un neurone répondant à une orientation horizontale sera excité par le contour horizontal d'un objet. Cette caractéristique de V1 appelée sélectivité d'orientation a été explorée pour étudier les effets de l'adaptation. Suivant un schéma d’entraînement (adaptation), le même neurone ayant initialement répondu à l’orientation horizontale répondra désormais à une orientation oblique. Dans cette thèse, nous étudions les propriétés d'ajustement d'orientation de neurones individuels dans des couches superficielles et plus profondes de V1 dans deux environnements d'adaptation. En raison de la grande interconnectivité entre les neurones de V1, nous émettons l'hypothèse que non seulement les neurones individuels sont affectés par l'adaptation, mais que tout le cortex est reprogrammé par l'adaptation.
Des enregistrements extracellulaires ont été effectués sur des chats anesthésiés. Les activités neuronales ont été enregistrées simultanément aux couches 2/3 et à la 5/6 à l'aide d'une électrode de tungstène. Les neurones ont été adaptés à la fois par stimulation visuelle et son répétitif selon deux protocoles différents. Dans les deux cas, une plage stimulante constituée de sinusoïdes à défilement a été présentée pour évoquer les réponses dans V1 et générer des courbes de réglage d'activité multi-unités. La connectivité fonctionnelle entre les neurones enregistrés a été démontrée par un corrélogramme croisé entre les décharges cellulaires captées simultanément.
En réponse à l'adaptation visuelle, les neurones des couches 2/3 et 5/6 ont montré des glissements attractifs et répulsifs classiques. En revanche en comparant le comportement des neurones de l'une et l'autre couche, on a observé une tendance équivalente. Les corrélogrammes croisés entre les trains de neurones des couches 2/3 et 5/6 ont révélé des décharges synchronisées entre les neurones. Durant l'adaptation au son, en l'absence totale de stimuli visuel, le glissement des courbes d’accord a été observés chez l'une et l'autre couche indiquant ainsi un changement de la sélectivité de l'orientation. Toutefois, il faut prendre note du
iv comportement indépendant.
Nos résultats indiquent que les réponses des neurones du cortex V1 peuvent être évoqués par stimulation directe ou indirecte. La différence de réponses à différents environnements d'adaptation chez les neurones des couches 2/3 et 5/6 indiquent que les neurones de l'aire V1 peuvent choisir de se comporter de la même façon ou différemment lorsque confrontés à divers’ stimuli sensoriels. Ceci suggère que les réponses dans V1 sont dépendantes du stimulus environnemental. Aussi, les décharges synchronisées des neurones de la couche 2/3 et de la couche 5/6 démontre une connectivité fonctionnelle entre les paires de neurones. En définitive on pourrait affirmer que les neurones visuels subissent une altération de leur sélectivité en construisant de nouvelles cartes de sélectivité. À la lumière de nos résultats on pourrait concevoir que le cortex en entier serait multi sensoriel compte tenu de la plasticité entre les zones sensorielles.
Mots clés: cortex visuel, plasticité, adaptation, sélectivité d'orientation, multi sensorialité, connectivité fonctionnelle, corrélation, audio-visuel.
v
In the cat primary visual cortex (V1 or area17), neurons fundamentally respond to orientations of the objects in the outside world. Neurons responding to specific orientations form the orientation columns in V1. A neuron responding to a horizontal orientation will get optimally excited towards the outline of a horizontal object. This feature of the visual cortex known as orientation selectivity has been continuously explored to study the effects of adaptation. Following a training paradigm called adaptation, the same neuron that was inherently responding to the horizontal orientation will respond to an oblique orientation. In this thesis, we seek to examine the orientation tuning properties of individual neurons in superficial and deeper layers of V1 in different adaptation environments. Due to the extensive interconnectivity between V1 neurons, we hypothesize that not only do individual neurons get affected by adaptation paradigm, but the whole cortex is reprogramed.
To this aim, extracellular recordings were performed in conventionally prepared anesthetized cats. Neural activities were recorded simultaneously from layer 2/3 and layer 5/6 using a tungsten multichannel electrode. Neurons were adapted with a visual adapter (visual adaptation) and a repetitive sound (sound adaptation) in two different settings. Both types of adaptations were performed uninterrupted for 12 minutes. In both settings, sine-wave drifting gratings were presented to evoke responses in V1 and generate tuning curves from the recorded multiunit activity. The functional connectivity between the recorded neurons was revealed by computing cross-correlation between individual neuron pairs.
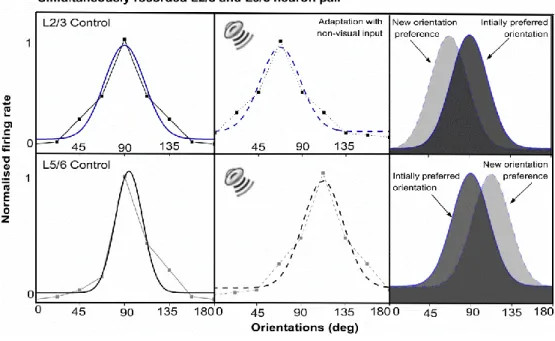
In response to visual adaptation, layer 2/3 and 5/6 neurons displayed classical attractive and repulsive shifts. On comparing the behaviour of the neurons in either layer, an equivalent tendency was observed. Cross-correlograms between the spike trains of neurons in layers 2/3 and 5/6 revealed synchronized firing between the neurons suggesting coordinated dynamics of the co-active neurons and their functional connections. During sound adaptation, where the visual adapter was completely absent, shifts in the tuning curves were observed in either layer indicating a novel orientation selectivity. However,
vi
neurons might have an additional role besides processing visual stimuli. The visual neurons may have demonstrated multisensory properties when stimulated indirectly through neighbouring sensory regions.
Our results indicate that primary visual neurons can be evoked by direct or indirect stimulation. The difference in the responses of layer 2/3 and layer 5/6 neurons towards the different adaptation environments indicate that neurons in V1 may behave similar or different towards the different sensory stimulus. This suggests that V1 responses are stimulus dependent. Additionally, the synchronized firing of layer 2/3 and layer 5/6 neurons towards visual adapter signify an existence of functional connectivity between the neuron pairs. Together, it can be summarised that visual neurons undergo an alteration of selectivity by building new orientation maps that ultimately potentiates plasticity within sensory regions that are highly suggestive of entire cortex being multisensory.
Keywords: Visual cortex, plasticity, adaptation, orientation selectivity, multisensory, functional
vii
RÉSUMÉ ...II ABSTRACT ... V TABLE OF CONTENTS ... VII LIST OF FIGURES ... XII ABBREVIATIONS ... XIV ACKNOWLEDGMENT ... XVI
CHAPTER 1: INTRODUCTION... 1
1.1.VISUAL SYSTEM ORGANIZATION ... 1
1.1.1. Overview ... 1
1.2.PRIMARY VISUAL CORTEX ... 1
1.2.1. Associated visual areas ... 4
1.3.RECEPTIVE FIELD PROPERTIES OF NEURONS ... 6
1.4NEURONAL SELECTIVITY ... 7
1.5.PHYSIOLOGICAL CLASSIFICATION OF CELLS ... 9
1.6SIMILARITY WITH OTHER VERTEBRATES ... 9
1.7CRITICAL PERIOD AND ADULT PLASTICITY ... 10
1.8VISUAL ADAPTATION AND PLASTICITY ... 12
1.9NEURONAL CONNECTIVITY WITHIN THE PRIMARY VISUAL CORTEX ... 14
2.0PLASTICITY AT MULTISENSORY CONVERGENCE REGIONS ... 17
CHAPTER 2: HYPOTHESIS AND OBJECTIVE ... 19
2.1HYPOTHESIS ... 19
viii
3.1ABSTRACT ... 26
3.2INTRODUCTION ... 27
3.3MATERIALS AND METHODS ... 29
3.3.1 Ethical approval... 29 3.3.2 Anesthesia ... 29 3.3.3 Surgery ... 30 3.3.4 Visual stimulation ... 30 3.3.5 Electrophysiological recording ... 32 3.3.6 Adaptation protocol ... 33 3.3.7 Data ... 33 3.3.8 Statistical tests ... 34 3.4RESULTS... 35
3.4.1 Layers II–III and V–VI primary visual neurons co‐ordinate to acquire a novel preference ... 36
3.4.2 Relation between the spike width and amplitude of shift ... 40
3.5DISCUSSION... 44
3.5.1 Adaptation mechanism ... 46
3.5.2 Possible functional implications ... 47
3.6REFERENCES ... 49
CHAPTER 4: SOUND INDUCES CHANGE IN ORIENTATION PREFERENCE OF V1 NEURONS: AUDIO-VISUAL CROSS-INFLUENCE... 53 4.1ABSTRACT ... 54 4.2HIGHLIGHTS ... 54 4.3INTRODUCTION ... 55 4.4EXPERIMENTAL PROCEDURES ... 56 4.4.1 Ethical approval... 56
ix
4.4.4 Stimuli and experimental design ... 58
4.4.5 Electrophysiology ... 61
4.5DATA ANALYSIS ... 62
4.5.1 Tuning curves ... 62
4.5.2 Orientation Selectivity Index (OSI) ... 64
4.5.3 Bandwidths (BW) ... 64
4.5.4 Response Change Index (RCI) ... 65
4.6STATISTICAL TESTS ... 65
4.7RESULTS... 66
4.7.1 Impact of repetitive auditory input on orientation tuning of visual neurons: A typical example. ... 66
4.7.2 Neurons in supra- and infragranular layers regain their original optimal orientation tuning ... 68
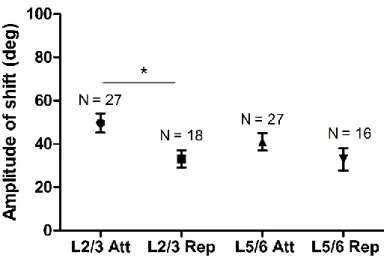
4.7.3 Shift amplitude and sound source localization ... 69
4.7.4 Sound impacts bandwidth of supra- and infra-granular neurons ... 73
4.7.5 Orientation Selectivity Index (OSI) ... 75
4.7.6 Response change index (RCI): Response modulation comparison between orientations ... 76
4.8DISCUSSION... 78
4.8.1 Methodological considerations ... 79
4.8.2 Layers behave as separate compartments ... 80
4.8.3 Layer 2/3 and layer 5/6 neurons change orientation preferences ... 81
4.8.4 Inhibitory mechanisms ... 82
4.8.5 Supramodal nature and cross-modal influences in the cortex ... 83
4.9CONCLUSION ... 84
4.10ACKNOWLEDGMENTS ... 85
x
5.1ABSTRACT ... 91
5.2INTRODUCTION ... 91
5.3SELECTIVITY IN CRITICAL PERIOD AND INHIBITION ... 92
5.3.1 Reorganisation of the cortex following sensory deprivation or sensory loss ... 93
5.3.2 Congenital blindness ... 96
5.3.3 Selectivity modified in adult visual and auditory cortices ... 97
5.3.4 Organization of somatosensory cortex and trigger features ... 102
5.3.5 Multisensory integration and cross-modal plasticity ... 105
5.3.6 Possible mechanism underlying adaptation and plastic modifications ... 107
5.4UNDERSTANDING AT POPULATION LEVEL/INTERAREAL EXPLORATIONS ... 109
5.5MODULATION OF PLASTICITY BY DRUGS APPLICATION ... 109
5.5.1 Effect of Serotonin and Fluoxetine on cortical plasticity ... 110
5.5.2 Effect of Ketamine on cortical plasticity ... 111
5.5.3 Molecular mechanism of cortical plasticity and drugs pathways action ... 115
5.6CONCLUSIONS ... 119
5.7REFERENCES ... 119
CHAPTER 6: CROSS-CORRELATION REVEALS SYNCHRONY WITHIN ADAPTED SUPRA AND INFRAGRANULAR LAYERS IN CAT V1 ... 129
6.1ABSTRACT ... 130
6.2INTRODUCTION ... 131
6.3MATERIALS AND METHODS ... 133
6.3.1 Ethical approval... 133
6.3.2 Anesthesia and surgery ... 133
6.3.3 Electrophysiological recording and Single unit isolation ... 134
xi
6.4.1 Similar mean amplitude of shift observed in layer V and layer II-III neurons... 138
6.4.2 Cluster analyses for deducing orientation selectivity among neurons of layer 2/3 and layer 5/6 ... 138
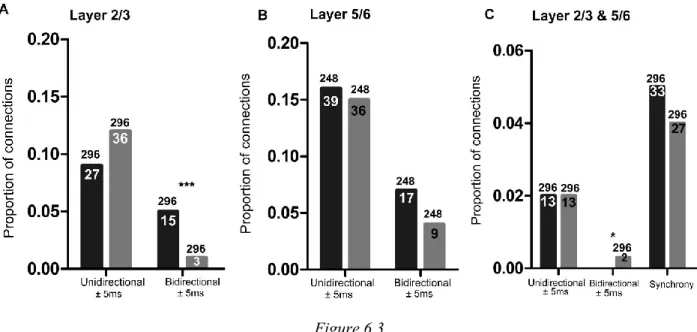
6.4.3 Proportion of connections decrease following adaptation ... 141
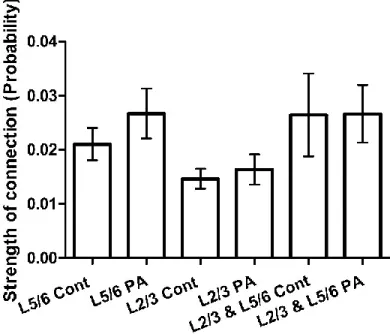
6.4.4 Strength of connections in layer 2/3, layer 5/6 and between layer 2/3 and layer 5/6 ... 142
6.4.5 Typical example of a cross-correlogram between a layer 2/3 and layer 5/6 neurons pair ... 143
6.5DISCUSSION... 144
CHAPTER 7: GENERAL DISCUSSION ... 146
7.1METHODOLOGICAL CONSIDERATIONS ... 146
7.1.1 State of the animal ... 146
7.1.2 Adaptation protocol duration ... 146
7.1.3 Spike sorting ... 147
7.2VISUAL ADAPTATION IN SIMULTANEOUSLY RECORDED LAYER 2/3 AND LAYER 5/6 NEURONS ... 148
7.2.1 How layer 2/3 and layer 5/6 neurons work in parallel with each other? ... 150
7.2.2 Adaptation mechanisms ... 151
7.3HOW PROLONGED AUDITORY STIMULATION CAN AFFECT THE PRIMARY VISUAL CORTEX NEURONS? ... 153
7.3.1 Possible mechanism of auditory modulation in primary visual cortex ... 155
7.3.2 Circuits and mechanisms underlying cross-modal plasticity ... 157
7.4WHAT CAN WE LEARN FROM THE COMPARISONS BETWEEN 12 MIN OF VISUAL AND 12 MIN OF AUDITORY ADAPTATION OF PRIMARY VISUAL NEURONS? ... 159
CHAPTER 8: FUTURE DIRECTIONS ... 163
CHAPTER 9: CONCLUSIONS ... 165
CHAPTER 10: REFERENCES ... 166
xii FIGURE 1.1 ... 3 FIGURE 1.2 ... 4 FIGURE 1.3 ... 8 FIGURE 1.4 ... 8 FIGURE 1.5 ... 16 FIGURE 2.1 ... 21 FIGURE 3.1 ... 32 FIGURE 3.2 ... 36 FIGURE 3.3 ... 38 FIGURE 3.4 ... 39 FIGURE 3.5 ... 41 FIGURE 3.6 ... 42 FIGURE 3.7 ... 43 FIGURE 4.1 ... 60 FIGURE 4.2 ... 62 FIGURE 4.3 ... 67 FIGURE 4.4 ... 68 FIGURE 4.5 ... 70 FIGURE 4.6 ... 72 FIGURE 4.7 ... 74 FIGURE 4.8 ... 76 FIGURE 4.9 ... 77 FIGURE 5.1 ... 94 FIGURE 5.2 ... 96 FIGURE 5.3 ... 102
xiii FIGURE 6.1 ... 138 FIGURE 6.2 ... 140 FIGURE 6.3 ... 141 FIGURE 6.4 ... 142 FIGURE 6.5 ... 143
xiv V1: A17, area 17, Primary Visual Cortex
V2: A18, area 18, Secondary Visual Cortex V3: Visual area 3/ Brodmann area 19 V4: Visual area 4
MT: Middle temporal visual area/ V5 LGN: Lateral Geniculate Nucleus PV: Parvalbumin
NMDA: N-methyl-D-aspartate/ NMDAR Nogo: Nogo receptor (NgR)
OMgp: Oligodendrocyte myelin glycoprotein MAG: Myelin-associated glycoprotein SC: Superior colliculus
AES: Anterior ectosylvian sulcus Min: minute
ACG: Auto correlogram CCG: Cross correlogram
PCA: Principal component analysis OSI: Orientation Selectivity Index Ca2+: Calcium ion
Ms: millisecond
FS: Fast spiking/ interneurons
xv
I dedicate this thesis to
my mother Tashi Angmo (Amuu)
&
my husband Ashish Mehta (Ashi)
who at different times have been an immense source of inspiration
and encouragement
xvi
My deepest gratitude goes first to Professor Stephane Molotchnikoff, my thesis supervisor, who played a fundamental role in my doctoral education. His unwavering enthusiasm for neuroscience and passionate narration of exciting stories of his scientific career kept me constantly engaged with my research. I would like to thank him for his patience, time and for always being there. Similarly, I would like to thank my thesis co-director Dr. Jean Rouat who offered me great help and support with the technical requirements of the project. His contribution to optimizing the hardware during my doctoral study has been immense. Coming from a different background, it was the combined inputs and guidance of Dr. Molotchnikoff and Dr. Rouat that I have been able to finish my Ph.D. project. I would again thank them both for their time and availability.
My journey started in February 2014 and I would not hesitate to say that I had never experienced the kind of environment my three ex-colleagues and friends (Dr. Lyes Bachatene, Dr. Vishal Bharmauria and Dr. Sarah Cattan) had established in the lab when I arrived. Coming out of my country for the first time, I experienced a warm welcome in the lab. It was just right ambience to be in for research as well as fun. Together, I would like to thank all three of them for their friendship, team spirit, goodwill and creating a comfortable and productive environment in the lab.
I am thankful to Lyes and Sarah for their support in the lab. Lyes helped me immensely with the initial preparation of the lab and surgeries of the animals for experiments. Sarah encouraged and helped me to be comfortable with the cats for future experiments. She also lent me her hand in French to an extent that I was once able to present my work in French in a local conference. A special thanks to Vishal for his tremendous support in the lab and outside during my early days in Canada. Vishal helped me in understanding the culture and integration with people. I thank him for his endless help.
xvii
sharing her scientific experiences and exchanging knowledge on auditory neuroscience. Thanks to Ms. Afef Ouelhazi, Mr. Rudy Lussiez, Ms. Assia Tsyvian-Dzyabko, Mr. Steffano Bettinazi, Ms. Charlotte Capt, Mr. Karim Bouvet, Mr. Philip Ouimet and Ms. AB Riham for keeping the atmosphere alive around me and helping me with French at different times. I am also grateful to the following university staff: Ms. Annie Aubin, Ms. Claudia Hamelin, Ms. Isabelle Lallande, Ms. Michelle Gibeault, Ms. Sadok Meriem, Mr. Daniel, Ms. Josee Lettelier and Ms. Audil for their help during the Ph.D. A big thank you to Ms. Louise Pelletier for helping me with the histology of the cat brain and not to forget her home-made coffee cakes that helped me stay awake while recording alone in the lab during the night! Hugs for you Louise!
Then, I would like to thank my forever interested, encouraging and enthusiastic cousin, Ms. Kalpana Bhardwaj and my brother-in-law Mr. Nikhil Chowdhary for unending discussions on spirituality, neuroscience and life. I thank my friend Mr. Loveleen Singh for cooking amazing meals specially for me and delivering them to the lab during my cat experiments. I also thank my friends Ms. Akankasha Sen and Mr. Hanan Guleria for welcoming me with open hearts to spend the weekends with them and indulging in group study.
I thank the University, Department and other funding agencies for the scholarships that helped me in being financially independent specially towards the end of the PhD, I extend my thanks to all of them. Last but not the least comes my family. The biggest thankyou to my in-laws for believing in me, my husband to be my backbone, my mystical father for inspiring me to do good as a human being, my mother for being my ‘Shero’ and my aunt ‘Chimme’ for always praying success for me. My eternal cheerleader, baby brother Prakhar, who is not only my brother but also my critic and my best friend.
I would not deny that I was also on a kind of personal journey during my PhD since I was away from my husband and family for initial six months that too for the first time in my life. It was emotionally
xviii more confident person!
I thank every single person that had been associated in the success of this journey. I wish everyone happiness and success for life!
Thanks to all of you for making me what I am today! Nayan Chanauria
1
CHAPTER 1: INTRODUCTION
1.1. Visual System Organization
1.1.1. Overview
Visual areas in humans are made up of about 5 billion neurons which is approximately 25% of the cortex. The continuous exploration on the visual cortex revealed that there are many areas of the vision including areas V1, V2, V3, V4 and MT which were best defined regarding structure, topography and physiological properties (Felleman & Van Essen, 1991; Kujovic et al., 2013). These regions are involved in processing a multitude of visual information such as shape, color, orientation, size, and movement, etc. resulting from the various visual information processing pathways. The cortex of mammals such as monkeys, cats, and humans are usually divided into different areas that process a specific function.
1.2. Primary Visual Cortex
Among all the visual areas, the primary visual cortex (V1) is historically the most studied part of the brain. It is the part of the cerebral cortex that is responsible for processing visual stimuli. Because of its stripy appearance this area is also known as striate cortex. It is the simplest and earliest recognized cortical visual area, highly specialized for processing information about static and moving objects and is implicated in pattern recognition. The primary cortical area of cats embody a columnar organization, meaning that neurons within a column perpendicular to the surface of the cortex have similar response properties i.e. similar position, and similar orientation selectivity (Hubel et al., 1977; Blasdel & Salama, 1986). These domains of orientation selectivity are known as orientation columns (Hubel & Wiesel, 1959; 1962a). In an orientation column, neurons optimally respond to the same orientation and can be evoked by oriented bars of light. A neuron responding to a horizontal orientation will get optimally excited towards the outline of a horizontal object. This feature of the visual cortex is known as orientation selectivity. Each hemisphere of
2
the cat brain has a visual cortex. The right visual cortex receives information from the left visual field, and the left visual cortex from the right visual field. There is another system of alternating columns, which corresponds to the separation of afferents from both eyes. These are the ocular dominance columns. The ocular dominance columns represent bands of cortical tissue alternately occupied by afferents from the left eye or right eye (Shatz & Stryker, 1978; Horton & Hocking, 1996; Adams et al., 2007). These bands are particularly pronounced at the cortical layer IV, which receives the afferent endings of the lateral geniculate nucleus. Thus, the visual cortex is organized into functional maps of orientation, spatial frequency, ocular dominance, temporal frequency which are integrative to each other. This parallel organization of visual system is involved in the establishment of two major visual pathways: ventral and dorsal pathways which are vital for the object recognition. The ventral pathway is involved in the processing the characteristics of the objects (shapes, colours, materials), that is, object recognition including faces. The dorsal pathway in the cortex, which ends in the parietal lobe, is associated with spatial vision (action/location) of objects (Mishkin et al., 1983; DiCarlo et al., 2012).
The primary visual cortex, or area 17, is divided into six layers from layer 1 to layer 6 which comprise different types of neurons (Hubel & Wiesel, 1959). Each layer has its own peculiarities (Figure 1.1). The interconnectivity between primary visual cortical area is very specific. Functionally, layers 1-3 are often grouped together and called the superficial layers of the cortex. Layer 1 has very few neurons but many axons, dendrites and synapses. Layers 2 and 3 consists of a dense array of cell bodies and many local dendritic interconnections. These layers appear to receive a direct input from the LGN (Fitzpatrick et al., 1983; Hendry & Yoshioka, 1994). The outputs from layers 2 and 3 are projected to other cortical areas. Layers 2 and 3 are hard to distinguish based on simple histological stains of the cortex therefore referred to as one when discussing their features. Layer 4 receives the primary input from the LGN body and sends the output to layer 5 and layer 6. Layer 5 contains relatively few cell bodies compared to the surrounding layers. It sends a major output to the superior colliculus, a structure in the midbrain. Layer 6 is dense with cells and sends a large output back to the LGN (Thomson & Bannister, 2003). Classically, superficial layers
3
project onto layer 4 and forward outputs to new cortical areas. The feedback projections tend to come from the deep layers and terminate in layers 1 and 6 (Felleman & Van Essen, 1991). But Constantinople and Bruno (Constantinople & Bruno, 2013) challenged the dogma of flow of information by reporting that deeper cortical layers along with layer 4 can be directly and simultaneously activated by the thalamic input in rats. This reflects that layer 5/6 is not necessarily the only port of information flow to other cortical layers.
Figure 1.1
A cross-section of the cerebral cortex showing layers of the cortex (https://imgur.com/gallery/xCAoW)
Hubel and Wiesel (Hubel & Wiesel, 1959) also observed that neurons responding to orientations were specifically organized. By introducing an electrode through the cortex perpendicular to the surface (Figure 1.2, left), they encountered neurons with similar properties regardless of whether they have simple or complex receptive fields, i.e. responding to similar orientations and stimuli from the same eye. Thus, the
4
concept of orientation selectivity in the columns was introduced. If the penetration angle was tangential (Figure 1.2, right), the neurons changed in a predictable way: the orientation selectivity of the neurons varied from 180° up until 1 mm of the cortex in a continuous way. It was deduced that, in this way, the electrode had passed through several orientation columns. However, it should be noted that the continuous variation of orientations on the same plane of the cortex can be broken punctually or on a so-called "fracture" line. When the electrode crosses these two types of discontinuity, the orientation can vary abruptly by an angle of more than 45° (Blasdel & Salama, 1986; Blasdel, 1992).
Figure 1.2
Penetrations of electrodes perpendicular (left) or parallel (right) to the cortical surface. The orientations giving the most response to each electrode progression are indicated in the vertical and horizontal bars
(ISBN: 9780781760034)
1.2.1. Associated visual areas
In addition to the primary visual cortex (V1), there are many neighbouring visual areas whose functions are crucial in visual processing. Secondary visual area V2 or area 18 of the cat shows strong reciprocal connections with primary visual area V1 or area17 (Symonds & Rosenquist, 1984; Salin et al., 1995). V1
5
project its X geniculate cells inputs onto V2 (Freund et al., 1985; Dreher et al., 1992). Along with the structural association, these areas also undergo functional interactions towards orientation tuning, as it has been shown that inactivation of V1 changes the orientation sensitivity of V2 cells (Chabli et al., 1998). It has also been shown that V2 modulates V1 responses, either by augmenting or by decreasing neuronal firing rates, without radically affecting their orientation or speed (Martinez‐Conde et al., 1999). The neurons in V2 share many properties with V1 area neurons (Bonhoeffer & Grinvald, 1993) though they also have many differences (Sengpiel et al., 1999). The major difference between V1 and V2 is that V1 receives its input from LGN, and V2 additionally receives its input from V1. Thus, V1 and V2 have mutual relationship as they are dependent on feed-forward and feed-back inputs.
In a classical study (Symonds & Rosenquist, 1984), authors confirmed that corticocortical pathways in the cat visual system may originate not only from the traditionally found layer 2/3 but from any layer of the cortex. Layer 6 of area 19 and PMLS may project to area17 and PMLS alone to area 18 (Gilbert and Kelly, 1975; Kawamura and Naito, 1980). They additionally confirmed the revelations of previous studies (Shtaz, 1977; Innocenti, 1981; Segraves and Rosenquist, 1982) that projections from area 17 to outside originate from deeper layers of area 17.
The authors concluded through retrograde tracing and retinotopy technique that specific visual areas provide vital information to a set of visual areas locally anatomically located to that specific area whereas poses modulatory influences onto those visual areas that are located anatomically apart. Due to this reason, any single visual area cannot be placed in a hierarchical order with other visual areas because cells in a specific area might project forwards to backwards at the same time.
The mentioned study also revealed that projections to visual areas are evoked depending upon the target areas. Tracing of axons in different layers of area17 disclosed that projections that come out of area 17 are layer specific towards specific visual areas. In addition, another important revelation was made. A visual area receives its afferents from among different layer of the different cortical areas that supports the
6
discussion of this thesis. Therefore, all these areas are interconnected by neural projections that can be observed in a specific cortical area or between different areas.
1.3. Receptive field properties of neurons
The term receptive field was originally coined by Sherrington (Sherrington, 1906). Classically, receptive field defined by a region in space in which the presence of a feature excites the neuron and augments its firing (Hartline et al., 1978). Receptive fields have been identified for neurons of the auditory system, the somatosensory system, and the visual system in response to spatial localisation, specific frequencies and amplitudes. Receptive fields can be empirically characterized by fixing the animal in space and presenting the feature, thus selectivity of a neuron can be determined. For example, random presentation of a series of sine-wave drifting gratings tilting gradually by small angles to a group of neurons in a primary visual cortex evokes neuronal responses to the specific angles. Layer 2/3 neurons preferentially respond to stimuli such as bars having characteristics as orientation, spatial frequency, direction, length. Neurons in different layers are classified into single cells, complex and hyper complex cells depending on the properties of their receptive fields. Simple cells are mainly found in layers 4 and 6 and have ON-OFF sub fields. Complex neurons do not have defined ON or OFF receptive fields, and a stimulus presented anywhere in the receptive field evokes a response, that is why complex cells have larger receptive fields than the simple cells. Therefore, a complex cell does not exhibit adjacent excitatory and inhibitory zones within its receptive field (Hubel & Wiesel, 1962). Layer 2/3 neurons are almost exclusively occupied by complex cells (Gilbert & Wiesel, 1979). Hyper complex cells are known to have very large receptive fields. They emerge when complex neurons’ axons (interspersed with different orientations) converge. When a line is presented within the receptive field of a hyper complex cell, its response starts to decline beyond a specific length of the line because of the antagonistic excitatory and inhibitory regions (Hubel & Wiesel, 1965; Gilbert & Wiesel, 1979).
7
1.4 Neuronal Selectivity
The hallmark of the neurons in the somatosensory system, the auditory system, and the visual system is that they have organized receptive fields (Hubel & Wiesel, 1965; Kozlov & Gentner, 2016). Here neurons are selective to a specific range of stimuli (Hubel & Wiesel, 1959). The adjacent neurons in the primary visual cortex actively respond to edges or bars of contrast, when presented an orientation in their receptive field. Each neuron is programmed to respond to an "optimal orientation" for which its discharge activity or empirically defined firing rate is maximum. All orientations of an edge or a bar are represented in approximately equal proportions at the pinwheels (Figure 1.3), a region at the centre where all orientations intersect (converge). The English term pinwheel here describes the fact that the colored areas seem to turn around an axis like the wings of a reel (Maldonado et al., 1997). The orientation selectivity of neurons recorded from different regions of the cortical map varies from 0 to 1, where closer the OSI is to one, the stronger the orientation selectivity (Bachatene et al., 2012a; Cattan et al., 2014; Bachatene et al., 2015a; Bachatene et al., 2015b; Chanauria et al., 2016). For any neuron, these values are calculated by generating tuning curves of the neurons from the firing rates of the same neurons for different orientations (Butts & Goldman, 2006). A tuning curve is an empirical description and estimation of parameters that shows the best fitting model function for a single neuron (Swindale, 1998b). A cartoon is shown in Figure 1.4 depicting how a tuning curve is generated.
8
Figure 1.3
Changes in pinwheel organization at the same location in A17 and A18 (columns) in control (upper row), following adaptation (middle row) and recovery (lower row) conditions. The orientation inside the blue
square under the colored bar indicates the adapting orientation (Cattan et al., 2014)
Figure 1.4
(A) Experimental setup where range of orientations are presented to the neurons (B) Variation of response (right) towards different orientations (left) (C) Following the recording of the neuronal response towards different orientations a tuning curve can be calculated and generated and a figure.
9
1.5. Physiological Classification of cells
Primary visual cortex is divided into different layers and different cells across layers perform specific function. Two types of cells are mainly observed in the visual cortex: pyramidal cells and inhibitory interneurons. Pyramidal cells are excitatory neurons projecting onto other brain regions whereas interneurons are inhibitory in nature and are mainly convoluted in feedback/ feedforward mechanisms (Tremblay et al., 2016). Each layer corresponds to specific cell type and connectivity in primary visual cortex. Pyramidal cells are found in layers 2/3, 5 and 6 and are the only neurons that send axons outside the cortex whereas layer 4 is dominated by stellate cells. The supragranular layers consist of layers 1 to 3 and layers 5 and 6 constitute the infragranular layers. Neurons recorded electro physiologically can be segregated into excitatory pyramidal cells and inhibitory interneurons based on ascending slope of the spike-waveform and based on their firing patterns (Niell & Stryker, 2008; Bachatene et al., 2012a; Bachatene et al., 2012b; Vinck et al., 2013; Bachatene et al., 2015a). The RS or regular spiking neurons, can be putatively linked to the pyramidal neurons, whereas the FS or fast spiking neurons may be associated to the inhibitory interneurons (Niell & Stryker, 2008; Bachatene et al., 2012a; Bachatene et al., 2012b; Vinck et al., 2013; Bachatene et al., 2015a). The major difference between an FS and an RS is that the FS has a steeper ascending slope than the RS (Niell & Stryker, 2008). In other words, the FS spike-width is smaller than the RS spike-width. In cats the dissociation of the interneurons and pyramidal cells based upon this technique is not entirely possible as pyramidal neurons may show the fast spiking outline (Nowak et
al., 2003). Thus, it is to be considered while classifying or inferring the data based on ascending-slope
discrimination of spike-waveforms in cats.
1.6 Similarity with other vertebrates
Over a period of years, monkeys, cats, and mice are being commonly used in neurophysiological experiments for understanding cortical mechanisms in general and visual pathways. The cats’ visual system
10
is congruent to many species (Tyler et al., 1998; Kaschube et al., 2010) even to humans’, thus making them a suitable model for understanding the brain better and even give insights into human brain function. Lower vertebrates like rats and mice have a salt-and-pepper cortical organisation and lack the orientation columns like cats, monkeys and humans. Yet, they exhibit neuronal selectivity as many orientations are intermingled in a small tissue volume (Ohki et al., 2005; Van Hooser, 2007). Neurons in cat share similarity with neurons in primate in many ways e.g. the receptive fields in the retina and the LGN are concentrically arranged in cats and monkeys (Swindale, 1997; Jeffries et al., 2014). Furthermore, the X and Y ganglion cells classification is similar in function in monkeys and cats (Dreher et al., 1976). Also, both simple and complex cells are found in primates and cats (Hubel & Wiesel, 1968). Additionally, experimentation in different models have established that the human visual system indeed shares the features with the cat visual system (Blake, 1979). Of course, it is undeniable that there are certain differences e. g. human visual system has much better color-discrimination power than the cat visual system (Loop & Bruce, 1978). For all the mentioned reasons, cats have been continuously chosen as a model for researchers in neuroscience to study and investigate different facets of the brain functioning.
1.7 Critical period and adult plasticity
During early development, the brain undergoes a period of enhanced plasticity known as the critical period. Critical period was introduced by the pioneering work of Wiesel and Hubel (Wiesel & Hubel, 1963) in their studies in the developing visual system of cats. The critical period can last from about 3 weeks to several months in cats. Critical periods are described as the times during which sensory experience is imperative for the development of the brain and to establish the circuitry of neurons constantly by varying experiences. This early experience drives inhibition between neurons and helps carve the critical period plasticity (Trachtenberg JT, 2015). The maturation of cortical inhibition just after eye-opening of the new born is also necessary for the establishment of experience-dependent ocular dominance plasticity in the visual cortex. Ocular dominance plasticity relies on counteraction between two eyes to drive cortical responses.
11
Monocular occlusion leads to a behavioral reduction in responses to the deprived eye, an effect that is mediated in primary visual cortex (Prusky et al., 2000). Two decades ago, the first direct experimental control over the induction of ocular dominance plasticity was achieved by altering local circuit excitation/inhibition (E/I balance) (Hensch et al., 1998a). Subsequent experiments showed that the potential for plasticity is retained throughout life until an inhibitory threshold is attained (Fagiolini & Hensch, 2000). More specifically, it is the late maturation of inhibitory Parvalbumin-positive large basket (PV) cells that mediates this form of plasticity (Fagiolini et al., 2004). Do PV cells control the opening of critical periods for other receptive field properties across multiple sensory domains is unclear and is an active area of research. The maturation of excitatory circuits has also been implicated in critical period induction. For many years, synaptic plasticity at excitatory synapses alone was thought to control ocular dominance plasticity, but experimental manipulations failed to produce changes in vivo (Hensch & Stryker, 1996; Hensch et al., 1998b; Renger et al., 2002). However, mice with immature excitatory circuits arising from targeted gene-disruption of NR2A, a subunit of the N-methyl-D-aspartate (NMDA) glutamate receptor, fail to develop orientation selectivity despite normal visual experience (Fagiolini et al., 2003). Thus, the maturation of inhibitory and excitatory circuits controls distinct features of visual cortical plasticity. Rapid functional plasticity is converted to long lasting structural changes by a variety of pre- and postsynaptic mechanisms. Axonal outgrowth is inhibited when presynaptic Nogo receptors and PirB receptors bind to oligodendrocyte released Nogo, OMgp, and MAG (Atwal et al., 2008; Schwab, 2010). This, in turn, consolidates functional circuits and reduces plasticity (McGee et al., 2005; Syken et al., 2006). Postsynaptically, monocular deprivation increases proteolytic (tPA-plasmin) activity (Mataga et al., 2002), leading to increased dendritic spine motility (Oray et al., 2004). This is followed by transient elimination and regrowth of spines in favor of the non-deprived eye (Mataga et al., 2004). Along these lines, accelerating the maturation of dendritic spines by deletion of intracellular adhesion molecule 5 (Icam5) accelerates the window of plasticity for auditory thalamocortical connectivity (Barkat et al., 2011). Finally, molecular brakes on modulatory systems play an active role in suppressing plasticity in adulthood.
12
Depletion of catecholamines by the administration of 6-OH-dopamine, which selectively destroys dopaminergic and noradrenergic neurons, prevents ocular dominance plasticity in kittens (Kasamatsu & Pettigrew, 1976; Bear et al., 1983). Chronic administration of fluoxetine, a selective serotonin reuptake inhibitor, can restore plasticity in adult visual cortex by increasing the expression of brain-derived neurotrophic factor, which had previously been implicated in developmental plasticity (Hanover et al., 1999), and decreasing intracortical inhibition (Maya Vetencourt et al., 2008). Finally, negative regulation of cholinergic modulation by Lynx1 facilitates E/I balance and prevents ocular dominance plasticity in adulthood (Morishita et al., 2010). While many studies over the last forty years have uncovered mechanisms underlying plasticity within a sensory domain, how sensory experience affects the processing and organization across sensory modalities is much less clear.
Therefore, brain is referred to as plastic. The critical period is characterized by a heightened increase in excitation and inhibition right after birth, leading to a large reorganisation of neuronal network that become resilient with maturity.
1.8 Visual Adaptation and plasticity
Neurons have an amazing tendency to change their properties in response to the environment that confers the brain plasticity. It was considered that the orientation selectivity of the neurons in the cortical columns remains stable in the primary visual cortex established early in life during the "critical period" (Tanaka et
al., 2009). However, different studies in various laboratories have shown that even in mature brain, the
neural network restructures beyond the critical period following birth (Dragoi et al., 2000; Godde et al., 2002). Adult V1 neurons modify their original selectivity acquired just after birth to a new preferred orientation following adaptation (Dragoi et al., 2000; Ghisovan et al., 2009; Bachatene et al., 2012b; Cattan
et al., 2014). Nowadays, it is widely known that presentation of a prolonged non-optimal stimulus, called
non-13
preferred stimulus. This phenomenon is known as adaptation (Dragoi et al., 2000; Ghisovan et al., 2009; Bachatene et al., 2012b; Cattan et al., 2014). As a consequence of this adaptation, the neurons shift their tuning either towards or away from the adapter exhibiting attractive or repulsive shifts (Dragoi et al., 2000; Ghisovan et al., 2009; Bachatene et al., 2012b) and the cortex is remapped (Dragoi et al., 2000; Godde et
al., 2002). This shift of orientation preference is defined as the plasticity of visual cortex. Similar results
have been obtained for other features of the stimulus such as spatial frequency (Marshansky et al., 2011), direction of motion (Kohn & Movshon, 2004) and speed (Movshon, 1975). The cortices of higher mammals such as cats, monkeys and humans are organised into domains of selectivity called orientation columns. These columns extend down from layer 1 to layer 6. Reports demonstrate that layer 2/3 primary visual neurons show these classical attractive and repulsive shifts (Dragoi et al., 2000; Ghisovan et al., 2009; Bachatene et al., 2012b; Cattan et al., 2014). Layer 2/3 and layer 5/6 neurons are one of the most important computational processing units in the cortical column to decipher the information flow within the cortical circuit (Gilbert & Wiesel, 1989; Kisvarday & Eysel, 1992; Binzegger et al., 2004; da Costa et al., 2010; Cain et al., 2016). Numerous studies suggest the importance of layer 2/3 and how adaptation affects these neurons (Dragoi et al., 2000; Ghisovan et al., 2009; Bachatene et al., 2012b; Cattan et al., 2014). Layer 5/6 neurons are continuously involved in feed forward and feedback loops in response to an input, but there is no evidence of how adaptation affects these neurons.
A study by Bachatene and co-authors (Bachatene et al., 2015c) showed in superficial layers of the visual cortex that mean of amplitude of shift of adapted neurons was similar to the mean of the non-adapted neurons. The study exposed that along with the adapted neurons that acquire the new selectivity on adaptation, the neurons far away from the adapted site also acquired a new selectivity. The authors also showed that this process a systematic progression that starts by the acquisition of new selectivity by orientation column at the site of adaptation and is automatically acquired by the neurons in the neighbouring column respect to its previous column. The authors named the phenomenon as ‘domino effect’. Therefore,
14
we assume that not only the neurons specific to a layer 2/3 change but all neurons down an orientation column change thereby exhibiting domino effect, consequently leading to whole cortex reprogramming.
1.9 Neuronal Connectivity within the primary visual cortex
The organization of synapses between neurons is fundamental to different brain functions. The dense and self-projecting local synaptic connectivity of neurons in the sensory cortex is not arbitrary. The connectivity patterns between cells have a role in the processing of specific brain regions. Neurons are anatomically connected through synapses. It was first exposed by (Sholl, 1956; Gilbert & Wiesel, 1979). In the visual cortex, a neuron carries tiny microscopic structures on the dendrites called spines. The spines keep on budding and shrinking in response to experiences (Alvarez & Sabatini, 2007). The study of modifying synapses have revealed that spines can emerge and disappear depending upon the input or may remain stable over a period (Kasai et al., 2010; Dur-e-Ahmad et al., 2011; Ebrahimi & Okabe, 2014; Jung & Herms, 2014; Hasegawa et al., 2015; Kellner et al., 2016). Thus, the cortex restores short- and long-term plastic changes.
Between neighboring neurons, e.g. within 100 micrometers in the supragranular layers of the cortex, neurons make up to 3-6 contacts with each other (Hellwig, 2000; Frick et al., 2008; Stepanyants et
al., 2008; Brown & Hestrin, 2009) whereas this probability may decrease substantially with distance (only one contact beyond 500 micrometers) (Hellwig, 2000). Neurons may also make lateral synaptic connections in the cortex. e.g., in the monkey prefrontal cortex, monosynaptic connections may exist between excitatory neurons across cortices (Melchitzky et al., 2001). The translation of sensory information from the outside world needs a coherent representation in the brain, and it is a due to the emergence of coordinated and harmonized firing activity of groups of neurons (Alivisatos et al., 2012). These groups of neurons that synchronize together to perform a computational task are called cell assemblies (Hebb, 1949). Several studies have reported the co-activation of small groups of neurons in response to applied stimuli (Fujisawa
15
et al., 2008; Buzsaki, 2010; Denman & Contreras, 2014; Schwindel et al., 2014; Bharmauria et al., 2015;
Bharmauria et al., 2016). Some have highlighted the significance of functional networks within these assemblies (Fujisawa et al., 2008; Buzsaki, 2010; Harris & Mrsic-Flogel, 2013; Singer, 2013; Denman & Contreras, 2014; Miller et al., 2014; Bharmauria et al., 2015; Carrillo-Reid et al., 2015; Bharmauria et al., 2016). While these studies have primarily demonstrated the existence of the cell assemblies in superficial layers, coordinated activities between individual neurons in superficial and deeper layers is not very well explored yet.
Although it has been known that the neocortex is anatomically and functionally columnar, the size of the neocortex, its cell composition, synaptic organization, expression of signaling molecules, and function of various types of ‘‘columns’’ are dramatically different to each other (Mountcastle, 1997). The basic repeating unit of the mature neocortex is the minicolumn. A minicolumn contains a narrow chain of neurons extending vertically across the cellular layers 2-6 and perpendicular to the pial surface (Mountcastle, 1978). Minicolumns contain essential different neural cell types, interconnected vertically. Many minicolumns form cortical columns. Columns only vary from 300 to 600 µm in diameter, across species even if brains differ in volume by a factor of 10 (Mountcastle, 1997). The laminar location of cortical neurons, their cell bodies, is determined during the development (Popovitchenko & Rasin, 2017). Neurons have complicated morphologies and properties that typically span multiple layers. Therefore, it is essential to refer to neurons from a specific layer. e.g. a neuron whose cell body lies in layer 5 will be known as layer 5 cell. However, this cell having its body in layer 5 is distributed across multiple cortical layers through its dendrites and axon. Thus, it is the merging of different components of neurons and connectivity patterns in the layered cortex that needs to be taken into account (Major et al., 2013). In cats, L1 consists mainly of axon terminals from subcortical sources synapsing onto apical dendrites of pyramidal cells whose somata and feedforward inputs to basal dendrites that are in deeper layers (Herkenham, 1980; Felleman & Van Essen, 1991; Binzegger et al., 2004; Rubio-Garrido et al., 2009; Cruikshank et al., 2012). Layer 2/3 and layer 5/6 work in parallel but independently in processing the stimuli. They are highly
16
interconnected eg. it was found in an in-vitro study (Thomson et al., 2002), that layer 3 pyramidal cell synapsed onto a large layer 5 pyramidal cell in cat V1.The structural study of the connections by the same group (Kisvarday et al., 1986) reported two layer 3 pyramidal cells axons in cat V1 synapsed with both superficial and deep layers with spiny cells and GABAergic smooth dendrites. In another study (Koestinger
et al., 2018) using serial section electron, microscopic reconstructions revealed a heterogenous postsynaptic
dendrite originating from both smooth and spiny neurons, indicating that the descending projection does not merely drive the layer 5 output cells, but participates in a complex circuitry in the deep layers. Distinct L5 populations are differentially connected with superficial layers and with each other that suggest the existence of distinct subnetworks within neocortical circuits (Lefort et al., 2009; Feldmeyer, 2012). It appears that although there is extensive interconnectivity between neurons in visual processing networks, there is certainly a bias observed towards connectivity with cells that share functional properties. Therefore, it was of interest to explore how neuronal connectivity exists between superficial and deeper layer neurons in response to adaptation protocols. For this purpose, to calculate the functional connectivity, cross-correlation computation was implemented.
17
Possible cross correlograms between two neurons (a reference and a target). A typical cross correlogram between two neurons, to interpret the relation between them, is obtained by keeping one of the neurons as
reference and calculating the spikes of the other neuron with reference to it (Bachatene et al., 2012).
Figure 1.5 displays possible patterns of cross correlograms between two neurons. The three examples illustrate the time relations between two neurons as revealed by shifted and corrected cross correlograms when one neuron is reference and the other is the target. To eliminate the possibility of stimulus-induced-relationship between two neurons, a shifted cross correlogram is obtained. A shift corrected cross correlogram is a histogram obtained by shifting the spikes of the reference cell by one or two cycles of stimulation. After this, the shifted cross correlogram is subtracted (corrected) to remove the stimulus-locked -component. Figure 1.5a corresponds to an example of a target cell projecting onto the reference cell. In this case, the target neuron fires few milliseconds before the reference cell since the peak of the cross correlogram appears few milliseconds before zero. This means that the target cell caused the reference cell to spike. Figure 1.5b corresponds to the reference cell projecting onto the target cell. In this example, the target neuron fires a few milliseconds after the reference cell as the peak of the cross correlogram can be seen a few milliseconds after zero. Here the target cell was excited by the reference cell. Figure 1.5c attributes to the synchrony between two neurons, as the peak straddles zero, or the peak can be seen on both sides of the zero. This indicates a common excitatory input to both neurons which probably is mostly from other neuron/ neurons. In all the three examples the peak is traced only within the 5 ms offset of zero as 5 ms has been the popular standard time window used to reveal the functional connections between the neurons (Alloway and Roy, 2002; Bharmauria et al., 2015; Bharmauria et al., 2016).
2.0 Plasticity at multisensory convergence regions
The processing of the real-world stimulus involves multiple senses and processing. This complex task takes place in the brainstem. Information from multiple sensory modalities meets at the superior colliculus to
18
direct eye movements and behavior (Sprague, 1972; Stein et al., 1980; Meredith & Stein, 1983). This is a dominant feature observed across species such as mammals (Stein et al., 1980), birds (Knudsen, 1983), reptiles (Hartline et al., 1978), and fish (Roeser & Baier, 2003). Multisensory integration depends upon sensory experience and develops by more experience e.g., after monocular deprivation vision may guide the spatial location of an auditory stimulus (Knudsen & Knudsen, 1985). The NMDA receptors play a significant role in mediating the expression of new neuronal responses induced by experience (Feldman et
al., 1996) while inhibitory circuits functionally suppress the original responses (Zheng & Knudsen, 1999).
This kind of early experience leaves a long-lasting effect even after normal sensory experience has been restored (Linkenhoker et al., 2005) which might explain the enhanced plasticity in adult owls (Knudsen, 1998). In mammals, interactions between superior colliculus (SC) and other associated multisensory areas has been very well studied and SC has been identified as the convergence zone of processing multisensory stimuli. The processing of visual and auditory representations in the SC also depends on the age and the experience (King et al., 1988; Wallace & Stein, 1997). In cats, integration in the SC is dependent on input from the anterior ectosylvian sulcus (AES) (Wallace et al., 1993; Wallace & Stein, 1994). This territory in the cortex contains cells that respond to unisensory and multisensory stimuli such as auditory, visual, and somatosensory stimuli (Wallace et al., 1992; Jiang et al., 1994). It has been demonstrated that reversible deactivation of AES reduces specific multisensory response enhancement without affecting a neuron’s modality-specific response (Jiang et al., 2001). Classically, this sort of multisensory integration was thought to occur in higher-order association cortices after primary unisensory processing (Felleman & Van Essen, 1991). More recently, it has been shown that multisensory integration can occur in areas previously suspected as unisensory. Visual and somatosensory processing has been reported in early auditory areas (Foxe et al., 2000; Schroeder & Foxe, 2002; Brosch et al., 2005), and individual neurons in cat visual cortex can be driven by auditory stimuli (Morrell, 1972). These results have challenged the traditional views of cortical processing (Wallace et al., 2004) and promote the fact that neocortex could be multisensory when interacting with the outside environment (Ghazanfar & Schroeder, 2006).
19
CHAPTER 2: HYPOTHESIS AND OBJECTIVE
2.1 Hypothesis
Neuroplasticity exists due to changing in response properties of the cortical neurons in response to a long-term occurrence of a visual input. Primary visual cortex (V1) has been the most studied area in the brain and the neurons here are inherently sensitive towards a feature. Neurons are grouped into small columns according to their response preferences towards that feature. These columns are systematically organised at regularly spaced intervals and cover the entire cortical representation of the visual field. V1 neurons responding to an orientation in different layers of the V1 give rise to the orientation columns that run down from layer 1 to layer 6. This property can be modified by enforcing different stimuli on the V1 neurons for different time intervals. Therefore, V1 neurons are magnificently plastic. Using plasticity of V1 neurons as a tool, visual neurons can be used to study the adaptation effects on the neurons by imposing a non-preferred stimulus. Layer 2/3 neurons or superficial layer neurons exhibit traditional shifts in the orientation selectivity measured by tuning curves. Since layer 5/6 neurons comprise of extensive dendritic trees, these neurons are believed to be the most important information processing units that constantly are found implicated in the neurons’ regulatory mechanisms. Despite several adaptation studies, it remains unexplored how these neurons respond to visual adaptation when stimulated simultaneously with layer 2/3 neurons at the same time down the column. Typically, visual information is received by layer 4 neurons from LGN and processed within the supra-granular layers (layer 2/3) of the visual cortex and then projected to deeper layer neurons (layer 5/6). Therefore, layer 2/3 and layer 5/6 neurons are the principal units in the cortical computational processing to make sense of the information flow within the cortical circuit. However, how the neurons in the two layers communicate with each other in response to the visual adaptation remains unexplored.
20
Sensory cortex has been assumed to be fundamentally multisensory due to varied observations as an outcome of comparative studies of responses when visual neurons were stimulated both by light and sound. It does not appear suspicious because visual neurons are inherently dominant to a visual stimulus, but by coupling the two different stimuli – audio and visual, enhanced response were observed by the same neurons that were exposed to only light (Atilgan et al., 2018). Recently, researchers have confirmed a modulation of the response in mice V1 neurons when excited indirectly by presenting a different sensory input (Ibrahim
et al., 2016). Primarily, these results had been observed in mice. Therefore, we wanted to explore how V1
neurons in cats, where the V1 organisation is columnar, respond to a prolonged adaptation with an auditory stimulus.
21
Figure 2.1
A model illustrating domino effect originating within the supragranular layers of the orientation columns and extending downwards to infragranular layers down the column.
22 Therefore, the two hypotheses are:
1) During adaptation, the entire orientation column is modified thereby exhibiting domino effect, that consequently leads to the whole cortex reprogramming.
2) Visual neurons when adapted with a repetitive sound stimulus, change their selectivity and attain new orientation preferences as a result of their multisensory properties.
2.2 Objectives
The above hypotheses lead to three objectives:
1) To investigate how the infra-granular cells (layer 5/6) respond to visual adaptation.
2) To cross correlate the spike trains of neuron pairs of layers 2/3 and layer 5/6 to reveal the functional connection and observe how adaptation affects this functional connectivity.
3) To investigate how acoustic stimulation impinges upon supra and infragranular neurons.
In the current study, we record supragranular and infragranular layer neurons simultaneously using a multichannel depth electrode contacting V1 at 300-500 µm and ~1100 µm and adapt the neurons under observation continuously uninterrupted for 12 min. The novelty of the current study lies in the fact that, neuronal activity from the adapted upper and deeper layer neurons of the cortical column has never been recorded simultaneously which underlines the importance of how neurons in a cortical column behave with respect to each other towards adaptation. This work is promising as it allows us to amplify our knowledge on the plasticity of adult brain which may have implications in the field of physiological and clinical studies such as neuromodulation by non-invasive brain stimulation (NBS), electro-convulsive therapy (ECT) and even be extended to neurological disorders by blocking further brain damage e.g. Stroke, Parkinson’s disease, Dystonia, (Thickbroom & Mastaglia, 2009).
Previous recordings in the primary visual cortex, using a similar approach, have led to a solid understanding of the behaviour of neurons towards adapter gratings for different durations of time. It has
23
been found that groups of neurons recorded from a recording site share similar orientation selectivity. In layer 2/3, it has been confirmed that group of neurons recorded from one site is affected by an identical mechanism in response to the external stimulus called ‘adapter’ (Nemri et al., 2009). Dragoi and authors (Dragoi et al., 2000) showed that neurons recorded (single-unit recordings) between cortical depths 500-1500 µm show a shift in orientation tuning in response to gratings (separated by 22.5°) when adapted for 2 min. This study also revealed that neuronal shifts are independent of cortical depth. Therefore, based on prior investigations, we suppose layer 5/6 neurons to attain new selectivity towards adaptation mechanism. More importantly, comparative results of simultaneously recorded neurons will be revealed as these will be one of the original results of this thesis. The depth criteria for the two layers will be estimated mainly by LFPs patterns and multiunit neuronal activity. Together these physiological methods will give an insight into the understanding of interlayer interactions in response towards adaptation.
It is apparent from present-day investigations that apart from the layer-specific differences in morphological features, many functional properties of neurons are also dependent on cortical layer or cell type. Besides, the cortical columnar microcircuitry is viewed as a block of interconnected yet distinct neuronal networks in which each layer possesses somewhat unique patterns with different inputs, projection targets, and feedback connections (Mountcastle, 1997, Callaway, 1998, Douglas and Martin, 2004, Harris and Shepherd, 2015). Therefore, we might observe some differences from the expected results.
Further insights would be gathered by testing responses of visual neurons towards sound stimulation. Whether the visual neurons respond towards sound? How will visual adaption differ from an auditory adaptation of visual neurons? Will sound increase or decrease the potential plasticity in our model? The results would be highly significant as the adaptation protocols can be compared with respect to the tuning properties of the visual neurons, and new insights can be gathered for future explorations.
Neurons sharing orientation preference are mostly connected with each other and are represented by the iso-orientation domains in an orientation map. Neurons situated close to pinwheels are connected to neurons
24
having a wide range of orientation preference (Maldonado et al., 1997; Schummers et al., 2004). This investigation is based on electrophysiological recordings; therefore, we might observe some differences due to the fact that the locations of neurons in the orientation map can affect their shift amplitude, the direction of shift, etc. This study focuses more toward a comparison between the global response pattern of supra‐ and infragranular neurons and not on response behaviour of an individual neuron. However, on a more in-depth examination, individual cells might display different responses.
Presently, using similar strategies, new results have been exposed in rodents. Using electrophysiology Ibrahim and co-authors (Ibrahim et al., 2016) have demonstrated sharpening of orientation tuning curves towards an auditory stimulus. Iurilli and colleagues (Iurilli et al., 2012) have also revealed that the presentation of a high-amplitude sound stimulus resulted in the hyperpolarization of the membrane potential of V1 neurons resulting in inhibition.
25
CHAPTER 3: COMPARATIVE EFFECTS OF
ADAPTATION ON LAYERS II- III AND V-VI NEURONS
IN CAT V1
Chanauria Nayan1, Bharmauria Vishal1,2, Bachatene Lyes1,3, Cattan Sarah1, Rouat Jean1,4, Molotchnikoff Stephane1
1Neurophysiology of Visual System, Département de Sciences Biologiques, Université de Montréal, CP 6128 Succursale Centre-Ville, Montréal, QC, H3C 3J7, Canada.
2The Visuomotor Neuroscience Lab, Centre for Vision Research, Faculty of Health, York University, Toronto, ON, Canada.
3Department of Nuclear Medicine and Radiobiology, Faculty of Medicine and Health Sciences (CHUS), SNAIL | Sherbrooke Neuro Analysis and Imaging Lab, University of Sherbrooke, Sherbrooke, QC, Canada. 4Département de Génie Électrique et Génie Informatique, Université de Sherbrooke, Sherbrooke, QC, Canada
(This is a published article in the European Journal of Neuroscience)
26
3.1 Abstract
V1 is fundamentally grouped into columns that descend from layers II–III to V–VI. Neurons inherent to visual cortex are capable of adapting to changes in the incoming stimuli that drive the cortical plasticity. A principle feature called orientation selectivity can be altered by the presentation of non‐optimal stimulus called ‘adapter’. When triggered, LGN cells impinge upon layer IV and further relay the information to deeper layers via layers II–III. Using different adaptation protocols, neuronal plasticity can be investigated. Superficial neurons in area V1 are well acknowledged to exhibit attraction and repulsion by shifting their tuning peaks when challenged by a non‐optimal stimulus. Layers V–VI neurons in spite of partnering layers II–III neurons in cortical computation have not been explored simultaneously toward adaptation. We believe that adaptation not only affects cells specific to a layer but modifies the entire column. In this study, through simultaneous multiunit recordings in anesthetized cats using a multichannel depth electrode, we show for the first time how layers V–VI neurons (1000–1200 μm) along with layers II–III neurons (300– 500 μm) exhibit plasticity in response to adaptation. Our results demonstrate that superficial and deeper layer neurons react synonymously toward adapter by exhibiting similar behavioral properties. The neurons displayed similar amplitude of shift and maintained equivalent sharpness of Gaussian tuning peaks before and the following adaptation. It appears that a similar mechanism, belonging to all layers, is responsible for the analog outcome of the neurons’ experience with adapter.