HAL Id: hal-02950490
https://hal.inria.fr/hal-02950490
Submitted on 28 Sep 2020
HAL is a multi-disciplinary open access
archive for the deposit and dissemination of sci-entific research documents, whether they are pub-lished or not. The documents may come from teaching and research institutions in France or abroad, or from public or private research centers.
L’archive ouverte pluridisciplinaire HAL, est destinée au dépôt et à la diffusion de documents scientifiques de niveau recherche, publiés ou non, émanant des établissements d’enseignement et de recherche français ou étrangers, des laboratoires publics ou privés.
Forensic Analysis of Network Attacks: Restructuring
Security Events as Graphs and Identifying Strongly
Connected Sub-graphs
Laetitia Leichtnam, Eric Totel, Nicolas Prigent, Ludovic Mé
To cite this version:
Laetitia Leichtnam, Eric Totel, Nicolas Prigent, Ludovic Mé. Forensic Analysis of Network Attacks: Restructuring Security Events as Graphs and Identifying Strongly Connected Sub-graphs. WTMC 2020 - International Workshop on Traffic Measurements for Cybersecurity, Sep 2020, Genova, Italy. pp.1-9. �hal-02950490�
Forensic Analysis of Network Attacks: Restructuring Security Events as Graphs
and Identifying Strongly Connected Sub-graphs
Laetitia Leichtnam CentraleSupelec, Univ. Rennes, IRISA,
France
Eric Totel IMT Atlantique, IRISA, Rennes, France
Nicolas Prigent LSTI, St-Malo, France
Ludovic M´e INRIA, Univ. Rennes,
IRISA, France
Abstract—When analyzing the security of activities in a highly distributed system, an analyst faces a huge number of events, mainly coming from network supervision mech-anisms. To analyze this huge amount of information, the analyst often starts from an indicator of compromise (IoC), an observable that suggests that a compromise may have occurred, and looks for the information related to this IoC as it could help to explain the related security incident. This approach is referred to as forensic analysis.
In this paper, we propose an approach to treat automat-ically network events to provide the analyst with a new way to determine the subset of information related to a given IoC. This approach relies firstly on the generation of graphs between so-called “Security Objects” that are built from the logged network events, and secondly on the automatic processing of these graphs based on graphs communities analysis.
1. Introduction
In this paper, we are interested in information systems such as those used by almost all human organizations, companies, universities, or large institutions. These sys-tems are made up of client or server computers, interacting through a network. They can be attacked, from outside, or even from inside the organization. Attacks range from denial of service by flooding to targeted exfiltration of confidential data.
In these highly distributed and versatile environments, security supervision is an important service that comple-ments deployed preventive security mechanisms.
Security supervision produces a large number of net-work events. The diversity of communication protocols generates numerous log files with a wide variety of for-mats. In addition, these log files are not explicitly linked to each other. It is therefore difficult to obtain an overall view of the network’s activities.
In order to exploit this large volume of heterogeneous information, the security analyst usually starts from an indicator of compromise (IoC), i.e., an observable that suggests that a compromise may have already occurred. Examples of such IoC are a particular IP address or a particular file name found in some network events. The analyst looks among all the available log files for any information related to this IoC and that could help him or her analyzing the security incident that led to this indicator. This approach is referred to as forensic analysis.
To help the analyst in this forensic analysis, there is an important need for (1) a representation of data able to highlight relations between events and (2) reducing the number of events to analyze by selecting only relevant information.
To fulfill these two objectives, we firstly propose a new graph-based representation of network events through so-called Security Objects (SO). SOs are the nodes of the graph and are composed of especially interesting attributes coming from the various network events. Each attribute corresponds to a type of information that is important from a security point of view. The value of a given attribute is derived from the value of a given field of a given security event found in log files. We consider various types of logs to take into account the heterogeneity of network connections: TCP, HTTP, DNS, etc. Links between SOs indicate that the SOs have been derived from the same event. By construction of the graph, security-relevant information present in several events appears only once in the graph. Consequently, this information allows to create links between SOs from several events and thus to represent the links between these events. The SOs graph thus gives a unified and rich vision about what happened on the network, which is much more interesting for the analyst than a collection of heterogeneous and unrelated logs files.
We secondly propose a process to identify among these SOs information related to a given IoC. We hy-pothesize that normal activities produce events that can be related to each other in various types of log files. This should result in strongly connected sub-graphs in the SOs graph. In addition, attacks typically consisting of a few with rare or unusual attributes (for example, a new source address) should, therefore, be only weakly linked to the rest of the graph. The events related to the attack and therefore the SOs coming from these events should on their side be strongly connected. The identification of strongly connected sub-graphs in our global SOs graph should, therefore, allow to identify normal activities and to highlight attacks.
To evaluate this approach and validate this hypothesis, we present in this paper the results of experiments carried out on the CICIDS 2017 dataset.
The contributions of this paper thus consist of:
• a unified model for SOs, allowing a unique and unified representation of various kinds of network events;
• a graph representation of this model (SOs graph) that represents important security-related relation-ships between security events;
• a sub-graph identification approach based on
com-munity detection, to identify information (that is to say sub-graphs) related to IoCs;
• experimental results on the CICIDS 2017 dataset. These experiments are therefore based on a pre-existing public dataset. The data do not contain any personal information. It was not necessary to obtain authorization from the ethics committees of our various institutions.
This paper is organized as follows: Section2describes SOs graphs and explains how they are built from net-work events. Section 3presents the automatic extraction of normal and abnormal subgraphs through community detection techniques. Section4presents an assessment of the approach. Section5presents related work. Finally, sec-tion6concludes this paper, summarizes its contributions, leverages some limitations, and presents future work.
2. Building security object graphs from
net-work events
We propose in this paper a restructuring of event logs coming from network sources to emphasize subsets of attributes that are of interest in a security perspective. To do so, we use a graph structure defined as G = (V, E) with V being the set of nodes and E being the set of edges. In this section, we first define nodesV as security objects and present how we build the set of edges E among these security objects to capture the semantics of a given event log. Then, we explain how we build the global graph representing all security events present in our log files.
2.1. From a security event to security objects Each log file can be described as a sequence of n ordered events {e1, e2, ..., en} where ei is an event
re-sulting from the observation of an action in the network at timestamp tei in the system, with the property that
tei ≤ tei+1. Working with logs from a classic computer
network (i.e., no IoT devices for example), we suppose that the clocks of the computer are synchronized using a Network Time Protocol. In our approach ei are network
events.
Each logged event is made of several fields that differ depending on its type. An eventeis therefore a sequence of natt(e) fields such as e = {atti(e)}1≤i≤natt(e) where
atti(e)is theith field of evente.
According to the NIST, an indicator of compromise is a “technical artifact or observable that suggests an attack is imminent or is currently underway, or that a compromise may have already occured” [13]. As example, the authors cite IP address, Domain name, Url or File hash. Similarly, threat intelligence platform like MISP or OTX propose IoC of types Domain, Email, FileName, Hostname, IPv4, URI, etc.
Some of these kinds of information are available in the fields of the network events we handle: IP Address, MAC Address, URI, Domain name and Filename. These
fields are thus particularly relevant to establish links be-tween events. For each type of event, we select the fields corresponding to these kinds of information to create one or several Security Objects (SOs). A SO is thus a set of attributes, each attribute corresponding to a particular event field.
For each type of event, we designed a translation into a set of SOs. For example, a network connection leads to four SOs: a source IP Address SO, a destination IP AddressSO, a Destination Port SO and the NetworkConnectionSO itself. This last SO regroups attributes corresponding to the fields we identified as less important to create relations between events. For instance, the payload size attribute is captured as a mere attribute of the NetworkConnection object since there is no reason to believe that two events having the same payload size are linked. By contrast, two events where the same IP addresses appear can be linked with high probability. Generally speaking, all general information related to a network connection, such as the number of packets exchanged or the duration of this connection, is carried by attributes of the object representing this connection.
In addition to network connections, we also have specific SOs for other network event related to specific protocols (HTTP, DNS, etc.) as these events contains attributes which we also need to keep track of.
More formally, Security Objects deduced from an event e are a set of nobj SOs such
as eobj = {oi(e)}1≤i≤nobj with each SO oi(e)
defined as a set of natt(oi) attributes such as
oi(e) = {attj(oi(e))}1≤j≤natt(oi). By definition,
eobj corresponds to the subset of every fields of an event
e :eobj =S nobj
i=1{{attj(oi(e))}1≤j≤natt(oi)}.
By construction, the set of SO attributes is included in the set of events attributes and the following properties are true:
• Tni=1objoi(e) = ∅, i.e., for a given event, the SO
attribute sets are disjoint;
• Pni=0objnatt(oi)≤ natt(e), i.e., SOs can retain only
a subset of the event attributes.
Each event leads to some security objects. So as to preserve information related to a given event, links are created between security objects coming from this event. Let l ∈ E be a link between two nodes a and b. l is defined by the quadruplet (a, b, ltime, ltype). ltime refers
to the timestamp of the event andltypecorresponds to the
type of the link. For example, if a network connection is logged at timestamp t0, a NetworkConnection object is
created and linked to an IPAddress: this link is of type has src addressand has its attribute timestamp set tot0.
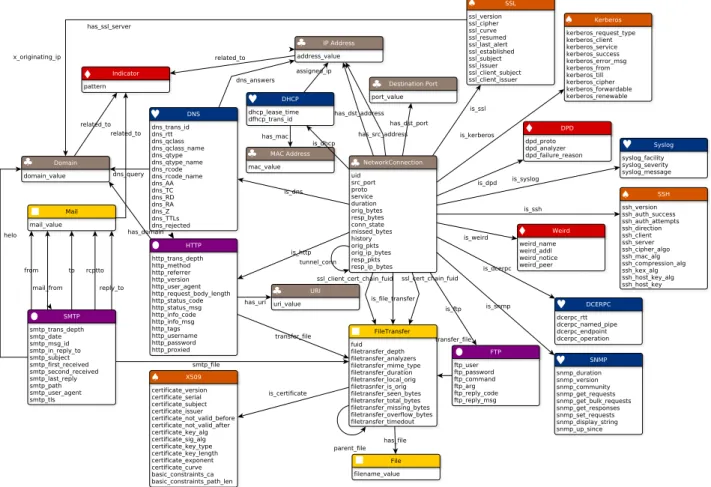
Generally speaking, the type of links between SOs are the links represented on Figure1. The semantic of these links is derived from the CybOX model [2].
The various SO categories, their respective attributes and their links are represented on Figure 1. For clarity, colors and symbols are used in the figure to identify the various categories of SOs. In details, Network objects (¨ in grey) such as IP address or port number can highlight possible port scan or virus spreading from host to host. Network Servicesobjects (ª in blue) such as DNS repre-sent common target as they can paralyze a whole network. Well known attacks on these system are DHCP spoofing or
♠ ♠ ♠ ♠ ♣ ♣ ♣ ♣ ♣ ♣ ♥ ♥ ♥ ♥ ♥ ♦ ♦ ♦
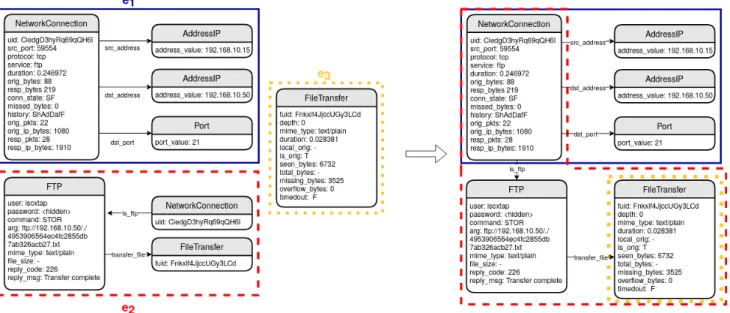
Figure 1: (left) Building of sub-graphs from three events, (right) Complete graph issued from three events DNS Poisoning and Spoofing. File Transfer objects (n in
yellow) such as file checksum or mail object are valuable to detect an attack campaign and are a common way to spread viruses by sending executable file. Application Services objects (l in violet) allow to capture specific characteristics of popular application such as http referrer that can be symptomatic of a CSRF attack [3]. Security Services objects (« in orange) such as invalid certificate can be indicators for a Man-In-the-Middle attack or a brute-force attack. Finally, Alerts objects (© in red) rep-resent potential attacks detected by an IDS or protocol anomalies detected in the monitored network. We include in this category the Indicator SO that corresponds to an Indicator of Compromise i.e., an artifact observed on a network that indicates an intrusion with high confidence, as well as the Weird SOs that corresponds to an alert issued by an anomaly detector.
2.2. From a set of heterogeneous log events to a graph of security objects
To build the graph, we take as an input a set of network events. From each event, and according to it type, we extract the SOs and the links between them. In other words, we first build a subgraph representing this event.
We then take each SO of the subgraph. If this SO already exists in the global graph (for instance, the same IPAddresswas already identified in a previous event), we replace the SO in the new subgraph by the SO that already exists in the global graph. Therefore, if an event contains
an SO that was already found in a previous event, the subgraph that represent it will be linked to the global graph trough this SO. In detail, we have selected nine types of objects to link events together. These are IP addresses, domain names, destination ports, file names, URIs, MAC addresses, email addresses and connection and file transfer identifiers (often assigned by network analyzer). We insist on the fact that it is the type of object that is taken into account. Thus, an IP address object present in a connection log as the source address and in a DNS resolution as the requested IP address will make the link between the two events regardless of its meaning in the log. The only exception is the port, which must be a destination port. Indeed, a correlation rule between two events with a source port and a destination port is of little interest from a security point of view. The choice of these objects comes partly from the study of the types of IoCs frequently used and partly from the experience of security analysts.
As an example, let’s consider three log events ex-tracted from the Zeek [23] analysis of the CICIDS2017 dataset [29]. The three log events represent the same FTP connection analyzes by different modules of the Intrusion Detection System. The first evente1 is a report
on the TCP network connection from the IP address 192.168.10.15 to the IP address 192.168.10.50 on port 21. The second event e2 gives the details of
the FTP reply. The third event e3 corresponds to file
transfer details. A graph for each of these three events is represented on the left hand of Figure2. We represent the
Figure 2: Complete Security Objects and Relations Model Representation global graph composed of six SOs and obtained from the
three previously described sub-graphs on the right hand of the figure: the first event is colored in blue surrounded by a solid line (e1), the second is in red surrounded by a dotted line (e2) and the third is in yellow surrounded by a small dotted line (e3).e1 ande2 shares a reference
to the same NetworkConnection SO (same uid value) ande2ande3share the same FileTransfer SO (same
fuid value). By combining the different log files, the graph makes possible to deduce relationships within different log events and thus to learn more complex patterns.
3. Discovering communities in graphs for
identifying normal activities and highlighting
attack-related sub-graphs
Recall that our hypothesis is that normal network activities are more likely to be represented by strong, interconnected communities of objects, such as hubs. At-tacks typically consist on their side of a few events with rare attributes (for example, a new source address) and will, therefore, be represented by decentralized SOs in the graph. SOs generated from attribute values containing ev-idence of the same attack are strongly linked by construc-tion. Accordingly, identifying an attack in an graph of SOs consists in identifying dense sub-graphs surrounding an Indicator-type SO and isolated from large hubs (assumed to be normal activities) of this graph. An indicator or alert is used as a weak signal to select communities of interest. Indicators do not all have the same confidence index and alerts can be false positives. Nevertheless, the presence of more than one of these indicators within a community may indicate an attack. Conversely, the selection of elements close to an indicator or alert within the graph can facilitate the analysis of security experts and help eliminate false positives.
In the social analysis domain, research have been carried out to identify people strongly connected to similar people but relatively isolated from others. These groups of people are called communities and techniques to find
them are named community detection algorithms. This kind of algorithm is based on the modularity maximization method first presented in [21]. Modularity Q is defined as follows : Q = 2m1 P
i,j[Aij − kikj
2m]δ(ci, cj), where
Ai,j represents the weight of the edge between oi and
oj, ki =PjAij is the sum of the weights of the edges
attached to vertexoi,ciis the community to which vertex
oi is assigned, the δ-function δ(u, v) is 1 if u = v and
0 otherwise and m = 12P
ijAij. The maximization of
the modularity measure allows separating the nodes into communities. Graphs with high modularity have dense connections between the nodes within the same commu-nity, but sparse connections between nodes in different communities.
Finding communities in a graph is known to be an NP-hard problem. The Louvain algorithm [4] is a widely used greedy optimization method for modularity maximization that runs in timeO(n log n)and is, therefore, more suit-able for large graphs. In addition, it does not require to specify in advance the number of communities to be found. The Louvain algorithm works as follows : first, it looks for small communities by optimizing modularity locally. Then, it groups the nodes belonging to the same community and builds a new graph whose nodes are the communities. These steps are repeated iteratively until a maximum modularity is achieved.
Another commonly used technique for community detection is the label propagation techniques [26]. Initially, each vertex is assigned a different label. After that, each vertex chooses the dominant label in its neighbourhood in each iteration. Ties are broken randomly and the order in which the vertices are updated is randomized before every iteration. The algorithm ends when vertices reach a consensus. In [19], the authors compare the Label Propa-gation algorithm and the Louvain algorithm. They found that if the Label Propagation algorithm is slightly faster than the Louvain algorithm, the Louvain algorithm has better results in finding communities.
A third community detection algorithm, the fastgreedy community detection algorithm [6] merges individual
nodes into communities in a way that greedily maximizes the modularity score of the graph. This algorithm is said to run almost in linear time on sparse graphs.
We also evaluated other community detection algo-rithms, namely infomap [28], spinglass [31] and walk-trap [25], but we didn’t retain them for our experiments because the first one generated too many small commu-nities and the two last were too slow.
4. Implementation and experimental results
We used Gremlin [27] to implement the construction of the graph and Python to implement the community detection. We used a Janusgraph database [30] with an external index backend, Elasticsearch, and a Cassandra [5] storage backend to store the graph data. We choose these technologies for scalability, as they are adapted to large graph databases. All our experiments were carried out with a Linux machine with 8 GB RAM.
Results are evaluated through two criteria. First, we evaluate attack detection relevance: our approach must allow reducing the number of objects to inspect without removing relevant information for the analyst such that he or she can visualize all objects related to an IoC. Second, we evaluate scalability: a large quantity of events is gener-ated at each time unit. The time needed to build the global graph must not be greater than the time during which events are produced. Our graph generation algorithm will be scalable if its execution time, for a given set of events, is much shorter than the production time of these events. In the following sections, we first introduce the dataset we used and evaluate the relevance of our approach with three community detection algortihm, i.e,. Louvain algo-rithm, Label Propagation an fast greedy algorithm. We then evaluate the scalability of the approach and discuss its strength and limits.
4.1. Choice of the dataset
To evaluate the effectiveness of our model, we used the CICIDS2017 dataset [29]. It is made of five pcap and csv files generated by the Canadian Cybersecurity Institute in the University of New Brunswick. It contains five days of mixed traffic, part being benign and part being attacks such as DoS, DDoS, bruteForce, XSS, SQL injection, infiltration, port scan and botnet activities. It is a recent dataset that models a complete network configuration with components such as firewalls, routers, modems and a variety of operating system such as Windows, Ubuntu Linux or Macintosh [8]. It corresponds to a realistic set of protocols (HTTP, SMTP, etc.) and a variety of attacks are covered. The dataset is also labelled, allowing to evaluate results.
We first generated log files from the capture files with the Zeek IDS tool [23], that is able to generate network and application logs such as connections, http communica-tions or file transfers. The default configuration was used. Details about the dataset and the number of generated events are presented in Table 1. We also generated alerts with the Suricata IDS using the EmergingTreats rules package.
4.2. Attack detection relevance
The first criteria of evaluation is the relevance of attack detection, and thus the relevance of the objects selected by the Louvain algorithm. To our best knowledge, there is no previous evaluation of data reduction and attack analysis with a graph-based model on the CICDS2017 dataset.
We define False Positives (FP), False Negatives (FN), True Negatives (TN), and True Positives (TP) as follows: FP are edges wrongly selected, FN are edges that do not appear in the selected graph but that are part of an attack, TN are edges not selected in the graph and that are not being part of an attack and finally TP are edges correctly selected.
To compute these values, we need to know which links in our graph correspond to events generated by an attack and which links correspond to normal traffic. In the CICIDS2017 dataset, an event is labelled with the type of the attack. We use the labels as follows: if an event is part of an attack, we add an ”attack” attribute equals to ”1” to all links in the subgraph representing that event. Otherwise, we add an ”attack” attribute equals to ”0”. The feature attack is then used to compare the set of edges selected by the community detection algorithm and the set of edges having the attack attribute set to ’1’.
To evaluate the efficiency of the model and the com-munity detection methods, three common measures are used : Precision, Recall and F1-score. These measures are based on the FN, FP, TN and TP scores.
• Precision corresponds to the percentage of cor-rectly retained edges divided by the set of re-tained edges. It tends to 1 if only malicious edge are added to the selected graph. P recision =
T P T P + F P
• Recall corresponds to the percentage of correctly retained edges divided by the set of truly mali-cious edges. It tends to 1 if no malimali-cious edge is forgotten.Recall = T P
T P + F N
• F1-score takes into account both precision and recall. While accuracy measures the proportion of all correctly labelled edges over all edges, we choose to use The F1-score metric that is more suitable when there is an imbalanced class dis-tribution (which is often the case in the security field) and when the reduction of false negative and false positive is more important.
F 1 − score = 2 ∗ P recision ∗ Recall P recision + Recall
To evaluate whether our proposal is able to correctly retain relevant object and relation, we built seven graphs, each corresponding to a half day of traffic involving attacks. The attacks retained for the evaluation are : FTP brute force, SSH brute force, Heartbleed, Web attack, Infiltration attack, ARES Botnet and Portscan.
We then perform community discoveries on each graphs and retain community containing the majority of IoC or IDS alerts. We use the igraph implementation of Louvain [4], Label Propagation [26] and fast greedy [6] algorithms to evaluate the ability of each algorithm to select relevant subgraphs containing events related to an attack.
Date Attacks Nb of packets Nb of alerts/IoC Nb of Zeek events 3rd July ∅ 11.709.971 79 1.162.527 4th July BruteForce: FTP Patator, SSH Patator 11.551.954 2511 995.213 5th July DoS/DDoS: slowloris, slowhttptest, Hulk and GoldenEye, Heartbleed Attack 13.788.878 77 1.474.868 6th July Web Attacks: Web Brute Force, XSS and SQL Injection. Infiltration attacks:
exploit metasploit, Cool disk
9.322.025 25.973 1.019.783 7th July DDoS LOIT, Botnet ARES, PortScans 9.997874 365 1.374.021
TABLE 1: Description of the dataset and number of security events generated from the network capture files per day.
Algorithm Precision Recall F1-score Fast greedy 0,683 0,382 0,490 Louvain 0,943 0,633 0,757 Label Propagation 0,969 0,778 0,863
TABLE 2: Synthesis of Precision, Recall and F1-score results per community discovery algorithm
The results of Precision, Recall and F1-score presented in Table2show that the Label Propagation method is the best method for Precision, Recall and F1 before the Lou-vain algorithm and the fast greedy method from Clauset et al. The results for Precision are particularly good (0.943) indicating that the graph model associated with the Label Propagation method allows the majority of events related to an attack to be selected within the same community. This is an interesting result because it shows that our approach allows us to identify an important part of the information related to an attack. Moreover, the Recall results for the same algorithm (0.778) show that it allows us to well isolate the events related to an attack from the normal events. Again this is an interesting result because it shows that our approach will not drown the analyst with useless information not linked to an attack.
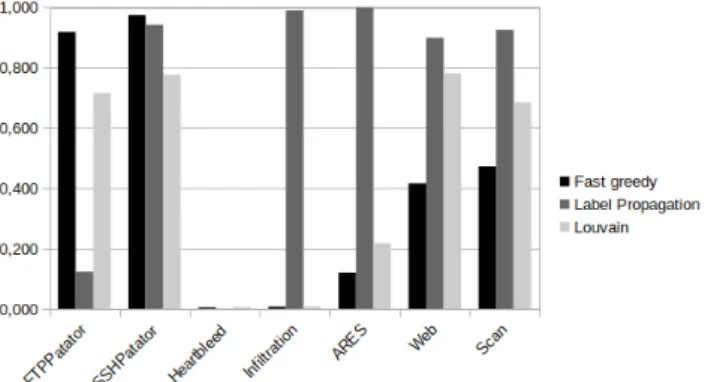
In Figure3and4, we compare the results of Precision and Recall for each type of attack and for each algorithm.
Figure 3: Values of Precision per attack’s type for different community detection algorthm
For the Precision, the Label Propagation algorithm performs well on all types of attack (precision greater than 0.9) except for FTPPatator and Heartbleed. Moreover, it is the only algorithm that performs well on Infiltration and ARES attack. The Louvain algorithm performs well on FTPPatator, SSHPatator, Web attack and Portscan. The Heartbleed attack is the only attack for which no algorithm has shown good results. Indeed, only 29 edges of the graph are related to this attack out of the 132.646 edges representing network connections that take place during the attack. The Louvain algorithm was the most precise in selecting 4852 edges i.e. 3,6% of the total edges of the graph.
For the Recall, the Louvain algorithm performs well on all types of attack (recall greater than 0.8) and is only
Figure 4: Values of Recall per attack’s type for different community detection algorthm
outperformed by Label Propagation algorithm for the Web attack and the PortScan. As these attacks are massive, this explains why the Label Propagation algorithm shows globally better results than Louvain. However, the Label Propagation shows bad resuls for the ARES attack (0.340) and only average results for the Heartbleed attack (0.621) and the Infiltration (0.669). The Louvain algorithm is thus a better choice to consider multiple types of attack.
In summary, depending on the supervisory context, the Label Propagation algorithm would be a better choice if the goal is to eliminate a large number of false positives and the Louvain algorithm a better choice if the goal is to not miss any attacks. Of course, these results are related to the data we used. They will therefore have to be confirmed by the same study on other data.
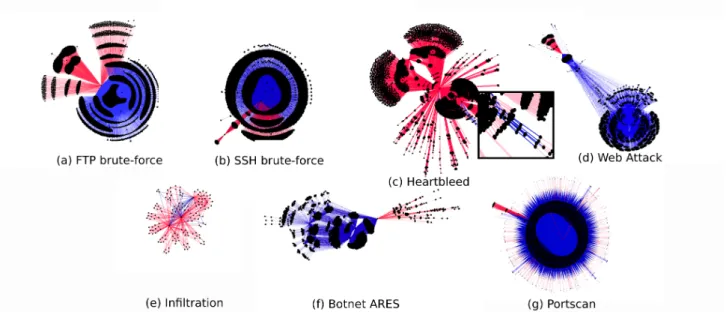
We note here that the way in which we represent the data, in the form of a graph, brings also an additional advantage as it allows to graphically present results to the analyst. The visualization of graphs allows to observe the links between nodes and especially communities. Indeed, the densely linked structures are highlighted thanks to a force-based layout. This layout brings together nodes that are strongly connected to the same set while isolating less densely linked structures as if a repulsive force was applied to these nodes. In Figure5, we show as an exam-ple the communities selected with the Louvain algorithm. Blue lines correspond to edges with feature attack set to ’1’, i.e. correctly selected edges. Red lines correspond to edges with feature attack set to ’0’, i.e., wrongly selected edges. The displayed subgraphs show that objects build upon the same attack are densely connected. The brute-force attacks (ftp and ssh), web, botnet and port scan can easily be identified in the set of selected edges but would have been obfuscated in the whole graph composed of millions of edges. We can see that all nodes representing events related to an attack form concentric circles. The center of these circles corresponds to the source IP of the attack and/or the destination port used for Ssh-Bruteforce and Ftp-Bruteforce attacks. Note that the mislabeled links
Figure 5: Subgraph issued from different types of attacks. (in red) form distinct substructures in all cases except for
the Heartbleed and Infiltration representations. The Infil-tration attack is more difficult to identify in the community selected but the subgraphs contains only 386 edges to relate to the millions of nodes composing our graph. For Heartbleed, here again the nodes and edges representing the attack are difficult to identify because on the one hand they are few in number and highly related to the other nodes.
4.3. Scalability
To evaluate the scalability of our proposal, we used the whole CICIDS2017 dataset [29] containing the network events for five days. We used the graph-oriented database Janusgraph and a gremlin script working on a single thread to generate the graph, representing more than 6 millions of events. In total, more than 6.2 million nodes were generated.
Figure 6: Time to perform graph generation according to the number of events
The generation of graphs with millions of nodes rep-resenting 56 hours of network traffic only took 4 hours. Our graph generation algorithm is therefore scalable, its execution time being much shorter than the production time of the corresponding events.
Figure6shows the time required to generate a graph according to the number of events. It was obtained by measuring the time elapsed from the beginning of the
generation to see if the generation time was constant over time (linear) or proportional to the number of nodes/edges in the graph. The trend curve associated to the measures indicates that the time complexity is polynomial with the following equation :f (x) = 4.8e−10x2+ 0.0027x + 387.
The algorithm therefore runs in timeO(n2).
An analysis of our graph creation algorithm shows that the most expensive operation, which explains this com-plexity in O(n2), is the research on the whole database for already existing nodes.
4.4. Limitations
Among all the communities discovered, a selection criterion should enable us to choose the communities most likely to contain objects related to an attack. The strategy adopted in this paper is to select communities contain-ing compromise indicators or intrusion detection system alerts. However, this assumes that alerts or indicators have already been detected by third-party systems. In our future work, we will focus on finding alternative strategies for selecting communities of interest. One of the preferred approaches is the unsupervised detection of anomalies within communities.
The main hypothesis of this paper is that the attacks are dense sub-graphs isolated in the graph. We have shown that the structure alone can isolate large attacks such as scans, DoS or brute force attacks. It also allows to isolate more discrete attacks forming isolated structures. However, a discrete attack such as Heartbleed remains more difficult to isolate if the SOs that represent it are also present in normal times. In a future work, we will be interested in the properties of each object in order to group the objects into communities not only using the structure of the graph but also by focusing on the properties of each node.
5. Related work
In this section, we position our work in relation to sim-ilar approaches in the literature. Our contributions being a
graph model allowing a unique and unified representation of various kinds of network events and a sub-graph iden-tification approach to help a forensic analyst to identify information related to a given IoC, we firstly consider in this section pieces of work that handles security-related information, and secondly pieces of work that used graph to perform forensic analysis.
5.1. Handling security related information STIX (Structured Threat Information eXpression) [1] is a language to represent information related to cyber threats. It allows to describe numerous aspects of an attack such as the identity of the attacker or the group of attackers when it is known,the sequence of the actions performed by attackers, also called TTPs (Tactics, Techniques and Procedures) and the name of the campaign it is related to. To describe events, STIX includes a language called CybOX that provides a common structure for representing security related observables. Examples of observables are an email received from a specific address, a network connection established toward a specific address, or the MD5 hash of a file. STIX is the first significant unified language able to represent both external threat intelligence and internal observables. However, it is not designed to represents all possible network events but only those that are already identified as related to an attack. Note that Onwubiko proposed an ontology [22] for analysis in Security Operations Centre based on the same principles. Our approach is similar to STIX and CybOX as it merges different types of security-related pieces of data in a unique model. However, our proposal differs from STIX and CybOx objects since it allows to represent all events in a forensic analysis perspective. STIX and CybOX represents only information related to an attack. 5.2. Using graph for analyzing security events
Various security event analysis or reduction techniques based on graphs have been developed. There are three main trends in the representation of security events in the form of a graph.
The first trend focuses on communication between devices. In [17], network-related data are represented by topological graphs with nodes representing hosts and links representing network communication between hosts. BotTrack [7] creates a dependency graph between hosts to identify malicious network connections. Similarly, BotGM [16] and BotGrep [20] identify abnormal network traffic using graph-based mining techniques. These three approaches then use clustering, PageRank algorithm or statistical-based mining techniques on graphs to identify abnormal network traffic. These pieces of work only fo-cuse on botnet activities when we are able to consider any kind of attack. The types of graphs they rely on are very different from ours.
The second trend build graphs of events (i.e., nodes of the graphs are events) and analyse them. For that perspective, we are closer to this trend. Xu et al. [33] exploit the dependency among system events to reduce the number of events to analyze. King and Chen [14], as well as Goel et al. [10], propose to reconstruct a chain of events in a dependency graph to perform intrusion analysis. To
discover attacks inside systems, Hossein et al. [11] use sequences of system calls to build attack graphs and detect the root cause and the attack steps. In [18], Milajerdi et al. use audit logs to reconstruct the history of attacks using traces from common Advanced Persistent Threat attacks. Kobayashi et al. [15] use syslog events to infer causal-ity between securcausal-ity system events. These proposals are however limited since they only consider one type of event format. This contrasts with [32] in which the authors propose to discover causal dependency in heterogeneous events to detect multi-steps attacks. Hercule [24] models network log entries also coming from multiple sources of data as nodes in a graph. A node in a Hercule graph describes all the attributes of an event and edges are based on a predefined set of rules such as the fact that two nodes share the same value for semantically-related attributes. Clustering techniques are then applied to detect clusters containing indices of compromission manually labelled by the analyst. We do not directly links events as Hercule does. Instead, we define links between SOs, which are deduced from the event log entries. Our approach scales to millions of events since each possible value for any attribute is represented only once. This made it possible to conduct our experiments with heterogeneous and vo-luminous network data, whereas Hercule was only tested with logs capture on a single host. Moreover, Hercule is restricted by the 29 correlation rules they defined to links events.
Finally, the third trend is based on the selection of frequent attributes in the events. For example, in [9], Glatz and al. propose a visual representation of network flows with two types of nodes. The first type corresponds to communication attributes, e.g., IP addresses or port num-bers, and the second type corresponds to the percentage of events in which two given attributes, e.g., a given IP address and a given port number, appear simultaneously. An Edge connect the node containing the percentage to each of the two nodes containing a communication attribute. The authors do not explain in their paper how their approach can be used to distinguish attacks features. The reference [12] uses exactly the same kind of representation, attributes selected being IP addresses, Port numbers and packet sizes. This latter paper contains a partial evaluation of the possible use of the graph for forensic analysis: based on the VAST 2012 dataset, a human analyst uses this representation to investigate three attacks.
Similarly to these two pieces of work, we propose in this paper to restructure network event logs to emphasize subsets of attributes that are of interest in a security perspective. However, we integrate in the model much more information of various types. We do not only store statistical information on certain combination of informa-tion, but keep track of all events while adding information about the links between these events.
In addition, we also propose an automatic treatment of the graph, based on unsupervised learning, so as to detect correlated events involved in attacks.
6. Conclusion
In this paper, we proposed a graph model based on so called security objects to describe network events and a
process based on community detection to discover security objects linked to an attack identified through an indicator of compromise. We have implemented a prototype that implements the graph model and allows discovering com-munities in the graph.
The experiments have shown that this approach allows identifying a very large part of the events related to a given attack, including potential hidden side-events. This result is very interesting in the context of forensic analysis.
Experiments have also shown that the graph generation scales to large datasets including millions of events. As long as an analyst is able to discover an IoC, the proposed method offers a way to analyze the corresponding attack. We showed in this paper that our approach allows dis-tinguishing between normal information and information related to an attack. However, the entry point for this dis-tinction is an IoC. This is why our contribution is related to forensic analysis and not to intrusion detection. How-ever, as the notion of community in graphs of SOs seems to allow us to clearly distinguish attacks from normal traf-fic, we now plan as future work to use our graph model to structure input data for an intrusion detection system. Our hypothesis is that graphs of SOs provide a rich description of what happened on the network and, consequently, that this wealth could be efficiently exploitable by machine learning mechanisms. To be more precise, we wish to use unsupervised learning mechanisms, as in reality analysts rarely belong labeled data corresponding to what happens in their system. The first results of this new approach are currently in press [?].
References
[1] Barnum, S.: Standardizing cyber threat intelligence information with the structured threat information expression (stix). MITRE Corporation 11, 1–22 (2012)
[2] Barnum, S., Martin, R., Worrell, B., Kirillov, I.: The cybox lan-guage specification. draft, The MITRE Corporation (2012) [3] Blatz, J.: Csrf: Attack and defense. McAfee® Foundstone®
Pro-fessional Services, White Paper (2007)
[4] Blondel, V.D., Guillaume, J.L., Lambiotte, R., Lefebvre, E.: Fast unfolding of communities in large networks. Journal of statistical mechanics: theory and experiment 2008(10), P10008 (2008) [5] Cassandra, A.: Apache cassandra. Website. Available online at
http://planetcassandra. org/what-is-apache-cassandra p. 13 (2014) [6] Clauset, A., Newman, M.E., Moore, C.: Finding community
struc-ture in very large networks. Physical review E 70(6), 066111 (2004) [7] Franc¸ois, J., Wang, S., Engel, T., et al.: Bottrack: tracking bot-nets using netflow and pagerank. In: International Conference on Research in Networking. pp. 1–14. Springer (2011)
[8] Gharib, A., Sharafaldin, I., Lashkari, A.H., Ghorbani, A.A.: An evaluation framework for intrusion detection dataset. In: Informa-tion Science and Security (ICISS), 2016 InternaInforma-tional Conference on. pp. 1–6. IEEE (2016)
[9] Glatz, E., Mavromatidis, S., Ager, B., Dimitropoulos, X.: Visual-izing big network traffic data using frequent pattern mining and hypergraphs. Computing 96(1), 27–38 (2014)
[10] Goel, A., Po, K., Farhadi, K., Li, Z., De Lara, E.: The taser intrusion recovery system. In: ACM SIGOPS Operating Systems Review. vol. 39, pp. 163–176. ACM (2005)
[11] Hossain, M.N., Milajerdi, S.M., Wang, J., Eshete, B., Gjomemo, R., Sekar, R., Stoller, S.D., Venkatakrishnan, V.: Sleuth: Real-time attack scenario reconstruction from cots audit data. In: Proc. USENIX Secur. pp. 487–504 (2017)
[12] Jiang, J., Chen, J., Choo, K.K.R., Liu, C., Liu, K., Yu, M.: A visualization scheme for network forensics based on attribute oriented induction based frequent item mining and hyper graph. In: International Conference on Digital Forensics and Cyber Crime. pp. 130–143. Springer (2017)
[13] Johnson, C., Badger, M., Waltermire, D., Snyder, J., Skorupka, C.: Guide to cyber threat information sharing. Tech. rep., National Institute of Standards and Technology (2016)
[14] King, S.T., Chen, P.M.: Backtracking intrusions. In: ACM SIGOPS Operating Systems Review. vol. 37, pp. 223–236. ACM (2003) [15] Kobayashi, S., Fukuda, K., Esaki, H.: Mining causes of network
events in log data with causal inference. Proc. IEEE IM 17, 45–53 (2017)
[16] Lagraa, S., Franc¸ois, J., Lahmadi, A., Miner, M., Hammerschmidt, C., State, R.: Botgm: Unsupervised graph mining to detect bot-nets in traffic flows. In: 2017 1st Cyber Security in Networking Conference (CSNet). pp. 1–8. IEEE (2017)
[17] Mansman, F., Meier, L., Keim, D.A.: Visualization of host behavior for network security. In: VizSEC 2007, pp. 187–202. Springer (2008)
[18] Milajerdi, S.M., Gjomemo, R., Eshete, B., Sekar, R., Venkatakr-ishnan, V.: Holmes: real-time apt detection through correlation of suspicious information flows. arXiv preprint arXiv:1810.01594 (2018)
[19] Mothe, J., Mkhitaryan, K., Haroutunian, M.: Community detection: Comparison of state of the art algorithms. In: 2017 Computer Science and Information Technologies (CSIT). pp. 125–129. IEEE (2017)
[20] Nagaraja, S., Mittal, P., Hong, C.Y., Caesar, M., Borisov, N.: Botgrep: Finding p2p bots with structured graph analysis. In: USENIX Security Symposium. vol. 10, pp. 95–110 (2010) [21] Newman, M.E.: Fast algorithm for detecting community structure
in networks. Physical review E 69(6), 066133 (2004)
[22] Onwubiko, C.: Cocoa: An ontology for cybersecurity operations centre analysis process. In: 2018 International Conference On Cy-ber Situational Awareness, Data Analytics And Assessment (CyCy-ber SA). pp. 1–8. IEEE (2018)
[23] Paxson, V.: Bro: a system for detecting network intruders in real-time. Computer networks 31(23-24), 2435–2463 (1999)
[24] Pei, K., Gu, Z., Saltaformaggio, B., Ma, S., Wang, F., Zhang, Z., Si, L., Zhang, X., Xu, D.: Hercule: Attack story reconstruction via community discovery on correlated log graph. In: Proceedings of the 32Nd Annual Conference on Computer Security Applications. pp. 583–595. ACM (2016)
[25] Pons, P., Latapy, M.: Computing communities in large networks using random walks. In: International symposium on computer and information sciences. pp. 284–293. Springer (2005)
[26] Raghavan, U.N., Albert, R., Kumara, S.: Near linear time algorithm to detect community structures in large-scale networks. Physical review E 76(3), 036106 (2007)
[27] Rodriguez, M.A.: The gremlin graph traversal machine and lan-guage (invited talk). In: Proceedings of the 15th Symposium on Database Programming Languages. pp. 1–10. ACM (2015) [28] Rosvall, M., Bergstrom, C.T.: Maps of random walks on complex
networks reveal community structure. Proceedings of the National Academy of Sciences 105(4), 1118–1123 (2008)
[29] Sharafaldin, I., Lashkari, A.H., Ghorbani, A.A.: Toward generating a new intrusion detection dataset and intrusion traffic characteriza-tion. In: ICISSP. pp. 108–116 (2018)
[30] Sharp, Austin et al.: Janusgraph https://janusgraph.org/
[31] Traag, V.A., Bruggeman, J.: Community detection in networks with positive and negative links. Physical Review E 80(3), 036115 (2009)
[32] Xosanavongsa, C., Totel, E., Bettan, O.: Discovering correlations: A formal definition of causal dependency among heterogeneous events. In: 2019 IEEE European Symposium on Security and Privacy (EuroS&P). pp. 340–355. IEEE (2019)
[33] Xu, Z., Wu, Z., Li, Z., Jee, K., Rhee, J., Xiao, X., Xu, F., Wang, H., Jiang, G.: High fidelity data reduction for big data security dependency analyses. In: Proceedings of the 2016 ACM SIGSAC Conference on Computer and Communications Security. pp. 504– 516. ACM (2016)