2005 IICA Annual Report
IICA’s Contribution to Agriculture and the
Development of Rural Communities in
the United States of America
Directorate for Strategic Partnerships and
IICA’s Contribution to Agriculture and the Development of Rural
Communities in the United States of America
1. Introduction
The food and fiber system is an interrelated and interdependent part of the global economy. The United States is the world’s top exporter of agricultural products. The value of U.S. agricultural exports equaled $61.3 billion for 2004, about $1.7 billion over calendar year 2003 and the largest in U.S. history. Imports were up about $6.6 billion over 2003, at $54.1 billion, their 13th consecutive record. These record levels leave an agricultural trade balance of %7.3 billion for calendar year 2004, compared with $12,2 billion the previous year.
Combined expenditures for food consumption, other personal fiber consumption, exports, food and fiber production amounted to over $1.24 trillion in 2001. Of the $1.24 trillion, almost $339 billion came from services, while $334 billion came from trade, and $73,8 billion from the farm sector. The FFS share of total GDP, a measure of the Nation’s wealth, was 12.3% in 2001 and the employment generated by the system was 16,7%, providing jobs for 23,7 million workers. The FFS comprises the economic activities of the farms and the firms that assemble, process, and transform raw agricultural commodities into final products for distribution to U.S. and foreign consumers. The FFS includes all economic activity that supports farm production and the conversion of raw farm products to consumable goods –for example, machinery repair, fertilizer production, farming itself, food processing and manufacturing,, transportation, wholesale and retail trade, distribution of food and apparel, and eating establishments. The income and employment generated within the food and fiber system is the income earned jobs provided by these firmes.
Gains in export values for wheat, corn, and cotton basically offset losses in red meats and soybeans. Import values of almost all major commodity groups increased over last year, though there were modest declines in live animals, sugar, and tobacco. Red meats and product imports grew more than $1 billion over last year, while juice, nuts, vegetables and vegetable oils each rose more than $700 million.1
The International Food Policy Research Institute expects that 85% of the increase in global demand for cereals and meat will occur in developing countries by 2020. U.S. food and agricultural exports to Canada and Mexico expanded 59% since the implementation of NAFTA. It is clear that future growth potential for food consumption will occur primarily outside the United States where 96% of the world’s population lives. These trends are similar for high value exports such as pet foods. In fact high value products now account for two-thirds of total sales. Trade is of strategic importance to U.S. food and fiber stakeholders and with a new round of negotiations, barriers and subsidies are key issues to be addressed in the immediate future.
U.S. farm sector policy has been under a process of rapid reform as agricultural production has become more consumer-driven. The wide diversity of farms’ financial, technological and commercial arrangements has demanded a new, more customized approach to policy and service delivery. People whose principal occupation is not farming run most U.S. farms. Assisting these diverse operations to maintain their competitiveness and provide them with the new tools they need for participating in growing overseas markets is a central challenge to public policy and the agencies that implement it. Flexibility is imperative in matching government program design and intent with farm circumstances that vary with size, organization and geographic location. Public support to the food, farming and rural community
1 The data and conclusions in this section of the report are drawn form “U.S. Agricultural Trade Update” by Nora
Brooks and “Economics of the Food and Fiber System” by William Edmondson. Source ERS-USDA. And represent the most current information available as of February 1, 2006.
throughout the 9.1 million square kilometer nation involves a myriad of national, state and local agencies. These institutions focus on a broad range of services that include increasing attention to rural development and effective food assistance as well as renewed efforts to improve environmental conservation through science.
IICA’s prime counterpart in its work within the United States has been with the U.S. Department of Agriculture, established in the mid 1800s to strengthen the science base for farming. In addition to its extensive network of offices throughout its 50 states, USDA also has 63 posts that cover trade issues for exporters in 130 countries. Its domestic farm sector strategy targets commercial farms (28% of farmland), intermediate farms (45% of farmland) that have some off-farm income resources and rural residence farms (29% of farmland) whose principal income comes from off-farm employment. In addition to improving conservation and productivity in the 38.2 million square kilometers of arable land, attention is also focused on alleviating hunger in over 3 million U.S. households with over 2.7 million children and in creating equal economic opportunities for 28 million rural residents whose median household income is 23% below that of urban residents.
USDA’s strategic agenda focuses on six key themes: trade expansion; farm sector competitiveness; enhancing the physical and institutional infrastructure; greater environmental conservation; prosperous rural communities; improved nutrition and efficient food assistance. In 2002 USDA presented a White Paper on IICA that outlines a partnership agenda based on three central objectives: (1) expanding institutional capabilities in the hemisphere for greater competitiveness; (2) building consensus and compatible systems for agricultural health and food safety; and (3) improving the capacity for the U.S. and its partners to trade within the hemisphere.
The Inter-American Institute for Cooperation on Agriculture has a special historical relationship with the USA. The US Department of Agriculture was instrumental in founding the Institute in 1942 and over the years has provided nearly 60% of its core operating resources to promote the advancement of science and cooperation in agriculture throughout the hemisphere. IICA’s new partnership with USDA and other agencies in the United States has undergone renewal due precisely to agricultural globalization issues and the importance of trade to U.S. agriculture and food safety to U.S. consumers. Concomitant with these issues are a host of other related priorities, especially related to agricultural health, food safety, cross-border issues and science and technology that are essential for improving competitiveness and deepening cooperation in the hemisphere.
The key role of the IICA Office in the USA is to build an active and diversified constituency for national, regional and multinational IICA programs within the USA, leveraging resources, influence and knowledge to promote hemispheric food security and rural prosperity. During 2004, the USA Office and its Directorate for Strategic partnerships focused its attention and limited resources in expanding IICA’s inter-institutional reach with new partners while responding to the hemispheric concerns of USDA regarding the advancement of agriculture. Specific actions were taken to articulate technical, financial and policy-related resources with USAID to create new institutional arrangements with IICA offices throughout the hemisphere that improve development effectiveness. This series of activities provides key inputs in internal institutional alignment and establish new public-private sector partnerships to address rural poverty and generate greater international solidarity for agricultural and rural development.
Embedded in the strategic thrust of IICA USA are the core values of flexibility, accountability, commitment, efficiency and tolerance that permeate every action and activity undertaken. During the year 2004 the Office continued to reconstitute its relationship with U.S. stakeholders. Specific in-roads were made with U.S. universities, particularly land-grant colleges, on a wide variety of issues of national interest and international import affecting state and local rural development.
2. Executive Summary
During 2005, the IICA Office in the U.S.A. continued its work with the U.S. Department of Agriculture in ongoing actions related to food safety, trade policy and public-private partnership. The U.S. government continues to provide substantial support to the Institute, providing its quota of financing in a timely manner and additional resources for programs to achieve common goals of improving agriculture and trade throughout the hemisphere.
IICA’s Directorate for Strategic Partnerships, also based in the Washington Office, serves to advance new and strengthen existing partnership arrangements to promote rural prosperity, food security and sustainable development throughout the Hemisphere. The DSP develops cooperative agreements and mutually beneficial partnerships that provide other forms of support to IICA technical and management units and country offices so that producers and policy makers in all thirty-four IICA Member States can enhance their capacities for development and change. DSP continued to furnish leadership and contacts to leverage resources for agricultural and rural development actions. It provided seed funds to capitalize on emerging opportunities to develop and implement new projects. The DSP also served as a bridge by providing internal units and outside stakeholders with useful information about partner portfolios and priorities.
Actions were undertaken to expand the capacities and opportunities of U.S. public institutions, private enterprise and centers of learning in technology and innovation to improve rural communities and agriculture in the Americas. In significant visits to the U.S., IICA’s Director General participated in various forums on the themes of hemispheric integration, regional trade and agricultural health in conjunction with international organizations, such as PAHO, IDB and the OAS. Numerous IICA experts arrived to provide information and analysis of current trends in agriculture regarding agricultural health, food safety, trade and agribusiness, as well as education and rural development. As part of the partnership with CCAA, the Inter-American Council and USDA/ARS, IICA coordinated working luncheon events with speakers on the themes of agricultural trade and rural development.
Attention was focused on facilitating information, professional exchange and policy forums to build hemisphere-wide consensus on issues and approaches to agricultural health and food safety. Among other accomplishments, IICA forged a new alliance with the Rural Policy Research Institute (RUPRI) and was appointed to the advisory board of the World Agricultural Forum. In addition, the DSP continued to provide support to the Federal Assistance Program “Participation in WTO/SPS Committee Meetings, where IICA’s role has been recognized in supporting trade negotiations related to sanitary and phytosanitary issues. Late in 2005 IICA cosponsored with PAHO the first hemispheric conference on avian influenza. This was made possible in large part by financial support from USDA and resporesented an important step in addressing this critical issue.
The IICA Office in the USA facilitates linkages between U.S. institutional, financial, professional and technical resources of the public and private sector to improve trade capacity in the hemisphere. IICA has engaged the Millennium Challenge Corporation in discussions regarding support to MCC qualified countries in the hemisphere, as those countries request IICA’s expertise in developing their national compacts. Collaboration continues to be fostered with USAID, particularly in the development of initiatives in 2005 in Honduras and Colombia. IICA has also been designated as the implementing agency of the Andean Countries Cocoa Export Support Opportunities (ACCESO) working with the World Cocoa Foundation.
3. The state of agriculture and rural live in the United States in 2005
Below is a brief summary of data from USDA Economic Research Service that details the state and performance of agriculture during 2005, according to the latest data available, and places it in the context of trends during the past several years.
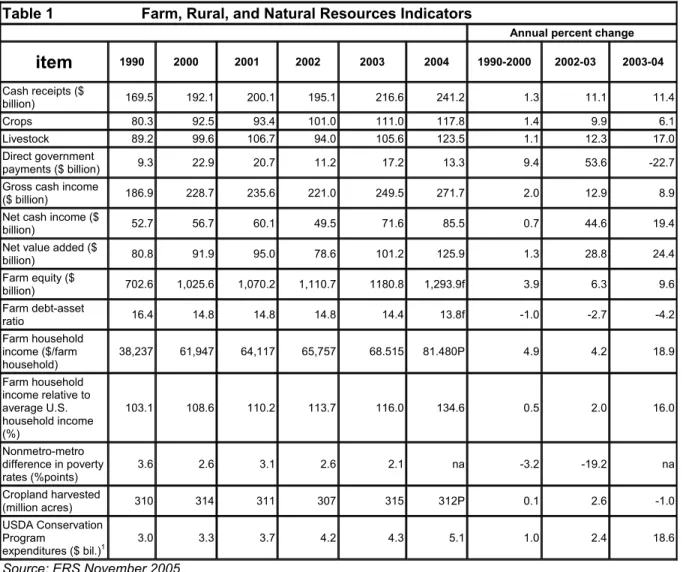
Due to significant increases in cash receipts up 11.4 percent from the previous year, direct government payments declined 22.7%. Net cash income increased 19.4 percent, less than the previous period that benefited from full implementation of the new 2002 Farm Bill policies. Livestock receipts increased 17% as access was reestablished in some foreign markets in the aftermath of the bovine spongiform encephalopathy case discovered in 2002.
Table 1 Farm, Rural, and Natural Resources Indicators
Annual percent change
item
1990 2000 2001 2002 2003 2004 1990-2000 2002-03 2003-04 Cash receipts ($ billion) 169.5 192.1 200.1 195.1 216.6 241.2 1.3 11.1 11.4 Crops 80.3 92.5 93.4 101.0 111.0 117.8 1.4 9.9 6.1 Livestock 89.2 99.6 106.7 94.0 105.6 123.5 1.1 12.3 17.0 Direct government payments ($ billion) 9.3 22.9 20.7 11.2 17.2 13.3 9.4 53.6 -22.7Gross cash income
($ billion) 186.9 228.7 235.6 221.0 249.5 271.7 2.0 12.9 8.9
Net cash income ($
billion) 52.7 56.7 60.1 49.5 71.6 85.5 0.7 44.6 19.4
Net value added ($
billion) 80.8 91.9 95.0 78.6 101.2 125.9 1.3 28.8 24.4 Farm equity ($ billion) 702.6 1,025.6 1,070.2 1,110.7 1180.8 1,293.9f 3.9 6.3 9.6 Farm debt-asset ratio 16.4 14.8 14.8 14.8 14.4 13.8f -1.0 -2.7 -4.2 Farm household income ($/farm household) 38,237 61,947 64,117 65,757 68.515 81.480P 4.9 4.2 18.9 Farm household income relative to average U.S. household income (%) 103.1 108.6 110.2 113.7 116.0 134.6 0.5 2.0 16.0 Nonmetro-metro difference in poverty rates (%points) 3.6 2.6 3.1 2.6 2.1 na -3.2 -19.2 na Cropland harvested (million acres) 310 314 311 307 315 312P 0.1 2.6 -1.0 USDA Conservation Program expenditures ($ bil.)1 3.0 3.3 3.7 4.2 4.3 5.1 1.0 2.4 18.6
Source: ERS November 2005
Results from the food and fiber sector were as yet unavailable, but existing trends were expected to continue. Agricultural exports increased by 11 percent and imports by 15.3 percent, depicting a robust trade in agricultural commodities and goods.
Food consumption reflects continued stability in food prices to consumers with food consumption as a percentage of total income steady at 10 percent.
Table 2 Food and Fiber Sector Indicators
Annual percent change
item
1990 2000 2001 2002 2003 2004 1990-2000 2002-03 2003-04U.S. gross domestic product ($ billion
current)2 5,803 9,817 10.128 10.470 10.971 11.734 5.4 4.8 7.0
Food and fiber
share (%) 7.9 5.8 5.8 5.8 4.9 na -3.0 -15.5 na
Farm sector share
(%) 1.3 0.7 0.7 0.7 0.8 na -6.0 14.3 na
Total agricultural
imports ($ billion)1 22.7 38.9 39.0 41.0 45.7 52.7 5.5 11.5 15.3
Total agricultural
exports ($ billion)1 40.3 50.7 52.7 53.3 56.2 62.4 2.3 5.4 11.0
Exports' share of the volume of U.S. agriculture production (%)
18.2 17.6 17.6 16.7 17.9 16.3 -0.3 7.2 -8.9
CPI for food
(1982-84=100) 132.4 167.9 173.1 176.2 180.0 186.2 2.4 2.2 3.4
Share of U.S. disposable income
spent on food (%) 11.2 9.8 9.8 9.5 9.4 9.5 -1.3 -1.1 1.1
Share of total food expenditures for at-home consumption (%) 55.1 51.7 51.7 50.8 50.3 49.7 -0.6 -1.0 -1.2 Farm-to-retail price spread (1982-84=100) 144.5 210.3 215.4 221.2 225.6 232.9 3.8 2.0 3.2
Total USDA food and nutrition assistance spending ($ billion)1
24.9 32.6 34.2 38.0 41.8 46.2 2.7 10.0 10.5
f = Forecast. p = Preliminary. q = 2002 Administration request. na = Not available.
1 Based on October-September fiscal years ending with year indicated.
3.1 Recent performance in the expanded agricultural sector
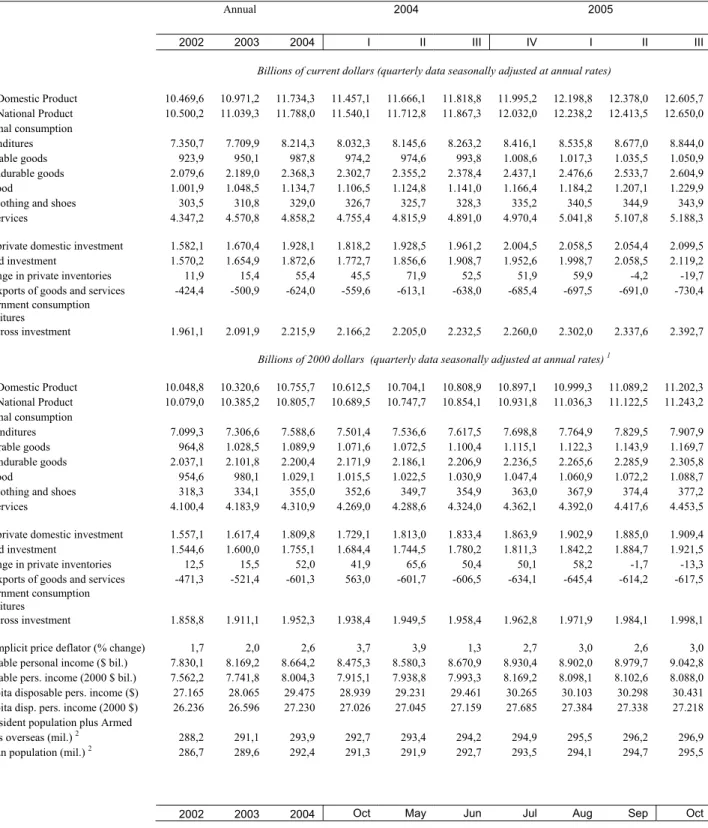
Below is a series of tables that best describe the performance of the agricultural sector in the 2005 macroeconomic context. The gross domestic product increased 3.5 percent, and interest rates remained low, though the Federal Reserve began a process of increasing the prime rate steadily.
Table 3 U.S. Gross Domestic Product & Related Data
Annual 2004 2005
2002 2003 2004 I II III IV I II III
Billions of current dollars (quarterly data seasonally adjusted at annual rates)
Gross Domestic Product 10.469,6 10.971,2 11.734,3 11.457,1 11.666,1 11.818,8 11.995,2 12.198,8 12.378,0 12.605,7 Gross National Product 10.500,2 11.039,3 11.788,0 11.540,1 11.712,8 11.867,3 12.032,0 12.238,2 12.413,5 12.650,0
Personal consumption
expenditures 7.350,7 7.709,9 8.214,3 8.032,3 8.145,6 8.263,2 8.416,1 8.535,8 8.677,0 8.844,0 Durable goods 923,9 950,1 987,8 974,2 974,6 993,8 1.008,6 1.017,3 1.035,5 1.050,9 Nondurable goods 2.079,6 2.189,0 2.368,3 2.302,7 2.355,2 2.378,4 2.437,1 2.476,6 2.533,7 2.604,9 Food 1.001,9 1.048,5 1.134,7 1.106,5 1.124,8 1.141,0 1.166,4 1.184,2 1.207,1 1.229,9 Clothing and shoes 303,5 310,8 329,0 326,7 325,7 328,3 335,2 340,5 344,9 343,9 Services 4.347,2 4.570,8 4.858,2 4.755,4 4.815,9 4.891,0 4.970,4 5.041,8 5.107,8 5.188,3
Gross private domestic investment 1.582,1 1.670,4 1.928,1 1.818,2 1.928,5 1.961,2 2.004,5 2.058,5 2.054,4 2.099,5 Fixed investment 1.570,2 1.654,9 1.872,6 1.772,7 1.856,6 1.908,7 1.952,6 1.998,7 2.058,5 2.119,2 Change in private inventories 11,9 15,4 55,4 45,5 71,9 52,5 51,9 59,9 -4,2 -19,7 Net exports of goods and services -424,4 -500,9 -624,0 -559,6 -613,1 -638,0 -685,4 -697,5 -691,0 -730,4 Government consumption
expenditures
and gross investment 1.961,1 2.091,9 2.215,9 2.166,2 2.205,0 2.232,5 2.260,0 2.302,0 2.337,6 2.392,7
Billions of 2000 dollars (quarterly data seasonally adjusted at annual rates) 1
Gross Domestic Product 10.048,8 10.320,6 10.755,7 10.612,5 10.704,1 10.808,9 10.897,1 10.999,3 11.089,2 11.202,3 Gross National Product 10.079,0 10.385,2 10.805,7 10.689,5 10.747,7 10.854,1 10.931,8 11.036,3 11.122,5 11.243,2
Personal consumption
expenditures 7.099,3 7.306,6 7.588,6 7.501,4 7.536,6 7.617,5 7.698,8 7.764,9 7.829,5 7.907,9 Durable goods 964,8 1.028,5 1.089,9 1.071,6 1.072,5 1.100,4 1.115,1 1.122,3 1.143,9 1.169,7 Nondurable goods 2.037,1 2.101,8 2.200,4 2.171,9 2.186,1 2.206,9 2.236,5 2.265,6 2.285,9 2.305,8 Food 954,6 980,1 1.029,1 1.015,5 1.022,5 1.030,9 1.047,4 1.060,9 1.072,2 1.088,7 Clothing and shoes 318,3 334,1 355,0 352,6 349,7 354,9 363,0 367,9 374,4 377,2 Services 4.100,4 4.183,9 4.310,9 4.269,0 4.288,6 4.324,0 4.362,1 4.392,0 4.417,6 4.453,5
Gross private domestic investment 1.557,1 1.617,4 1.809,8 1.729,1 1.813,0 1.833,4 1.863,9 1.902,9 1.885,0 1.909,4 Fixed investment 1.544,6 1.600,0 1.755,1 1.684,4 1.744,5 1.780,2 1.811,3 1.842,2 1.884,7 1.921,5 Change in private inventories 12,5 15,5 52,0 41,9 65,6 50,4 50,1 58,2 -1,7 -13,3 Net exports of goods and services -471,3 -521,4 -601,3 563,0 -601,7 -606,5 -634,1 -645,4 -614,2 -617,5 Government consumption
expenditures
and gross investment 1.858,8 1.911,1 1.952,3 1.938,4 1.949,5 1.958,4 1.962,8 1.971,9 1.984,1 1.998,1
GDP implicit price deflator (% change) 1,7 2,0 2,6 3,7 3,9 1,3 2,7 3,0 2,6 3,0 Disposable personal income ($ bil.) 7.830,1 8.169,2 8.664,2 8.475,3 8.580,3 8.670,9 8.930,4 8.902,0 8.979,7 9.042,8 Disposable pers. income (2000 $ bil.) 7.562,2 7.741,8 8.004,3 7.915,1 7.938,8 7.993,3 8.169,2 8.098,1 8.102,6 8.088,0 Per capita disposable pers. income ($) 27.165 28.065 29.475 28.939 29.231 29.461 30.265 30.103 30.298 30.431 Per capita disp. pers. income (2000 $) 26.236 26.596 27.230 27.026 27.045 27.159 27.685 27.384 27.338 27.218
U.S. resident population plus Armed
Forces overseas (mil.) 2 288,2 291,1 293,9 292,7 293,4 294,2 294,9 295,5 296,2 296,9
Civilian population (mil.) 2 286,7 289,6 292,4 291,3 291,9 292,7 293,5 294,1 294,7 295,5
Table 3 U.S. Gross Domestic Product & Related Data
Annual 2004 2005
2002 2003 2004 I II III IV I II III
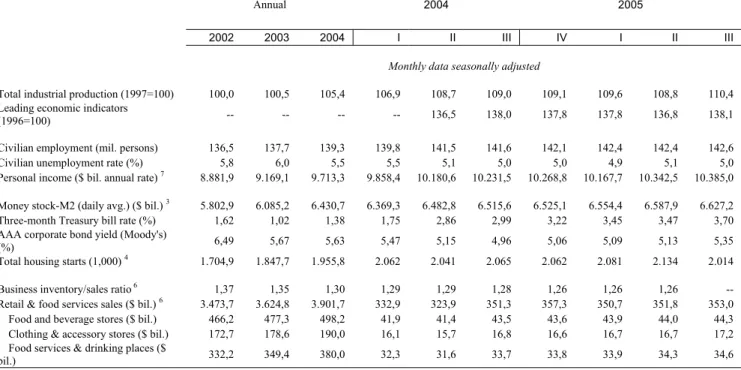
Monthly data seasonally adjusted
Total industrial production (1997=100) 100,0 100,5 105,4 106,9 108,7 109,0 109,1 109,6 108,8 110,4 Leading economic indicators
(1996=100) -- -- -- -- 136,5 138,0 137,8 137,8 136,8 138,1
Civilian employment (mil. persons) 136,5 137,7 139,3 139,8 141,5 141,6 142,1 142,4 142,4 142,6
Civilian unemployment rate (%) 5,8 6,0 5,5 5,5 5,1 5,0 5,0 4,9 5,1 5,0
Personal income ($ bil. annual rate) 7 8.881,9 9.169,1 9.713,3 9.858,4 10.180,6 10.231,5 10.268,8 10.167,7 10.342,5 10.385,0
Money stock-M2 (daily avg.) ($ bil.) 3 5.802,9 6.085,2 6.430,7 6.369,3 6.482,8 6.515,6 6.525,1 6.554,4 6.587,9 6.627,2
Three-month Treasury bill rate (%) 1,62 1,02 1,38 1,75 2,86 2,99 3,22 3,45 3,47 3,70 AAA corporate bond yield (Moody's)
(%) 6,49 5,67 5,63 5,47 5,15 4,96 5,06 5,09 5,13 5,35
Total housing starts (1,000) 4 1.704,9 1.847,7 1.955,8 2.062 2.041 2.065 2.062 2.081 2.134 2.014
Business inventory/sales ratio 6 1,37 1,35 1,30 1,29 1,29 1,28 1,26 1,26 1,26 --
Retail & food services sales ($ bil.) 6 3.473,7 3.624,8 3.901,7 332,9 323,9 351,3 357,3 350,7 351,8 353,0
Food and beverage stores ($ bil.) 466,2 477,3 498,2 41,9 41,4 43,5 43,6 43,9 44,0 44,3 Clothing & accessory stores ($ bil.) 172,7 178,6 190,0 16,1 15,7 16,8 16,6 16,7 16,7 17,2 Food services & drinking places ($
bil.) 332,2 349,4 380,0 32,3 31,6 33,7 33,8 33,9 34,3 34,6
-- = Not available. 1. In December 2003, 2000 dollars replaced 1996 dollars. 2. Population estimates based on 2000 census. 3. Annual data as of December of year listed. 4. Private, including farm. 5. Manufacturing and trade. 6. Annual total of unadjusted
data.
7. Personal income data for December 2004 reflect the payment of a special dividend by the Microsoft Corporation.
Most of the GDP data come from news releases published by the Dept. of Commerce's Bureau of Economic Analysis (BEA). GDP news releases can be found online at http://www.bea.gov/bea/rels.htm. For information on GDP data from BEA, contact Virginia Mannering at (202) 606-5304.
Published December 2005 - ERS
2002 Farm Bill
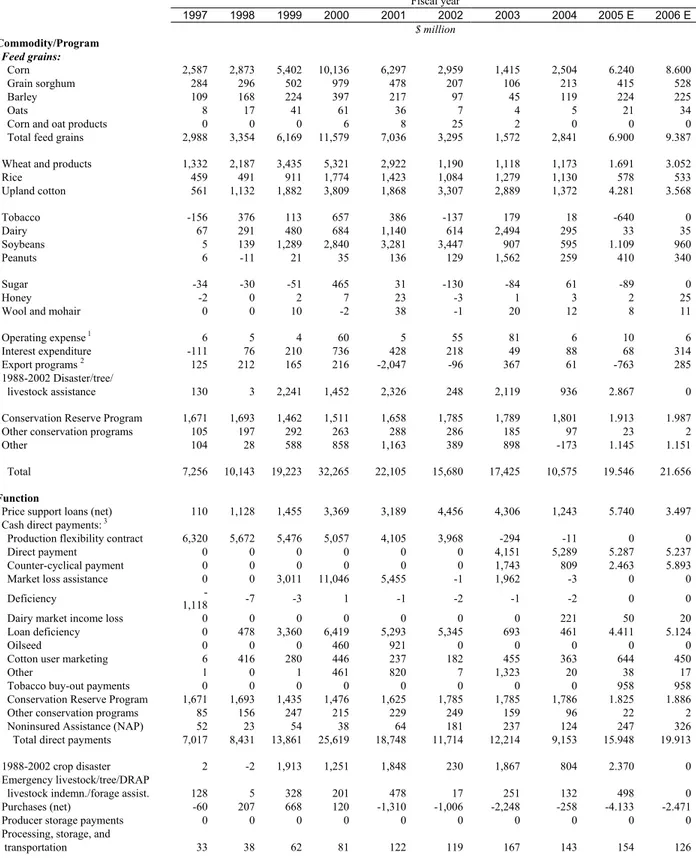
The Farm Security and Rural Investment Act of 2002 (i.e., the 2002 “Farm Bill,” that is in the process of being amended and renewed for 2007), which governs Federal farm programs, includes provisions to support the production of a reliable, safe, and affordable supply of food and fiber; promote stewardship of agricultural land and water resources; facilitate access to American farm products at home and abroad; encourage continued economic and infrastructure development in rural America; and ensure continued research to maintain an efficient and innovative agricultural and food sector. The 2002 Farm Bill also provides certainty and support for America’s farmers and ranchers by providing a generous safety net for farmers without encouraging overproduction and depressing prices.
Today, 25 percent of U.S. farm income is generated by exports. Foreign market access is essential to farmers, ranchers, and the entire agricultural sector. The 2002 Farm Bill helps keep international trade commitments and support the agency’s commitment to fair trade by complying with U.S. obligations to the World Trade Organization.
The Farm Bill offers incentives for good conservation practices on working lands, strengthens the farm economy over the long term, and promotes farmer independence. It has increased record-level funding for almost every existing environmental stewardship program and represents an unprecedented investment in conservation on America’s private lands, nearly $13 billion over the next 6 years. The bill emphasizes conservation on working lands and provides the most dramatic growth in the Environmental Quality Incentives Program, providing more than $5.5 billion over the next 6 years.
Below is a summary from ERS of net outlays for a ten year period. Note that due to strong performance during 2005, outlays were significantly lower than previous years.
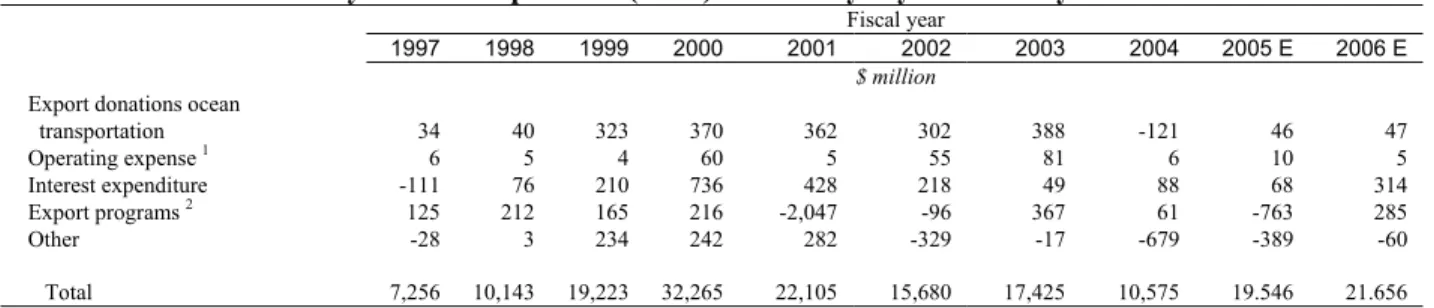
Table 4 Commodity Credit Corporation (CCC) Net Outlays by Commodity and Function
Fiscal year 1997 1998 1999 2000 2001 2002 2003 2004 2005 E 2006 E $ million Commodity/Program Feed grains: Corn 2,587 2,873 5,402 10,136 6,297 2,959 1,415 2,504 6.240 8.600 Grain sorghum 284 296 502 979 478 207 106 213 415 528 Barley 109 168 224 397 217 97 45 119 224 225 Oats 8 17 41 61 36 7 4 5 21 34
Corn and oat products 0 0 0 6 8 25 2 0 0 0
Total feed grains 2,988 3,354 6,169 11,579 7,036 3,295 1,572 2,841 6.900 9.387
Wheat and products 1,332 2,187 3,435 5,321 2,922 1,190 1,118 1,173 1.691 3.052
Rice 459 491 911 1,774 1,423 1,084 1,279 1,130 578 533 Upland cotton 561 1,132 1,882 3,809 1,868 3,307 2,889 1,372 4.281 3.568 Tobacco -156 376 113 657 386 -137 179 18 -640 0 Dairy 67 291 480 684 1,140 614 2,494 295 33 35 Soybeans 5 139 1,289 2,840 3,281 3,447 907 595 1.109 960 Peanuts 6 -11 21 35 136 129 1,562 259 410 340 Sugar -34 -30 -51 465 31 -130 -84 61 -89 0 Honey -2 0 2 7 23 -3 1 3 2 25
Wool and mohair 0 0 10 -2 38 -1 20 12 8 11
Operating expense 1 6 5 4 60 5 55 81 6 10 6
Interest expenditure -111 76 210 736 428 218 49 88 68 314
Export programs 2 125 212 165 216 -2,047 -96 367 61 -763 285
1988-2002 Disaster/tree/
livestock assistance 130 3 2,241 1,452 2,326 248 2,119 936 2.867 0
Conservation Reserve Program 1,671 1,693 1,462 1,511 1,658 1,785 1,789 1,801 1.913 1.987 Other conservation programs 105 197 292 263 288 286 185 97 23 2
Other 104 28 588 858 1,163 389 898 -173 1.145 1.151
Total 7,256 10,143 19,223 32,265 22,105 15,680 17,425 10,575 19.546 21.656
Function
Price support loans (net) 110 1,128 1,455 3,369 3,189 4,456 4,306 1,243 5.740 3.497 Cash direct payments: 3
Production flexibility contract 6,320 5,672 5,476 5,057 4,105 3,968 -294 -11 0 0
Direct payment 0 0 0 0 0 0 4,151 5,289 5.287 5.237
Counter-cyclical payment 0 0 0 0 0 0 1,743 809 2.463 5.893
Market loss assistance 0 0 3,011 11,046 5,455 -1 1,962 -3 0 0
Deficiency
-1,118 -7 -3 1 -1 -2 -1 -2 0 0
Dairy market income loss 0 0 0 0 0 0 0 221 50 20
Loan deficiency 0 478 3,360 6,419 5,293 5,345 693 461 4.411 5.124
Oilseed 0 0 0 460 921 0 0 0 0 0
Cotton user marketing 6 416 280 446 237 182 455 363 644 450
Other 1 0 1 461 820 7 1,323 20 38 17
Tobacco buy-out payments 0 0 0 0 0 0 0 0 958 958
Conservation Reserve Program 1,671 1,693 1,435 1,476 1,625 1,785 1,785 1,786 1.825 1.886 Other conservation programs 85 156 247 215 229 249 159 96 22 2 Noninsured Assistance (NAP) 52 23 54 38 64 181 237 124 247 326 Total direct payments 7,017 8,431 13,861 25,619 18,748 11,714 12,214 9,153 15.948 19.913
1988-2002 crop disaster 2 -2 1,913 1,251 1,848 230 1,867 804 2.370 0
Emergency livestock/tree/DRAP
livestock indemn./forage assist. 128 5 328 201 478 17 251 132 498 0 Purchases (net) -60 207 668 120 -1,310 -1,006 -2,248 -258 -4.133 -2.471
Producer storage payments 0 0 0 0 0 0 0 0 0 0
Processing, storage, and
Table 4 Commodity Credit Corporation (CCC) Net Outlays by Commodity and Function
Fiscal year
1997 1998 1999 2000 2001 2002 2003 2004 2005 E 2006 E
$ million
Export donations ocean
transportation 34 40 323 370 362 302 388 -121 46 47 Operating expense 1 6 5 4 60 5 55 81 6 10 5 Interest expenditure -111 76 210 736 428 218 49 88 68 314 Export programs 2 125 212 165 216 -2,047 -96 367 61 -763 285 Other -28 3 234 242 282 -329 -17 -679 -389 -60 Total 7,256 10,143 19,223 32,265 22,105 15,680 17,425 10,575 19.546 21.656
1. Does not include CCC Transfers to General Sales Manager. 2. Includes Export Guarantee Program, Direct Export Credit Program, CCC Transfers to the General Sales Manager, Market Access (Promotion) Program, starting in FY 1991 and starting in FY 1992 the Export Guarantee Program - Credit Reform, Export Enhancement Program, Dairy Export Incentive Program, and Technical Assistance to Emerging Markets, starting in FY 2000 Foreign Market Development Cooperative Program and Quality Samples Program, starting in FY 2003 Specialty Crops. 3. Includes cash payments only. Excludes generic certificates in FY 86-96. E = Estimated in FY 2006 President's Budget based on 'November 2004' supply and demand estimates. The CCC outlays shown for 2002-2006 include the impact of the Farm Security and Rural Investment Act of 2002, which was enacted on May 13, 2002. Minus (-) indicates a net receipt (excess of repayments or other receipts over gross outlays of funds).
Information contact: Richard Pazdalski Farm Service Agency-Budget at (202) 720-3675 or Richard.Pazdalski@wdc.usda.gov.
Published July 2005 - ERS
3.2 Critical issues in the international and national context that impact agriculture and
rural life
Trade is the most important issue for American farmers and food safety for consumers. Export agriculture will continue to drive supply, and imports seem to be increasing steadily as new international trade regimes continue to expand trade of all types. As part of increased trade, the niche for organic products is expanding, as will be seen. And there are other, non-agricultural issues that impact rural life, including education. The impact of education on the young people in the rural U.S. will be examined as an example of the transformation taking place in rural America.
Table 5 Agricultural trade 1/, fiscal years, calendar years, year-to-date, and current month
Fiscal years 2/ Fiscal year-to-date November
2002 2003 2004 2005 2005 2006 2005 Billion dollars Agricultural exports 53.291 55.987 62.368 62.385 11.652 12.356 6.110 Agricultural imports 3/ 40.954 45.686 52.656 57.716 9.122 10.183 5.214 Trade balance 4/ 12.338 10.301 9.712 4.669 2.530 2.173 0.896
Calendar years Calendar year-to-date November
2001 2002 2003 2004 2004 2005 2005 Billion dollars Agricultural exports 53.659 53.115 59.364 61.383 55.686 57.391 6.110 Agricultural imports 3/ 39.366 41.909 47.376 53.977 49.119 53.920 5.214 Trade balance 4/ 14.293 11.205 11.988 7.407 6.566 3.471 0.896
1/ USDA defines agriculture to include: live animals, meat, and products of livestock, poultry, and dairy; hides and skins (but not leather products); animal fats and greases; food and feed grains and grain products; oilseeds and oilseed products; fruits, nuts, and vegetables and products of these; juices, wine, and malt beverages (not distilled spirits); essential oils; planting seeds; raw cotton, wool, and other fibers (not manufactured products of these); unmanufactured tobacco (not manufactured tobacco products); sugar and sugar products; coffee, cocoa, tea, and products of these; rubber and allied products; and stock for nurseries and greenhouses, spices, and crude or natural drugs. Fish, shellfish, and forestry products are not included in "agriculture."
2/ October 1 of previous year through September 30 of current year. 3/ Customs value.
4/ Exports minus imports. Data are not seasonally adjusted.
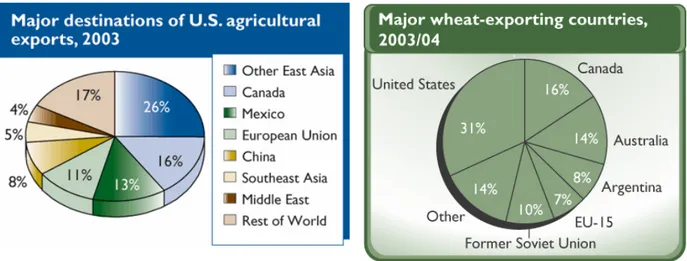
U.S. export agriculture competes well on the international markets. The U.S. is still the largest wheat exporter in the world. At the same time, the destination of exports for U.S. agricultural products is diverse.
Below is a more detailed breakdown of the distribution of U.S. agricultural exports by region. Exports to the Western hemisphere are equal to those of Asia, though dominated by trade with NAFTA partners Canada and Mexico.
Table 6 U.S. Agricultural Exports by Region Fiscal
year 2004 2005
2004 2005 2006 F Sep Apr May June July Aug Sep
Region and country Million dollars
WESTERN HEMISPHERE 23.252 24.710 26.100 1.912 2.105 2.079 2.230 2.117 2.102 2.031 NORTH AMERICA 18.015 19.549 20.600 1.558 1.683 1.686 1.750 1.680 1.696 1.658 CANADA 9.607 10.350 10.900 830 893 931 938 854 873 883 MEXICO 8.408 9.197 9.700 728 790 754 812 826 822 775 CARIBBEAN 1.843 1.848 1.900 102 169 133 168 135 154 130 CENTRAL AMERICA 1.396 1.511 1.600 95 132 128 162 141 88 103 SOUTH AMERICA 1.999 1.802 2.000 157 121 132 149 161 164 140 BRAZIL 325 220 300 17 19 17 17 18 21 14 COLOMBIA 600 598 700 36 34 55 60 56 52 38 VENEZUELA 391 351 300 45 27 21 30 27 30 36 ASIA 24.341 22.540 22.600 1.603 1.823 1.822 1.674 1.731 1.634 1.493 EAST ASIA 20.557 18.395 18.100 1.305 1.493 1.503 1.374 1.475 1.368 1.190 CHINA (MAINLAND) 6.095 5.290 5.500 395 368 344 299 454 315 236 HONG KONG 991 882 800 77 71 73 68 63 73 66 JAPAN 8.524 7.832 7.600 549 706 685 653 600 665 512 SOUTH KOREA 2.777 2.179 2.100 150 177 181 168 185 157 180 CHINA (TAIWAN) 2.142 2.197 2.100 127 171 219 186 173 158 195 SOUTH ASIA 662 695 900 61 49 46 38 30 62 61 SOUTHEAST ASIA 3.122 3.450 3.600 237 281 274 261 226 205 242 INDONESIA 978 982 1.000 58 99 77 79 62 48 56 MALAYSIA 376 382 400 36 22 24 33 29 27 35 PHILIPPINES 685 836 900 59 66 90 60 45 50 68 THAILAND 679 759 800 46 53 49 48 45 35 44 EUROPE/EURASIA 8.233 8.601 8.800 561 594 667 532 563 602 547 EUROPEAN UNION-25 1 6.799 6.930 6.900 443 451 508 417 429 434 432
Table 6 U.S. Agricultural Exports by Region Fiscal
year 2004 2005
2004 2005 2006 F Sep Apr May June July Aug Sep
OTHER EUROPE 2 430 470 500 30 41 41 39 36 42 46 FORMER SOVIET UNION-12 3 1.004 1.201 1.400 88 103 117 76 97 125 69 RUSSIAN FEDERATION 736 901 900 68 91 103 53 76 101 47 MIDDLE EAST 2.743 2.879 3.100 161 235 271 196 236 222 192 SAUDI ARABIA 350 345 400 19 35 28 21 29 37 14 TURKEY 916 1.022 1.100 30 93 86 96 97 68 35 AFRICA 2.993 2.668 2.800 259 204 182 189 272 213 220 N AFRICA 1.633 1.273 1.400 124 90 75 69 125 94 84 EGYPT 977 808 800 88 51 44 30 105 67 55 SUB-SAHARA 1.360 1.395 1.400 135 114 107 119 146 119 135 OCEANIA 585 745 900 50 57 70 56 59 60 61 TRANSSHIPMENTS 4 222 242 200 29 18 13 7 7 18 38 TOTAL AGRICULTURAL EXPORTS 62.368 62.385 64.500 4.574 5.035 5.104 4.885 4.984 4.850 4.581
Based on fiscal year (Oct. 1 through Sep. 30). F = Forecast.
1/ The former EU-15 plus 10 new states which acceeded in May 2004.
2/ Major countries include Switzerland, Norway, Iceland, Bulgaria, Romania, and the former Yugoslav States. 3/ The former 15 Republics of the Soviet Union minus the three Baltic Republics.
4/ Export transhipments through Canada have not been distributed by country for calendar years 1999-2004, but are included in the total.
Information contact: Nora Brooks (202) 694-5211.
Published Dec 2005 - ERS
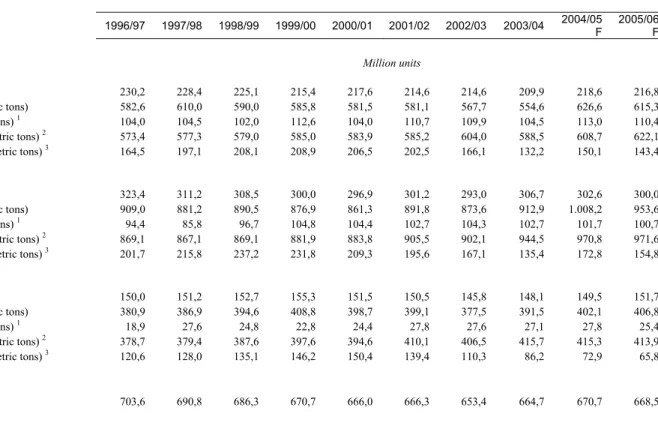
Trends in world supply provide a useful indication of trends in major crops, livestock and products to assess adjustments in world commodity prices. It is important to note that in most major crops there is a steady decrease in areas under cultivation, yet production continues to rise, mostly due to the introduction of improved technology.
Table 7 World Supply & Utilization of Major Crops, Livestock, & Products
1996/97 1997/98 1998/99 1999/00 2000/01 2001/02 2002/03 2003/04 2004/05 F 2005/06 F
Million units
Wheat
Area (hectares) 230,2 228,4 225,1 215,4 217,6 214,6 214,6 209,9 218,6 216,8 Production (metric tons) 582,6 610,0 590,0 585,8 581,5 581,1 567,7 554,6 626,6 615,3 Exports (metric tons) 1 104,0 104,5 102,0 112,6 104,0 110,7 109,9 104,5 113,0 110,4
Consumption (metric tons) 2 573,4 577,3 579,0 585,0 583,9 585,2 604,0 588,5 608,7 622,1
Ending stocks (metric tons) 3 164,5 197,1 208,1 208,9 206,5 202,5 166,1 132,2 150,1 143,4
Coarse grains
Area (hectares) 323,4 311,2 308,5 300,0 296,9 301,2 293,0 306,7 302,6 300,0 Production (metric tons) 909,0 881,2 890,5 876,9 861,3 891,8 873,6 912,9 1.008,2 953,6 Exports (metric tons) 1 94,4 85,8 96,7 104,8 104,4 102,7 104,3 102,7 101,7 100,7
Consumption (metric tons) 2 869,1 867,1 869,1 881,9 883,8 905,5 902,1 944,5 970,8 971,6
Ending stocks (metric tons) 3 201,7 215,8 237,2 231,8 209,3 195,6 167,1 135,4 172,8 154,8
Rice, milled
Area (hectares) 150,0 151,2 152,7 155,3 151,5 150,5 145,8 148,1 149,5 151,7 Production (metric tons) 380,9 386,9 394,6 408,8 398,7 399,1 377,5 391,5 402,1 406,8 Exports (metric tons) 1 18,9 27,6 24,8 22,8 24,4 27,8 27,6 27,1 27,8 25,4
Consumption (metric tons) 2 378,7 379,4 387,6 397,6 394,6 410,1 406,5 415,7 415,3 413,9
Ending stocks (metric tons) 3 120,6 128,0 135,1 146,2 150,4 139,4 110,3 86,2 72,9 65,8
Total grains
Table 7 World Supply & Utilization of Major Crops, Livestock, & Products
1996/97 1997/98 1998/99 1999/00 2000/01 2001/02 2002/03 2003/04 2004/05 F 2005/06 F Production (metric tons) 1.872,5 1.878,1 1.875,1 1.871,5 1.841,5 1.872,0 1.818,8 1.859,0 2.036,9 1.975,7 Exports (metric tons) 1 217,3 217,9 223,5 240,2 232,8 241,2 241,8 234,3 242,5 236,5
Consumption (metric tons) 2 1.821,2 1.823,8 1.835,7 1.864,5 1.862,3 1.900,8 1.912,6 1.948,7 1.994,8 2.007,6
Ending stocks (metric tons) 3 486,8 540,9 580,4 586,9 566,2 537,5 443,5 353,8 395,8 364,0
Oilseeds
Crush (metric tons) 245,2 264,3 278,4 247,3 254,6 265,3 269,2 278,6 301,2 313,0 Production (metric tons) 299,9 338,6 346,0 303,9 314,3 325,3 330,4 334,5 379,2 384,9 Exports (metric tons) 55,1 62,1 63,5 59,9 66,9 62,8 69,9 67,1 75,0 79,6 Ending stocks (metric tons) 20,3 30,2 32,9 35,1 37,1 38,6 45,0 40,2 50,6 54,8
Meals
Production (metric tons) 170,3 183,8 194,6 168,5 175,1 182,6 185,0 189,8 205,2 213,8 Exports (metric tons) 63,1 69,6 71,6 47,2 48,8 52,8 53,7 58,4 59,6 61,4
Oils
Production (metric tons) 79,1 82,1 87,7 86,4 90,0 92,8 95,8 101,7 110,5 115,0 Exports (metric tons) 28,5 30,5 32,4 29,0 30,9 33,1 36,3 38,9 41,8 44,1
Cotton
Area (hectares) 33,7 33,8 32,9 32,3 32,0 33,7 30,4 32,2 35,9 34,8 Production (bales) 90,0 92,2 85,5 87,7 88,9 98,8 88,3 95,3 120,4 112,3 Exports (bales) 26,9 26,7 23,5 27,2 26,4 29,0 30,3 33,2 34,7 41,3 Consumption (bales) 87,8 87,3 84,8 91,1 92,2 94,3 98,3 98,1 108,8 114,8 Ending stocks (bales) 44,3 48,8 51,3 49,2 46,8 52,1 42,3 40,7 51,5 50,9
1996 1997 1998 1999 2000 2001 2002 2003 2004 P 2005 F
Beef and Pork 4
Production (metric tons) 117,9 123,3 128,2 131,4 132,1 133,2 137,7 139,0 142,4 146,0 Consumption (metric tons) 116,2 122,0 126,8 131,1 131,2 132,2 136,6 137,7 140,2 143,5
Exports (metric tons) 1 7,9 8,5 8,2 9,2 8,9 8,9 9,9 10,3 10,9 11,6
Broilers and Turkeys 4
Production (metric tons) 47,1 47,8 49,5 52,3 55,3 57,1 59,0 59,1 60,5 62,5 Consumption (metric tons) 46,6 47,3 48,8 51,6 54,1 55,4 57,1 57,3 58,0 60,2
Exports (metric tons) 1 5,6 4,6 4,7 4,9 5,4 6,1 6,3 6,6 6,7 7,1
Dairy
Milk production (metric tons) 5 -- 370,1 373,7 376,7 381,6 385,9 393,7 397,8 403,4 410,1
-- = Not available. P = preliminary. F = forecast. 1. Excludes intra-EU trade but includes intra-FSU trade. 2. Where stocks data are not available, consumption includes stock changes. 3. Stocks data are based on differing marketing years and do not represent levels at a given date. Data not available for all countries. 4. Calendar year data, selected countries. 5. Data prior to 1989 no longer comparable.
Information contacts: Crops, Ed Allen (202) 694-5288; red meat and poultry, Leland Southard (202) 694-5187; dairy, LaVerne Williams (202) 694-5190: ERS 2004
Drought in some areas
(USDA Economic Research Service)
Much of the western U.S. experienced severe, extreme, or exceptional drought in 2004. As of January 17, 2005, USDA had paid producers $260 million in crop insurance indemnities related to the 2004 summer drought plus an additional $200 million to winter wheat growers. Areas experiencing drought conditions and those receiving indemnity payments do not always overlap—drought impacts and indemnity payments depend not only on the physical extent and severity of drought, but also on economic factors, such as location, investment in irrigation,
and producers’ choices about participation in crop insurance and other programs. Possible explanations for drought-driven crop insurance payments outside identified drought areas include localized drought conditions or inadequate moisture at critical crop development times in areas with otherwise adequate precipitation.
EU and U.S. Organic Markets Face Strong Demand Under Different Policies
By Carolyn Dimitri and Lydia Oberholtzer from Amber Waves, February 06, USDA Economic Research Service)
Organic markets in the European Union member states and the U.S. are nearly the same size in terms of retail sales. At the same time, their farm sectors differ significantly, with the EU-15 member states having more organic farmland and more organic operations than the U.S. (see “EU and U.S. Organic
Sectors”). The U.S. and EU Governments have also adopted
markedly different policy approaches to the organic sector. The EU actively promotes the growth of the organic sector with a wide variety of policies designed to increase the amount of land farmed organically, including government standards and certification, conversion and support payments for organic farmers, targets for land under organic management, and policies supporting research, education, and marketing.
The U.S. largely takes a free-market approach: its policies aim to facilitate market development through national standards and certification and federally funded grants that support research, education, and marketing for organic agriculture.
The policy approaches adopted by the two regions are the result of the inherently dissimilar perspectives and histories that the EU and U.S. governments have concerning agriculture, the environment, and by extension, organic agriculture. From the perspective of many EU countries, organic agriculture delivers environmental and social benefits to society, and is regarded as an infant industry requiring support until it is able to compete in established markets. This view of organic farming as a provider of public goods affords an economic rationale for government intervention in the market.
The U.S. Government’s approach, while acknowledging organic agriculture’s positive impact on environmental quality, treats the organic sector primarily as an expanding market opportunity for producers and regards organic food as a differentiated product available to consumers. In such cases, government-devised standards and labels facilitate market transactions and allay consumer concerns about product identity.
EU and U.S. Organic Sectors
The EU-15 countries (the countries that made up the EU prior to entry of 10 new countries in May 2004) are the focus of this article because much of the data on organic agriculture is on these countries. All references to the EU in this article refer to the EU-15: Austria, Belgium, Denmark, Finland, France, Germany, Greece, Ireland, Italy, Luxembourg, the Netherlands, Portugal, Spain, Sweden, and the United Kingdom.
The EU and the U.S. together accounted for 95 percent of the $25 billion in world retail sales of organic food products in 2003. In 2003, retail organic sales in the EU, at almost $13 billion (€10 billion), exceeded the $10.4 billion (€8 billion) of U.S. sales. However, per capita retail sales were nearly equal, approximately $34 in the EU and $36 in the U.S.
The European organic markets are more mature than the U.S. market. The EU’s organic sector—particularly Western Europe—had the fastest worldwide growth in the 1990s. Growth in organic retail sales, however, has slowed in some countries, with recent growth rates across the EU averaging 7.8 percent per year. Forecasts of annual growth for organic sales in the next few years range from 1.5 percent for Denmark to 11 percent for the United Kingdom. U.S. organic retail sales increased equally rapidly in the 1990s, averaging 20 percent per year, continued that pace well into 2005, and are predicted to grow 9-16 percent per year through 2010.
Certified organic land in the EU rose from 2.1 million hectares (5.2 million acres; 0.405 hectares = 1 acre) in 1997 to 5.1 million hectares in 2003, about 4 percent of total agricultural area. U.S. organic lands increased from 549,406 hectares in 1997 to 889,734 hectares in 2003—or 0.24 percent of all agricultural lands. Thus, in 2003, the EU had over five times the amount of organic farmland as the U.S., while the U.S. had three times as much total agricultural land.
EU and U.S. Adopt Organic Agriculture Standards and Certification
Both the EU and U.S. have established organic food standards, as well as systems that certify operations as organic. Such standards reduce transaction costs by ensuring that attributes of organic food do not have to be specified for each transaction. They also resolve an information problem since a product’s “organic” status is unobservable to buyers, whereas the producer has knowledge of the production and handling methods.
Certification is a process providing third-party assurance that a product was raised, processed, and distributed appropriately, and meets the official organic standards. Thus, standards and certification work in tandem. Certification also reduces opportunistic behavior (such as falsely claiming a product is organic) by creating a specific enforcement system. In the U.S., penalties are clearly outlined for firms that use the organic label inappropriately, while the EU leaves enforcement up to individual member states.
In the EU, labeling of organic plant products is governed by EU Regulation 2092/91 (enacted in 1993); organically managed livestock is governed by EU Regulation 1804/99 (enacted in 2000). The regulations set minimum rules for production, labeling, and marketing for the whole of Europe, but each member state is responsible for interpreting and implementing the rules, as well as enforcement, monitoring, and inspection. EU labeling of organic products is complex because some member states have public labels, while private certifiers in other member states have their own labels, some well known to the public (e.g., KRAV in Sweden, Skal in the Netherlands, or the Soil Association in the UK). In addition, the EU
introduced a voluntary logo in 2000 for organic products that could be used throughout the EU by those meeting the regulation. So far, few companies are using the logo. Most recently, in December 2005, the European Commission made compulsory the use of either the EU logo or the words “EU-organic” on products with at least 95 percent organic ingredients.
In the U.S., the 1990 Organic Foods Production Act (OFPA) required that USDA establish national standards for U.S. organic products. The three goals of OFPA were to (1) establish standards for marketing organically produced products, (2) assure consumers that organic products meet a consistent standard, and (3) facilitate interstate commerce. The legislation targeted environmental quality by requiring that an organic production plan pay attention to soil fertility and regulate manure application to prevent water contamination. It also included environmental and human health criteria to evaluate materials used in organic production. Along with the USDA organic logo, the USDA National Organic Standards (NOS) were implemented on October 21, 2002, replacing the prior patchwork system of State
organic standards.
Both the EU and U.S. rely on accredited agents to certify organic farmers and handlers. The EU system is more complicated, largely because member states have some latitude as to how they approve and supervise certifying entities, resulting in a great deal of diversity among the states. A national authority from each member state certifies that organic products comply with EU law. These bodies, in turn, approve other entities that are allowed to certify organic production and handling processes. Most member states have government-approved private certification bodies, but some have public member state certification. In addition, some member states and certifiers have additional public or private standards, as well as standards for products not covered under the EU Regulation, such as fish and nonfood agricultural products. Some certifiers require stricter standards than those of the EU legislation. As a result, not all EU certificates are acceptable to each certification body. In contrast, in the U.S., agents are accredited by USDA to carry out organic certification, and the certification process is well defined so that all farmers and handlers are certified according to the same standard.
EU and U.S. organic sectors, 2003
Million
euros Number Hectares Percent
Austria 400 19,056 328,803 9.7 Belgium 300 688 24,000 1.7 Denmark 339 3,510 165,146 6.1 Finland 212 5,074 159,987 7.2 France 1,578 11,377 550,000 1.9 Germany 3,100 16,476 734,027 4.3 Greece 21 6,028 244,455 6.2 Ireland 40-50 889 28,514 0.7 Italy 1,400 44,039 1,052,002 6.9 Luxembourg NA 59 3,002 2.4 Netherlands 395 1,522 41,865 2.2 Portugal NA 1,507 120,729 3.2 Spain 144 17,028 725,254 2.8 Sweden 420 3,562 225,776 7.4 United Kingdom 1,607 4,017 695,619 4.4 European Union1 9,966 134,434 5,099,179 3.9 U.S.2 8,047 8,035 889,734 0.2 NA = Not available.
Note: U.S. retail sales dollars were converted to euros using an exchange rate of $1.29 = €1.00, May 2005.
1Some EU land numbers are provisional. All EU hectares and farms are for certified organic and in-conversion land.
Numbers for Sweden do not reflect the substantial hectares that are managed organically but not certified. In Sweden, these lands are given governmental support payments as recognition by Sweden and increasingly other Scandinavian countries that financially supporting organic land management for environmental gain does not necessarily need to be linked to the marketing of organic food, for which certification is a legal requirement. In Sweden, these lands
accounted for another 180,000 hectares and an estimated 12,500 farms in 2003.
2The U.S. reports certified organic acreage, which has been converted to hectares (1 acre = 0.405 hectares). The U.S.
does not report farms or acreage in transition to organic production, as does the EU, and does not report subcontracted organic growers.
Sources: Various sources, cited in Market-Led Versus Government-Facilitated Growth: Development of the U.S. and
EU Organic Agricultural Sectors, by Carolyn Dimitri and Lydia Oberholtzer,WRS-05-05,USDA, Economic Research
Service, August 2005, available at: www.ers.usda.gov/publications/wrs0505/. U.S. operation and land numbers for 2003 are available at: www.ers.usda.gov/data/organic/
The EU, Unlike the U.S., Subsidizes Organic Production
European governments (including countries not in the EU, such as Switzerland) support organic agriculture through green payments (payments to farmers for providing environmental services) for converting to and continuing organic farming. The economic rationale for these subsidies is that organic production provides benefits that accrue to society and that farmers lack incentives to consider social benefits when making production decisions. In such cases, payments can more closely align each farmer’s private costs and benefits with societal costs and benefits. EU green payments partly compensate new or transitioning organic farmers for any increase in costs or decline in yields in moving from conventional to organic production, which takes 3 years to complete. EU support for organic agriculture falls under the EU’s general agri-environment program that is part of the Common Agricultural Policy (CAP). The EU commission establishes the general framework and co-financing, and each member state chooses a set of policies from this menu of measures. The 1992 CAP reform (EC Regulation 2078/92) provided the policy framework for EU member states to support organic farming, and many of the payments currently granted were implemented under this reform, dating back to 1994. More recently, under Agenda 2000, these measures were included in the rural development program (Rural Development Regulation No. 1257-99), a CAP reform carried out from 1999 to 2001. In 2001, the EU-15 spent almost €500 million ($559 million; the average annual exchange rate for 2001 was $1 = €0.895) on organic lands under the two measures, with organic farms receiving average payments of €183-€186 ($204-$208) per hectare, compared with €89 ($99) per hectare paid to conventional farms.
EU agri-environmental support and organic farming, 2001
Organic land supported under agri-environmental programs1 Average support premium for organic land
Country 1992 CAP reform Agenda 2000
Share of organic land in policy support programs
Public support of organic land under
1992 CAP reform 1992 CAP reform Agenda 2000
Hectares Percent Thousand euros Euros/hectare
Austria 36,193 210,833 89 67,905 211 286
Belgium 13,032 3,616 74 3,416 187 269
Finland 23,948 113,631 93 3,402 141 117 France 54,727 82,508 33 23,951 196 188 Germany 278,884 254,715 84 84,477 154 163 Greece 4,928 10,614 50 17,505 401 445 Ireland 13,691 NA 46 1,848 135 NA Italy 351,113 101,134 37 158,898 361 318 Luxembourg 736 1,224 98 328 158 173 Netherlands 8,140 14,593 63 4,446 266 156 Portugal 26,970 90 38 3,779 137 111 Spain 142,591 112,554 53 14,544 69 195 Sweden2 81,067 349,562 113 69,018 153 162 UK 285,633 122,330 60 27,591 42 45 European Union 285,633 122,330 60 27,591 42 45 NA = Not available.
1Organic support falls under EC Regulation 2078/92, the agri-environmental program of the 1992 Common
Agricultural Policy reform. After 1999, organic farming support was part of Rural Development Regulation 1257/97, under Agenda 2000.
2Sweden’s 113 percent signifies that there is more policy-supported organic land than certified area, reflecting
the country’s policy of supporting uncertified organically managed lands (see note to table: EU and U.S. organic sectors, 2003, on page 15).
Sources: Various sources, cited in Market-Led Versus Government-Facilitated Growth: Development of the U.S. and EU Organic Agricultural Sectors, by Carolyn Dimitri and Lydia Oberholtzer, WRS-05-05, USDA, Economic Research Service, August 2005
Many EU Member States Set Targets for Organic Land . . .
Many EU member states have established targets for the share of farmland under organic production in their organic farming action plans. The EU governments use targets to convey their level of commitment to growth in the organic sector. Some countries have selected relatively attainable targets, while others have chosen more ambitious ones. For example, in 1995, Denmark announced a target of 7 percent of farmland certified as organic by 2000 and nearly reached this goal with 6 percent. Denmark’s goal of having 12 percent of farmland certified as organic by 2003, however, fell short. In response to the 2000 Bovine Spongiform Encephalopathy (BSE) crisis, Germany set a target of certifying 20 percent of farmland as organic by 2010, a number that may be hard to reach since only 4 percent of land was in organic production in 2003.
. . . and Higher Funding for Research
Public funding of organic-related research and programs is increasing in both the EU and U.S., although European governments are financing more programs with a broader range. European funding supports innovation in production techniques, food processing, food marketing, and food retailing, and is estimated at €70-€80 million annually from 2003 to 2005. Germany, the Netherlands, Switzerland, and Denmark accounted for 60 percent of this. In fiscal year 2005, the U.S. Government made approximately $7 million available exclusively for organic programs, including a certification cost-share program and $4.7 million for a research grant program. This amount is supplemented by other programs that benefit organic producers, including funding for organic research and technical assistance by Federal, State, and local agencies that focus on organic agriculture.
Consumers in Both Regions Drive Market Growth
In many ways, development of the EU and U.S. organic markets has followed a similar path. In the early days, the organic sectors were supply driven and organic products were introduced by farmers. More recently, consumers have been the driving market force in both regions. Studies indicate that most European consumers have shifted from buying organic food for altruistic reasons to more self-interested reasons, such as food safety and health. Ranking behind these are taste, nature conservation, and animal welfare. Similarly, U.S. consumers 20 or more years ago bought organic food because of their concern for the environment. In 2002, according to national surveys, two-thirds of U.S. consumers cited health and nutrition as a reason for buying organic, followed by taste, food safety, and the environment. Consumers in both regions offer similar reasons for why they do not purchase organic food. In Europe, the main factors include high prices, poor product distribution, little obvious difference in quality, lack of information on the nature of organic products, and doubts about the organic integrity of the items. In the U.S., according to consumer surveys, price leads the list of barriers to purchasing organic products, followed by availability of organic products. Despite these factors, retail sales are growing rapidly in both regions.
In 2003, U.S. organic food sales were distributed almost evenly between natural product/health food stores (47 percent) and conventional retail stores (44 percent), with direct sales and exports accounting for 9 percent. This is a significant shift from 1998, when corresponding sales were 63 percent, 31 percent, and 6 percent. As in the U.S., mainstream European supermarkets in some countries stock a wide range of organic products. However, the main type of retail channel for organic food varies across countries. Over 85 percent of organic products are sold through general food shops in Denmark; in Luxembourg and Greece, organic foods are primarily sold through other stores (e.g., organic/health food stores, bakers, and butchers). In a number of countries, including Ireland, Italy, France, Belgium, the Netherlands, and Germany, sales are more evenly divided between supermarkets and other stores. Although the organic market is growing in both the EU and the U.S., there are some problems with the flow of products to market. In Europe, the organic dairy and livestock industries, in particular, have grown rapidly over the last decade, and in some cases have outpaced the capacity of the market and distribution channels. Organic milk supplies in some regions were large enough to reduce organic prices, causing some producers to exit the sector because they were unable to turn a profit. The milk glut, however, appeared to be giving way to shortages in the UK, as demand continues to grow and supply has declined. The U.S. organic food market was formerly supply constrained, but now seems better able to meet consumer demand, especially for fresh produce. In the dairy market, however, with demand increasing rapidly, suppliers are struggling to provide enough organic milk to satisfy demand at current prices. EU CAP Reform Renews Support for Organic Farming
In June 2004, the European Commission adopted an Action Plan for Organic Food and Farming, with 21 policy actions aimed at facilitating ongoing developments in the organic sector. The actions are focused on three main areas: information development e.g., increasing consumer awareness, improving statistics on organic production and demand); encouraging member states to apply a more coherent approach and to make better use of the different rural development measures; and improving/reinforcing the EU’s organic farming standards and import/inspection requirements.
The 2003-04 CAP reforms partially shift agricultural policy toward a market-driven policy and convert the current system of direct payments to a single-farm payment independent of the volume of production. The single-farm payments began in 2005, with member states having discretion in implementing them. The farm payment will require cross-compliance with a wide range of standards, including environmental, food safety, animal welfare, and occupational health/safety. While the impact on organic agriculture is still unknown, the overall changes are expected to favor an expansion of organic farming.
Education as a Rural Development Strategy
(by Robert Gibbs from Amber Waves, November 2005, USDA Economic Research Service)
Educational attainment in rural America reached a historic high in 2000, with nearly one in six rural adults holding a 4-year college degree, and more than three in four completing high school. As the demand for workers with higher educational qualifications rises, many rural policymakers have come to view local educational levels as a critical determinant of job and income growth in their communities. Attracting employers who provide higher skill jobs and encouraging educational gains are seen as complementary components of a high-skill, high-wage development strategy.
But policymakers are faced with two key questions. First, does a better educated population lead to greater economic growth? According to a recent study, rural counties with high educational levels saw more rapid earnings and income growth over the past two decades than counties with lower educational levels. However, economic returns to education for rural areas continue to lag those for urban areas.
Ultimately, the strength of the tie between education and economic outcomes is influenced in part by the extent to which small rural counties lose young adults through outmigration. The loss of potential workers from rural areas, as young adults leave for college and work opportunities in urban areas, has concerned rural observers for many decades. This rural "brain drain" not only deprives rural employers of an educated workforce, but also depletes local resources because communities that have invested in these workers' education reap little return on that investment.
Rural Adults Post Major But Uneven Educational Gains
The rise in educational attainment since the end of World War II has been a remarkable success story in rural America. In 1970, 7 percent of rural adults had graduated from college, while 56 percent of the rural adult population did not have a high school diploma. By 2000, 16 percent of rural adults age 25 and older had completed college and more than 75 percent had finished high school.
Though rapid, these gains understate the educational attainment of the younger working population, ages 25-44. Nearly one-fourth of rural younger adults have at least a 4-year college degree, and over 80 percent have completed high school. Gains in educational attainment in rural areas were particularly pronounced during the 1960s, dividing the generation that viewed college as an option for the relatively few from the generation for whom college attendance became "ordinary."
A similar divide can be seen in the steady increase in job skill requirements of rural firms, as employment shifted over time from farm to factory to services. Between 1980 and 2000, for instance, the share of rural workers in low-skill jobs fell from 47 to 42 percent. The relationship between high
educational levels and high-skill jobs has prompted many communities to pay closer attention to the role of workforce education and training in their economic development plans. But the benefit of raising educational levels will vary widely from place to place because of the sharp disparity in educational attainment across rural America. In nonmetro counties where at least one-fourth of the population age 25 and older lacks a high school diploma, job growth has been steady, yet income levels typically fall well below the national average. In other nonmetro counties where the great majority of adults have completed high school, the need to improve workforce education levels is likely to be less urgent.
Workforce Education Affects Economic Growth Higher educational levels contribute to local economic development in several ways. First, a well-educated workforce facilitates the adoption of new ways of producing goods or providing services among local businesses. Second, prospective employers may view a well-educated local labor force as an asset when choosing among alternative locations for new establishments. Both factors could help improve a community's chances of attracting new businesses, particularly those businesses that require highly skilled employees. Finally, higher educational levels are almost always tied to geographic clusters of certain key industries, which in some cases have generated major economic growth in rural areas.
According to research presented at a 2003 conference on rural education cosponsored by ERS, the higher the level of educational attainment, the faster the growth rates in both per capita income and employment (see The Role of Education in Rural America). Researchers at Clemson University found that counties in the rural South with a 5-percentage- point higher share of adults attending college in 1980 reported, on average, 3.5 percent faster growth per year in per capita income over the next 20 years and 5.5 percent faster growth in employment. For a typical county in 2000, this translates into $325 more in per capita income and 150 additional workers. Given an average population of 24,700 in the study counties, the average increase in total annual county income would be approximately $8 million, or about 4 percent above actual 2000 income levels. In urban areas, annual income growth after 1980 rose 9 percent for each 5-point gain in college-educated adults, and annual employment grew 7 percent. Another study conducted by researchers at Penn State University found that rural counties with a 1-percentage-point higher share of adults with a high school diploma reported $128 more per capita income, even after adjusting for other characteristics that affect income, such as infrastructure, industry structure, and degree of urbanization. But the same 1-percentage-point increase in urban counties raised per capita income by $413.
These studies qualify the role of education in rural economic prosperity in two ways. First, urban areas benefit disproportionately from a well-educated workforce. Second, benefits from higher educational levels depend on other local factors, but primarily for urban areas. Within rural areas, population density, access to interstate highways, social capital, and school characteristics have little power to enhance or inhibit the influence of educational levels on income and employment. As a result, there is little evidence that economic development strategies based on raising workforce education levels will be equally
successful regardless of a community's other characteristics. Areas with high educational levels also have high-skill employment bases that have adapted to the particular features of the area. Thus, infrastructure and urbanization enhance the effect of education primarily by influencing the kinds of jobs found in the local economy.
Better Schools Promote Higher Achievement and Earnings
If higher levels of education boost local economic performance, how might localities pursue a development strategy that incorporates improvements in education? In the past, rural areas seeking to stem the brain drain emphasized strategies to retain well-educated youth and adults and attract new residents by encouraging higher skill employment growth. "Workforce development" most often meant investing in job training programs, both by States and local jurisdictions. More recently, attention has turned to improving the quality of local schools in order to raise the level of performance and well-being of