HAL Id: dumas-02558512
https://dumas.ccsd.cnrs.fr/dumas-02558512
Submitted on 29 Apr 2020HAL is a multi-disciplinary open access archive for the deposit and dissemination of sci-entific research documents, whether they are pub-lished or not. The documents may come from teaching and research institutions in France or abroad, or from public or private research centers.
L’archive ouverte pluridisciplinaire HAL, est destinée au dépôt et à la diffusion de documents scientifiques de niveau recherche, publiés ou non, émanant des établissements d’enseignement et de recherche français ou étrangers, des laboratoires publics ou privés.
Dynamique de l’atrophie hippocampique dans le
vieillissement et la maladie d’Alzheimer
Louis Nadal
To cite this version:
Louis Nadal. Dynamique de l’atrophie hippocampique dans le vieillissement et la maladie d’Alzheimer. Sciences du Vivant [q-bio]. 2020. �dumas-02558512�
Année universitaire 2019-2020
Thèse pour l’obtention du
DIPLOME D’ETAT DE DOCTEUR EN MEDECINE, N° 3006
Par Louis NADAL Né le 22 mai 1992 à Bordeaux
Dynamique de l’atrophie hippocampique dans le vieillissement et la
maladie d’Alzheimer
Présentée et soutenue publiquement le 12/02/2020
Directeur de Thèse :
Monsieur le Docteur Vincent PLANCHE
Membres du jury :
Monsieur le Professeur François TISON, directeur du jury Monsieur le Professeur Thomas TOURDIAS, rapporteur Madame le Docteur Sophie AURIACOMBE, examinateur
3
Année universitaire 2019-2020
Thèse pour l’obtention du
DIPLOME D’ETAT DE DOCTEUR EN MEDECINE N° 3006
Par Louis NADAL Né le 22 mai 1992 à Bordeaux
Dynamique de l’atrophie hippocampique dans le vieillissement et la
maladie d’Alzheimer
Présentée et soutenue publiquement le 12/02/2020
Directeur de Thèse :
Monsieur le Docteur Vincent PLANCHE
Membres du jury :
Monsieur le Professeur François TISON, directeur du jury Monsieur le Professeur Thomas TOURDIAS, rapporteur Madame le Docteur Sophie AURIACOMBE, examinateur
4
Remerciements
A mon directeur de thèse,
Monsieur le Docteur Vincent Planche,
Merci de m’avoir proposé ce sujet de thèse, mais également pour ta grande disponibilité et ton aide très précieuse tout au long de l’élaboration de ce travail. J’ai beaucoup appris grâce à toi.
Aux membres du jury,
Monsieur le Professeur François Tison,
Je vous remercie d’avoir accepté d’être directeur de mon jury. Je vous remercie également pour toutes les connaissances que vous m’avez apportées dans votre service.
Monsieur le Professeur Igor Sibon,
Je vous remercie de votre présence dans ce jury mais également pour tout ce que vous m’avez apporté tant sur le plan personnel que professionnel. Vous êtes un réel moteur pour tous les internes de neurologie du CHU de Bordeaux.
Monsieur le Professeur Thomas Tourdias,
Je vous remercie d’avoir accepté d’être le rapporteur de ce travail, de faire partie du jury mais également d’avoir participé à mon attrait pour la neuro-radiologie au cours de ces années.
Mme Auriacombe Sophie,
Je vous remercie d’avoir accepté de faire partie de ce jury.
Merci à tous les praticiens neurologues que j’ai rencontrés au CHU, qui ont su me guider et me faire aimer la neurologie.
Merci aux praticiens neurologues d’Agen avec qui j’ai fait mes débuts en tant qu’interne et à ceux de Bayonne avec qui j’ai énormément appris.
5
A tous les internes de neurologie du CHU de bordeaux, merci pour tous les moments passés ensemble.
A mes amis,
A Hugo, Paul, Meryl, Sara et Emily, qui m’ont accompagné dans ces études depuis le début. Merci pour toutes ces années d’amitié.
A Pierre et Thomas, mes amis neurologues et meilleurs co-internes qui soient.
A mes amis du lycée. Le temps fait marche arrière à chaque fois que l’on se revoit.
A toute ma famille et en particulier à mes parents, un grand merci pour tous vos sacrifices, votre soutien sans faille et surtout votre patience. Je ne serai jamais allé aussi loin sans vous.
A Elise, tu m’as soutenu durant toutes ces années, j’espère que le chemin sera encore long. Je n’ose imaginer ce qu’aurait été mon parcours passé et ce qu’il adviendrait sans toi.
6
Table des matières
Introduction 9
Préambule 10
I-
Le vieillissement
10
II-
Les démences et la maladie d’Alzheimer : généralités
11
1- Histoire
2- Epidémiologie des démences
3- Physiopathologie de la maladie d’Alzheimer
4- Symptômes cliniques de la maladie d’Alzheimer
III- L’hippocampe dans le vieillissement et la maladie d’Alzheimer 17
1- Généralités sur l’hippocampe
2- Les sous-champs de l’hippocampe
3- Imagerie des sous-champs et intérêt en recherche clinique
Objectifs
23
Références
24
Article
28
Conclusions et perspectives
51
Annexes
54
Serment d’Hippocrate
58
7
Table des figures et tableaux
Figure 1 : Les 8 mécanismes identifiés dans le processus de vieillissement 10
Figure 2 : Incidence des démences selon l’âge
(données Paquid 1988-2001) 12
Figure 3 : Physiopathologie de la maladie d’Alzheimer 14
Figure 4 : La cascade amyloïde 15
Figure 5 : Continuum de la maladie d’Alzheimer 16
Figure 6 : Images d’une coupe coronale d’un hippocampe et
de ses différents sous-champs 19
Figure7 : Présentation des méthodes d’analyse de surface et de volumétrie 22
Tableau 1 : Comparaison des critères cliniques des trois grands types de
démences, entre la médecine actuelle et la description d’Avicenne dans son
ouvrage « Canon of Medicine » 11
8
Table des annexes
Annexe 1 : Comparaison de 21 protocoles de segmentation sur un même
sujet 55
Annexe 2 : Exemples du protocole de segmentation de l’hippocampe utilisé
dans cette étude 56
Annexe 3 : Illustration du contrôle qualité réalisé dans ce travail 57
9
10
Préambule
I-
Le vieillissement
Selon l’OMS, la proportion des plus de 60 ans dans la population mondiale va presque doubler d’ici 2050, passant de 12 à 22% (1). Cette augmentation fait du vieillissement et des pathologies dégénératives liées à l’âge un problème de santé publique majeur.
Le vieillissement est un processus physiologique inévitable et irréversible associé à une détérioration physique, menant à un risque accru de pathologies et de décès. A différentes échelles, il existe une variabilité inter-espèce, inter-individus, et inter-organe au sein d’un même individu.
Les processus moléculaires et cellulaires qui sous-tendent le vieillissement et qui sont associés aux principales maladies neurodégénératives sont complexes et multiples (2). Ils sont résumés dans la figure 1.
Le processus de vieillissement est le principal facteur de risque des pathologies neurodégénératives, dominées par la maladie d’Alzheimer.
Figure 1. Les 8 mécanismes identifiés dans le processus de vieillissement cérébral: instabilité
génomique, altérations épigénétiques, raccourcissement télomérique, perte de la protéostase, sénescence cellulaire, dysfonction mitochondriale, dysrégulation métabolique, altération de la communication intercelullaire et altération des cellules souches. AD : maladie d’Alzheimer, PD : maladie de Parkinson, HD : maladie de Huntington, ALS : sclérose latérale amyotrophique, AT : ataxie télangiectasie. D’après Hou et al. 2019.
11
II-
Les démences et la maladie d’Alzheimer : généralités
1- Histoire
La première description et classification des démences remonte à Avicenne (980–1037 CE). Si sa description des étiologies des démences est difficilement interprétable par la médecine moderne, ses définitions et classifications sont proches de celles actuelles. Il définit trois types de troubles de la mémoire « Fisad-al-Zekr », « Fisad-al-Fekr » et « Fisad-al-Takhayol » qui dans ses descriptions correspondent respectivement à la maladie d’Alzheimer, la démence fronto-temporale et la démence à corps de Lewy. Tableau 1.
Tableau 1. Comparaison des critères cliniques des trois grands types de démences, entre la médecine
actuelle et la description d’Avicenne dans son ouvrage « Canon of Medicine ». Tiré de l’article de Taheri-Targhi et al, 2019 (3).
En 1906, Alois Alzheimer décrit la première patiente, Augusta Deter, qui souffrait de ce qui deviendra par la suite la maladie d’Alzheimer. Celle-ci présenta dès l’âge de 51 ans des troubles de la mémoire, un mutisme, une désorientation et des hallucinations. Après sa mort, il pratiqua une autopsie et décrivit les deux lésions neuropathologiques principales de la maladie : les plaques séniles et les dégénérescences neurofibrillaires. Il rapporta ceci dans un article intitulé « On an Unusual Illness of the Cerebral Cortex » (4).
12
Il faudra attendre les années 80 pour l’identification des constituants biologiques de ces deux lésions caractéristiques: la protéine bêta-amyloïde (Aβ) en 1984 par Georges Glenner et la protéine tau anormalement phosphorylée accumulée dans les dégénérescences neurofibrillaires en 1985 par Jean-Pierre Brion.
2- Epidémiologie des démences
Selon l’OMS (5), 50 millions de personnes sont atteintes de démence dans le monde, avec une prévision de l’ordre de 152 millions pour 2050, dont 60 à 70% des cas sont attribués à la maladie d’Alzheimer. Les autres principales causes de démence sont la démence vasculaire, la démence à corps de Lewy et la démence fronto-temporale. Depuis peu, un nouveau type de démence voit le jour : la LATE ou « limbic-predominant age-related TDP-43 encephalopathy ». Cette nouvelle entité correspond à une protéinopathie à TDP-43, comme dans la moitié des démences fronto-temporales. Elle se différencie de celle-ci de par son début à un âge plus tardif, par des dépôts de TDP-43 touchant préférentiellement la partie médiale du lobe temporal et cliniquement par un syndrome amnésique pouvant mimer une maladie d’Alzheimer (6).
En France, la prévalence de la maladie d’Alzheimer et des syndromes apparentés est estimée à environ 900 000 malades. L’incidence passe de 2/1000 personnes-année entre 65 et 69 ans à 70/1000 personnes-année après 90 ans. En revanche, pour la maladie d’Alzheimer, elle aurait tendance à baisser après 90 ans. Cette augmentation exponentielle avec l’âge souligne l’importance de ce facteur comme un des principaux facteurs de risque des démences. Figure 2.
13
Hormis l’âge, les autres facteurs de risques majeurs sont le sexe féminin (sexe ratio 3/2) et sur le plan génétique l’allèle e4 du gène codant pour l’apolipoprotéine E. En effet, la présence d’un ou deux allèles e4 du gène confère un risque plus important de développer la maladie.
De nombreux autres facteurs de risques potentiels ont été mis en avant et notamment plusieurs facteurs de risque vasculaire : hypertension artérielle, diabète, hypercholestérolémie, tabagisme, alcoolisme chronique, surpoids, accidents vasculaires cérébraux (AVC), fibrillation auriculaire, athérosclérose, hyperhomocystéinémie... mais également la survenue de traumatismes crâniens, un bas niveau d’éducation, une faible interaction sociale, la dépression ou encore une activité physique faible. L’alimentation ainsi que les déficiences neurosensorielles (vue, audition) non prises en charges pourraient également jouer un rôle (7).
Grâce aux études portant sur des jumeaux, il est possible d’estimer le rôle respectif de l’environnement et de la génétique dans le risque de développer la maladie. Dans une étude récente, l’impact de l’hérédité était de 45% chez les femmes et 58% chez les hommes, laissant une part environnementale importante (8). Plus récemment, Finch et Kulmisnki (9) ont proposé le concept d’« AD Exposome », mettant en avant la probable interaction importante qui existe entre environnement et génétique.
3- Physiopathologie de la maladie d’Alzheimer
Sur le plan microscopique, la maladie d’Alzheimer est caractérisée par deux marqueurs histologiques : la plaque sénile (PS) et la dégénérescence neurofibrillaire (DNF). La PS est une substance insoluble constituée essentiellement de protéines ß-amyloïde et formée à partir d’un clivage anormal de la protéine précurseur. La DNF correspond à des inclusions formées de protéine tau (tubulin associated unit, ayant un rôle de stabilisation des microtubules) dans les neurones pyramidaux et qui est anormalement phosphorylée.
Il existe un différentiel temporo-spatial de propagation de ces deux marqueurs, comme Braak et Braak l’avaient déjà bien décrit en 1991 (10). En effet, les dépôts amyloïdes débutent plusieurs années avant l’apparition des symptômes, d’abord au niveau du néocortex, avant de s’étendre aux structures limbiques (amygdale, hippocampe et cortex cingulaire). La DNF débute quant à elle plus tardivement, dans des régions initialement dépourvues de plaques amyloïdes, mais en rapport étroit (via des projections neuronales) avec des régions cérébrales ayant un taux élevé de celle-ci. Elle démarre au niveau du cortex transenthorinal et enthorinal, puis se propage dans le subiculum et CA1, puis CA2 et
14
CA3 avant de toucher le néocortex. Cette propagation se ferait selon le réseau neuronal intra-hippocampique.
Cette dynamique de propagation renforce l’hypothèse de transmission de proche en proche supposée de ces marqueurs (de type Prion-like) (11) et de « cascade amyloide ». En effet, il semblerait que l’accumulation de protéine amyloïde joue un rôle de « trigger » de la tauopathie par le biais d’inflammation, de dysfonction mitochondriale, de stress oxydatif et de perturbation synaptique (12,13). Figure 3 et 4.
D’autres mécanismes sont impliqués, notamment génétiques, avec au premier plan l’allèle e4 de l’apolipoprotéine E. Cette protéine existe sous trois isoformes : la plus fréquente ApoE3, ApoE2 et ApoE4. Elle est impliquée dans le transport des lipides au niveau cérébral et pourrait avoir un rôle dans la régulation de la maintenance neuronale, les processus de réparation, et a des propriétés de neuroprotection. L’isoforme E4 pourrait avoir des effets délétères en entrainant une désorganisation du cytosquelette neuronal, en augmentant les dépôts de protéine β amyloïde ou par neurotoxicité directe (14).
Figure 3. Physiopathologie de la maladie d’Alzheimer
A : aspect microscopique de PS dans le neocortex d’un patient atteint d’une maladie d’Alzheimer. B : aspect microscopique de DNF dans un neurone du neocortex d’un patient atteint d’une maladie
d’Alzheimer. E et F : Dynamique de propagation des PS (E) et des DNF (F). Les PS débutent au niveau du néocortex
avant de s’étendre aux structures limbiques (amygdale, hippocampe et cortex cingulaire). La DNF débute au niveau du cortex transenthorinal et enthorinal, puis se propage dans le subiculum et CA1, puis CA2 et CA3 avant de toucher le néocortex. D’après Jucker et Walker, Nature, 2013
15
Figure 4. La cascade amyloïde, d’après dos Santos Picanço et al, 2018
Sur le plan macroscopique, la tauopathie est à l’origine d’une atrophie corticale et hippocampique. Si les dépôts amyloïdes apparaissent des années avant l’apparition des premiers symptômes, dans des régions anatomiques souvent éloignées du processus neurodégénératif, il existe en revanche une bonne corrélation entre la pathologie tau, le déclin cognitif et l’atrophie corticale et hippocampique (15). Figure 5.
4- Symptômes cliniques de la maladie d’Alzheimer
La maladie d’Alzheimer est une démence ou trouble neurocognitif majeur dans le DSM V (16). Ce trouble neurocognitif majeur se définit par la présence d’un déclin significatif dans au moins un domaine cognitif (altération de l’apprentissage et du rappel en mémoire à long terme, des fonctions exécutives, du langage, des capacités visuospatiales ainsi que modification de la personnalité et du
16
comportement) qui interfère avec la profession ou les activités habituelles et représente une rupture par rapport à un niveau antérieur de fonctionnement.
Dans la maladie d’Alzheimer, ces symptômes sont d’apparition insidieuse, sur quelques mois à années et s’aggravent dans le temps. La prédominance de certains symptômes permet de définir deux formes :
- La présentation amnésique dite hippocampique, la plus classique, où prédominent les troubles de l’apprentissage et le rappel d’informations nouvelles.
- La présentation non amnésique avec trois formes/variantes : l’atrophie corticale postérieure (où prédominent les troubles visuo-spatiaux), la variante logopénique (où prédominent les troubles du langage) et la variante frontale (où prédomine l’altération des fonctions exécutives) (17,18).
Portée par l’apparition des biomarqueurs, ces dernières années ont vu naitre le concept de spectre ou continuum de la maladie d’Alzheimer, qui s’étend du stade préclinique à la démence de la maladie d’Alzheimer en passant par le mild cognitive impairment (MCI) (19,20). Figure 5.
Figure 5. Continuum de la maladie d’Alzheimer. Relation entre les différents stades (préclinique, MCI
et démence) et l’apparition des biomarqueurs. Prospective (X) : biomarqueur futur qui serait encore mieux corrélé à la neurodégénérescence que la Taupathie.
17
III- L’hippocampe dans le vieillissement et la maladie
d’Alzheimer
1- Généralités sur l’hippocampe
Situé à la face médiale de chaque lobe temporal, l’hippocampe est une structure jouant un rôle primordial dans certaines fonctions cognitives telles que la mémoire, l’apprentissage, les processus émotionnels. Il fait également partie des zones cérébrales ayant un rôle de niche de cellules souches neuronales.
Les dommages de l’hippocampe chez des patients atteints de la maladie d’Alzheimer ont été décrits pour la première fois dans les années 80 lors d’études histologiques post mortem (21). Cela a été confirmé in vivo, grâce à l’apport de l’IRM, avec une bonne corrélation entre l’atteinte IRM et les données histologiques (sur le volume de l’hippocampe et le nombre de neurone) (22).
L’apparition de l’imagerie dans les critères diagnostiques de la maladie d’Alzheimer date de 1984 avec les critères de la NINCDS-ADRDA (23), à visée de diagnostic différentiel. Par la suite, la recherche d’anomalies spécifiques (atrophie hippocampique) a été proposée et a pris une place importante à visée diagnostique auprès des autres critères (17,19,20,24) . Dernièrement, la classification ATN (« A » Amyloide, « T » Tau et « N » Neurodegenerescence) proposée par la NIA-AA reconnaît le rôle de l’IRM dans le diagnostic de neurodégénérescence, au côté de la TEP-FDG, alors que les critères cliniques « cognitifs » ont disparus (25).
Cependant, les études ont montré que l’atrophie hippocampique est peu spécifique de la maladie d’Alzheimer et peut être retrouvée dans d’autres causes de démences telles que la dégénérescence lobaire fronto-temporale, la démence vasculaire, la sclérose hippocampique mais également lors du vieillissement chez des sujets sains (26–28).
Pour tenter d’avoir un marqueur plus sensible et spécifique, il semblait donc naturel de s’intéresser à l’analyse des sous-champs de l’hippocampe, et les études ont révélé une atteinte différente et sélective dans de nombreuses pathologies : maladie d’Alzheimer (29), pathologie neurovasculaire (30), épilepsie temporale (31), sclérose en plaques (32), pathologies psychiatriques (33,34) ou encore stress post traumatique (35).
18
2- Les sous-champs de l’hippocampe
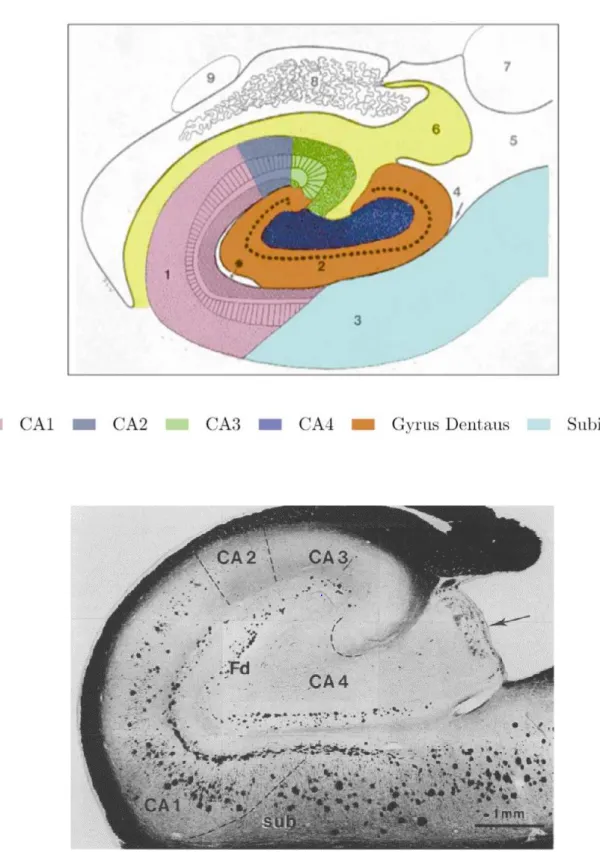
Sur le plan histologique, la première description de l’hippocampe remonte à 1911 par Ramon y Cajal (36), le décrivant comme un circuit fait de régions interconnectées impliquant différents groupes de neurones. Ces régions ou sous-champs comprennent le subiculum, la corne d’ammon (elle-même divisée en quatre régions CA1, CA2, CA3 et CA4) et le gyrus denté, et ont des caractéristiques histologiques et des fonctions différentes. Figure 6.
Sur le plan fonctionnel, le gyrus denté joue un rôle dans le processus de pattern separation, par lequel des représentations similaires sont stockées de manière distincte les unes des autres afin d’éviter les interférences; CA3 a quant à lui un rôle dans le processus de pattern completion, quand nous avons besoin de nous rappeler d’un souvenir partiel. Avec l’âge, les études ont montré une hyperactivité dans ces régions avec un shift du pattern separation vers le pattern completion, pouvant expliquer les légers troubles mnésiques liés à l’âge (37,38).
CA1 jouerait quant à lui un rôle dans l’apprentissage verbal, la récupération précoce d’informations mais aussi dans le rappel différé.
19
Figure 6. Images d’une coupe coronale d’un hippocampe et de ses différents sous-champs. L’image du
haut est tirée de l’article de Wang et al, 2003(39) et celle du bas est une coupe histologique, tirée de Braak et Braak, 1991(10). CA= Corne d’ammon ; Fd= Gyrus denté
20
3- Imagerie des sous-champs et intérêt en recherche clinique
Dans la maladie d’Alzheimer, les premières études post-mortem ayant trouvé une atteinte sélective des sous-champs ont rapporté une atteinte prédominante dans la région CA1, en comparaison à des sujets sains (40).
Par la suite, l’apport de l’imagerie a permis de regarder l’hippocampe in-vivo, d’abord par analyse des modifications de la surface de cette structure, dont les principales méthodes sont : « large deformation high-dimensional brain mapping », « radial atrophy » et la « Voxel Based Morphometry (VBM) ». Les deux premières consistent en une segmentation initiale de tout l’hippocampe, une reconstruction en 3D de la surface, suivie d’une comparaison avec une référence. La VBM consiste en une reconstruction en 3D après analyse de changements de volumes de substance grise de tous les « voxels » formant l’hippocampe. Ces méthodes donnent des informations sur les changements de surface de l’hippocampe, localisant les zones présentant les modifications externes les plus importantes, sans nécessité de délimitation des sous-champs de l’hippocampe. Les résultats chez les patients atteints de la maladie d’Alzheimer et les MCI sont consensuels et retrouvent systématiquement une atrophie prédominante dans la région latérale de l’hippocampe, correspondant à CA1 (41). En revanche, ces méthodes ne fournissement pas d’information quantitative sur les volumes des sous-champs et ne peuvent fournir une bonne évaluation sur l’analyse interne de l’hippocampe. En effet, l’impact d’une atrophie de régions profondes telles que le gyrus denté sur la surface n’est pas clair et les poches de cavités de liquide céphalo-rachidien par exemple, augmentant avec l’âge, ne pourront pas être détectées.
C’est pourquoi, l’analyse volumétrique des sous-champs de l’hippocampe est apparue, dans un premier temps par délimitation manuelle puis de façon automatisée. Ces méthodes de volumétrie des sous-champs, utilisées dans ce travail de thèse, reposent sur une segmentation des sous-champs de l’hippocampe après traitement de l’image. Il existe à ce jour plus d’une vingtaine de protocoles de segmentation qui sont basés sur des limites morphologiques tirés d’atlas anatomiques, qui diffèrent
selon les protocoles. Cela explique en partie l’hétérogénéité des résultats des études. Annexe 1. Les études ont confirmé l’atrophie sélective prédominant dans les stades précoces de la maladie dans
la région CA1, avec une bonne corrélation entre la perte neuronale de CA1 et la densité en dégénérescence neurofibrillaire (42). D’autres études ont retrouvé une atteinte prédominant dans le subiculum (41). En associant ces résultats avec ceux d’études retrouvant une association entre l’atrophie de CA1 (et du Subiculum) et la conversion du stade MCI au stade de démence, cela souligne
21
l’importance de la volumétrie des sous-champs comme marqueur sensible du processus physiopathologique de la maladie d’Alzheimer et de son potentiel rôle en tant que biomarqueur pour une détection précoce.
Chez des sujets âgés sains, si les études post mortem ont retrouvé un effet linéaire de l’âge avec le volume du gyrus denté et du subiculum, les résultats des études d’imagerie semblent plus hétérogènes (41). Cela étant, une étude récente de corrélation IRM-histologie chez des sujets âgés a retrouvé une bonne corrélation entre l’analyse de surface de l’hippocampe et la pathologie tau associée à la maladie d’Alzheimer, mais pas avec la pathologie amyloide ou TDP-43 (43). Cela laisse suggérer qu’un monitoring du volume des sous-champs de l’hippocampe chez des sujets âgés pourrait aider à différencier des sujets sains de sujets avec une maladie d’Alzheimer débutante, voire en prédire la survenue. D’autres études n’avaient déjà pas retrouvé de corrélation entre atrophie des sous-champs et la pathologie Amyloide (44).
Les différences entre les méthodes d’analyse de surface et de volumétrie sont présentées dans la figure 7.
22
Figure7. Présentation des méthodes d’analyse de surface et de volumétrie. A : méthodes d’analyse de
surface, image tirée de De Flores et al. 2015. B : Protocole de segmentation de l’hippocampe selon Yushkevich et al. En haut coupe sagittale, en bas coupe coronale ; en vert le subiculum, en rouge CA1-3 et en bleu CA4-GD.
A
23
Objectifs
De très nombreuses études se sont intéressées à l’atrophie des sous-champs de l’hippocampe chez les sujets âgés et dans la maladie d’Alzheimer. Cependant, comme vu précédemment, les résultats sont assez hétérogènes pour plusieurs raisons importantes. Tout d’abord, ces études sont très souvent limitées par de faibles effectifs. Par ailleurs, nombres d’entre elles ont utilisé des techniques d’analyse de surface, ne permettant pas une évaluation correcte des altérations internes, contrairement à la volumétrie (41). De plus, la notion d’atrophie fait référence à une perte de volume entre deux points temporels. Or, la plupart des études sont transversales et ne peuvent donc mesurer cette dynamique d’atrophie. Enfin, l’absence de suivi longitudinal à long terme entraine une limitation importante dans le suivi de l’évolution cognitive, ne permettant pas de différentier correctement les sujets sains des sujets malades.
Ainsi, dans ce travail, basé sur de la volumétrie des sous-champs de l’hippocampe, nous avons essayé d’évaluer correctement l’histoire naturelle de la vulnérabilité hippocampique chez des sujets âgés sains et chez ceux qui développeront secondairement une démence de type Alzheimer (DTA). Nous avons également recherché si la dynamique d’atrophie d’un ou plusieurs sous-champs chez une personne âgée non-démente pouvait être prédictive d’une future DTA.
24
Références
1. Vieillissement et santé [Internet]. [cité 6 oct 2019]. Disponible sur:
https://www.who.int/fr/news-room/fact-sheets/detail/ageing-and-health
2. Hou Y, Dan X, Babbar M, Wei Y, Hasselbalch SG, Croteau DL, et al. Ageing as a risk factor for neurodegenerative disease. Nat Rev Neurol [Internet]. 9 sept 2019 [cité 22 sept 2019]; Disponible sur: http://www.nature.com/articles/s41582-019-0244-7
3. Taheri-Targhi S, Gjedde A, Araj-Khodaei M, Rikhtegar R, Parsian Z, Zarrintan S, et al. Avicenna (980–1037 CE) and his Early Description and Classification of Dementia. JAD. 9 sept 2019;1‑6. 4. Stelzmann RA, Norman Schnitzlein H, Reed Murtagh F. An english translation of alzheimer’s
1907 paper, ber eine eigenartige erkankung der hirnrinde? Clinical Anatomy. 1995;8(6):429‑31. 5. La démence [Internet]. [cité 30 nov 2019]. Disponible sur:
https://www.who.int/fr/news-room/fact-sheets/detail/dementia
6. Nelson PT, Dickson DW, Trojanowski JQ, Jack CR, Boyle PA, Arfanakis K, et al. Limbic-predominant age-related TDP-43 encephalopathy (LATE): consensus working group report. Brain. 1 juin 2019;142(6):1503‑27.
7. Helmer C, Pasquier F, Dartigues J-F. Épidémiologie de la maladie d’Alzheimer et des syndromes apparentés. Med Sci (Paris). mars 2006;22(3):288‑96.
8. Gatz M, Reynolds CA, Fratiglioni L, Johansson B, Mortimer JA, Berg S, et al. Role of Genes and Environments for Explaining Alzheimer Disease. Arch Gen Psychiatry. 1 févr 2006;63(2):168‑74. 9. Finch CE, Kulminski AM. The Alzheimer’s Disease Exposome. Alzheimer’s & Dementia. 1 sept
2019;15(9):1123‑32.
10. Braak H, Braak E. Neuropathological stageing of Alzheimer-related changes. Acta Neuropathol. 1991;82(4):239‑59.
11. Jucker M, Walker LC. Self-propagation of pathogenic protein aggregates in neurodegenerative diseases. Nature. 5 sept 2013;501(7465):45‑51.
12. Stancu I-C, Vasconcelos B, Terwel D, Dewachter I. Models of β-amyloid induced Tau-pathology: the long and “folded” road to understand the mechanism. Mol Neurodegener [Internet]. 18 nov 2014 [cité 28 sept 2019];9. Disponible sur:
https://www.ncbi.nlm.nih.gov/pmc/articles/PMC4255655/
13. dos Santos Picanco LC, Ozela PF, de Fatima de Brito Brito M, Pinheiro AA, Padilha EC, Braga FS, et al. Alzheimer’s Disease: A Review from the Pathophysiology to Diagnosis, New Perspectives for Pharmacological Treatment. CMC. 4 sept 2018;25(26):3141‑59.
25
14. Mahley RW, Weisgraber KH, Huang Y. Apolipoprotein E4: A causative factor and therapeutic target in neuropathology, including Alzheimer’s disease. Proc Natl Acad Sci U S A. 11 avr 2006;103(15):5644‑51.
15. Silverberg N, Elliott C, Ryan L, Masliah E, Hodes R. NIA commentary on the NIA-AA Research Framework: Towards a biological definition of Alzheimer’s disease. Alzheimer’s & Dementia. avr 2018;14(4):576‑8.
16. American Psychiatric Association (2013). Diagnostic and statistical manual of mental disorders (5th ed). Washington, DC: American Psychiatric Press.
17. McKhann GM, Knopman DS, Chertkow H, Hyman BT, Jack CR, Kawas CH, et al. The diagnosis of dementia due to Alzheimer’s disease: Recommendations from the National Institute on Aging-Alzheimer’s Association workgroups on diagnostic guidelines for Aging-Alzheimer’s disease.
Alzheimers Dement. mai 2011;7(3):263‑9.
18. Dubois B, Feldman HH, Jacova C, Hampel H, Molinuevo JL, Blennow K, et al. Advancing research diagnostic criteria for Alzheimer’s disease: the IWG-2 criteria. The Lancet Neurology. juin 2014;13(6):614‑29.
19. Sperling RA, Aisen PS, Beckett LA, Bennett DA, Craft S, Fagan AM, et al. Toward defining the preclinical stages of Alzheimer’s disease: Recommendations from the National Institute on Aging-Alzheimer’s Association workgroups on diagnostic guidelines for Alzheimer’s disease. Alzheimers Dement. mai 2011;7(3):280‑92.
20. Albert MS, DeKosky ST, Dickson D, Dubois B, Feldman HH, Fox NC, et al. The diagnosis of mild cognitive impairment due to Alzheimer’s disease: Recommendations from the National
Institute on Aging-Alzheimer’s Association workgroups on diagnostic guidelines for Alzheimer’s disease. Alzheimers Dement. mai 2011;7(3):270‑9.
21. Ball MJ, Hachinski V, Fox A, Kirshen AJ, Fisman M, Blume W, et al. A NEW DEFINITION OF ALZHEIMER’S DISEASE: A HIPPOCAMPAL DEMENTIA. The Lancet. janv 1985;325(8419):14‑6. 22. Bobinski M, de Leon MJ, Wegiel J, Desanti S, Convit A, Saint Louis LA, et al. The histological
validation of post mortem magnetic resonance imaging-determined hippocampal volume in Alzheimer’s disease. Neuroscience. 2000;95(3):721‑5.
23. McKhann G, Drachman D, Folstein M, Katzman R, Price D, Stadlan EM. Clinical diagnosis of Alzheimer’s disease: Report of the NINCDS-ADRDA Work Group* under the auspices of
Department of Health and Human Services Task Force on Alzheimer’s Disease. Neurology. 1 juill 1984;34(7):939‑939.
24. Dubois B, Feldman HH, Jacova C, DeKosky ST, Barberger-Gateau P, Cummings J, et al. Research criteria for the diagnosis of Alzheimer’s disease: revising the NINCDS–ADRDA criteria. The Lancet Neurology. août 2007;6(8):734‑46.
25. Jack CR, Bennett DA, Blennow K, Carrillo MC, Dunn B, Haeberlein SB, et al. NIA-AA Research Framework: Toward a biological definition of Alzheimer’s disease. Alzheimers Dement. 2018;14(4):535‑62.
26. Harper L, Barkhof F, Scheltens P, Schott JM, Fox NC. An algorithmic approach to structural imaging in dementia. Journal of Neurology, Neurosurgery & Psychiatry. 1 juin 2014;85(6):692‑8.
26
27. Coupé P, Catheline G, Lanuza E, Manjón JV, Alzheimer’s Disease Neuroimaging Initiative. Towards a unified analysis of brain maturation and aging across the entire lifespan: A MRI analysis. Hum Brain Mapp. 2017;38(11):5501‑18.
28. Frisoni GB, Fox NC, Jack CR, Scheltens P, Thompson PM. The clinical use of structural MRI in Alzheimer disease. Nat Rev Neurol. févr 2010;6(2):67‑77.
29. Small SA. Isolating Pathogenic Mechanisms Embedded within the Hippocampal Circuit through Regional Vulnerability. Neuron. 1 oct 2014;84(1):32‑9.
30. Li X, Li D, Li Q, Li Y, Li K, Li S, et al. Hippocampal subfield volumetry in patients with subcortical vascular mild cognitive impairment. Sci Rep [Internet]. 15 févr 2016 [cité 13 oct 2019];6. Disponible sur: https://www.ncbi.nlm.nih.gov/pmc/articles/PMC4753487/
31. Sone D, Sato N, Maikusa N, Ota M, Sumida K, Yokoyama K, et al. Automated subfield volumetric analysis of hippocampus in temporal lobe epilepsy using high-resolution T2-weighed MR imaging. Neuroimage Clin. 13 juin 2016;12:57‑64.
32. Planche V, Koubiyr I, Romero JE, Manjon JV, Coupé P, Deloire M, et al. Regional hippocampal vulnerability in early multiple sclerosis: Dynamic pathological spreading from dentate gyrus to CA1. Human Brain Mapping. 2018;39(4):1814‑24.
33. Cao B, Passos IC, Mwangi B, Amaral-Silva H, Tannous J, Wu M-J, et al. Hippocampal Subfield Volumes in Mood Disorders. Mol Psychiatry. sept 2017;22(9):1352‑8.
34. Ho NF, Iglesias JE, Sum MY, Kuswanto CN, Sitoh YY, De Souza J, et al. Progression from selective to general involvement of hippocampal subfields in schizophrenia. Mol Psychiatry.
2017;22(1):142‑52.
35. Postel C, Viard A, André C, Guénolé F, de Flores R, Baleyte J, et al. Hippocampal subfields alterations in adolescents with post‐traumatic stress disorder. Human Brain Mapping. mars 2019;40(4):1244‑52.
36. Ramón y Cajal S (1852-1934) A du texte. Histologie du système nerveux de l’homme et des vertébrés. Cervelet, cerveau moyen, rétine, couche optique, corps strié, écorce cérébrale générale et régionale, grand sympathique / par S. Ramon Cajal,... [Internet]. 1909 [cité 29 janv 2019]. Disponible sur: https://gallica.bnf.fr/ark:/12148/bpt6k6213192g
37. Maruszak A, Thuret S. Why looking at the whole hippocampus is not enough—a critical role for anteroposterior axis, subfield and activation analyses to enhance predictive value of hippocampal changes for Alzheimerâ€TMs disease diagnosis. Front Cell Neurosci [Internet]. 31 mars 2014 [cité 30 avr 2019];8. Disponible sur:
http://journal.frontiersin.org/article/10.3389/fncel.2014.00095/abstract
38. Dillon SE, Tsivos D, Knight M, McCann B, Pennington C, Shiel AI, et al. The impact of ageing reveals distinct roles for human dentate gyrus and CA3 in pattern separation and object recognition memory. Scientific Reports [Internet]. déc 2017 [cité 9 sept 2019];7(1). Disponible sur: http://www.nature.com/articles/s41598-017-13853-8
39. Wang L, Swank JS, Glick IE, Gado MH, Miller MI, Morris JC, et al. Changes in hippocampal volume and shape across time distinguish dementia of the Alzheimer type from healthy aging☆. NeuroImage. oct 2003;20(2):667‑82.
27
40. West MJ, Coleman PD, Flood DG, Troncoso JC. Differences in the pattern of hippocampal neuronal loss in normal ageing and Alzheimer’s disease. The Lancet. sept
1994;344(8925):769‑72.
41. De Flores R, La Joie R, Chételat G. Structural imaging of hippocampal subfields in healthy aging and Alzheimer’s disease. Neuroscience. nov 2015;309:29‑50.
42. von Gunten A, Kövari E, Bussière T, Rivara C-B, Gold G, Bouras C, et al. Cognitive impact of neuronal pathology in the entorhinal cortex and CA1 field in Alzheimer’s disease. Neurobiol Aging. févr 2006;27(2):270‑7.
43. Hanko V, Apple AC, Alpert KI, Warren KN, Schneider JA, Arfanakis K, et al. In vivo hippocampal subfield shape related to TDP-43, amyloid beta, and tau pathologies. Neurobiology of Aging. févr 2019;74:171‑81.
44. La Joie R, Perrotin A, de La Sayette V, Egret S, Doeuvre L, Belliard S, et al. Hippocampal subfield volumetry in mild cognitive impairment, Alzheimer’s disease and semantic dementia.
Neuroimage Clin. 2013;3:155‑62.
45. Kerchner GA, Nicoll RA. Silent synapses and the emergence of a postsynaptic mechanism for LTP. Nat Rev Neurosci. nov 2008;9(11):813‑25.
46. Kerchner GA, Hess CP, Hammond-Rosenbluth KE, Xu D, Rabinovici GD, Kelley DAC, et al. Hippocampal CA1 apical neuropil atrophy in mild Alzheimer disease visualized with 7-T MRI. Neurology. 12 oct 2010;75(15):1381‑7.
47. Sorrells SF, Paredes MF, Cebrian-Silla A, Sandoval K, Qi D, Kelley KW, et al. Human hippocampal neurogenesis drops sharply in children to undetectable levels in adults. Nature. mars
2018;555(7696):377‑81.
48. Moreno-Jiménez EP, Flor-García M, Terreros-Roncal J, Rábano A, Cafini F, Pallas-Bazarra N, et al. Adult hippocampal neurogenesis is abundant in neurologically healthy subjects and drops sharply in patients with Alzheimer’s disease. Nat Med. avr 2019;25(4):554‑60.
49. Olsen RK, Carr VA, Daugherty AM, La Joie R, Amaral RSC, Amunts K, et al. Progress update from the hippocampal subfields group. Alzheimer’s & Dementia: Diagnosis, Assessment & Disease Monitoring. déc 2019;11:439‑49.
50. Kulaga-Yoskovitz J, Bernhardt BC, Hong S-J, Mansi T, Liang KE, van der Kouwe AJW, et al. Multi-contrast submillimetric 3 Tesla hippocampal subfield segmentation protocol and dataset. Scientific Data. 10 nov 2015;2:150059.
28
29
Differential annualized rate of hippocampal subfields atrophy in aging and
future Alzheimer’s clinical syndrome
Louis Nadal1,2; Pierrick Coupé3; Catherine Helmer4; José V. Manjon5;Helene Amieva4; François Tison1,2; Jean-François Dartigues2,4; Gwénaëlle Catheline6,7 and Vincent Planche1,2
1. Univ. Bordeaux, CNRS, Institut des Maladies Neurodégénératives, UMR 5293, F-33000 Bordeaux, France
2. Centre Mémoire de Ressources et de Recherches, Pôle de Neurosciences Cliniques, CHU de Bordeaux, F-33000 Bordeaux, France
3. Univ. Bordeaux, CNRS, Laboratoire Bordelais de Recherche en Informatique, UMR 5800, PICTURA, F-33405 Talence, France
4. Univ. Bordeaux, Inserm, Bordeaux Population Health Research Center, UMR 1219, F-33000 Bordeaux, France
5. Instituto de Aplicaciones de las Tecnologías de la Información y de las Comunicaciones Avanzadas (ITACA), Universitat Politècnica de València, 46022 Valencia, Spain.
6. EPHE, PSL, F-33000 Bordeaux, France
7. Univ. Bordeaux, CNRS, Institut de Neurosciences cognitives et intégratives d'Aquitaine, UMR 5287, F-33000 Bordeaux, France
Corresponding author: Dr Vincent Planche, MD., PhD., Institut des Maladies Neurodégénératives, UMR CNRS 5293, Centre Broca Nouvelle-Aquitaine, 146 rue Léo Saignat – 33076 Bordeaux cedex, France; vincent.planche@u-bordeaux.fr; Phone: +33 533 51 47 19
Word count: abstract: 200; article: 3828 Tables/Figures: 3 tables, 2 figures References: 54
30
Abstract
Several studies have investigated the differential vulnerability of hippocampal subfields during aging and Alzheimer’s disease (AD). Results were often contradictory, mainly because these works were based on concatenations of cross-sectional measures in cohorts with different ages or stages of AD, in the absence of a longitudinal design. Here, we investigated 327 participants from a population-based cohort of non-demented older adults with a 14-year clinical follow-up. MRI at baseline and 4 years later were assessed to measure the annualized rates of hippocampal subfields atrophy in each participant using an automatic segmentation pipeline with subsequent quality-control. In the one hand, CA4-dentate gyrus was significantly more affected than the other subfields in the whole population (CA1-3: -0.68%/year; subiculum: -0.99%/year and CA4-DG: -1.39%/year; p<0.0001). In the other hand, the annualized rate of CA1-3 atrophy was associated with an increased risk of developing Alzheimer’s clinical syndrome over time, independently of age, gender, educational level and ApoE4 genotype (HR=2.0; IC95% 1.4-3.0). These results illustrate the natural history of hippocampal subfields atrophy during aging and AD by showing that the dentate gyrus is the most vulnerable subfield to the effects of aging while the cornu-ammonis is the primary target of AD pathophysiological processes, years prior to symptom onset.
31
Introduction
The hippocampus is an archeocortical structure involved in cognitive functions such as memory and spatial learning. The hippocampal formation is made up of distinct subfields that include the subiculum, the cornu-ammonis (CA1-4) and the dentate gyrus. Although the hippocampus is non-specifically affected by almost all neurological and psychiatric disorders, its subfields can be differentially and selectively affected by different pathologies, including Alzheimer’s disease (AD) (1), neurovascular damage (2), temporal lobe epilepsy (3), multiple sclerosis (4), mood disorders (5), schizophrenia (6) or post-traumatic stress disorder (7). Theoretically, the study of hippocampal focal vulnerability could explain this phenotypic diversity and might distinguish between various normal and pathological conditions.
Hippocampal damage in patients with AD was first histologically described using post-mortem brains (8) and was subsequantly demonstrated in vivo using MRI. Such studies revealed strong correlations between MRI and histological data regarding hippocampal volume and neuronal counts (9). Therefore, hippocampal atrophy can be used as a biomarker of neuronal injury in AD and as information support of diagnostic criteria (10) (11). However, as mentioned above, hippocampal atrophy is poorly specific of AD and is often present in patients with other causes of dementia such as frontotemporal lobar degeneration, vascular dementia and hippocampal sclerosis, as well as in healthy aging (12) (13).
The first pathological studies to identify focal hippocampal damage in AD reported severe neuronal loss in the CA1 region (14). Consistent with these findings, the majority of neuroimaging studies investigating patients with AD have reported that regional atrophy is primarily located in CA1 (De Flores et al, 2015). These findings seem consensual between studies using surface-based techniques (15) (16)(17) (18) but are more in contradiction with studies using proper volumetric analyses, in which diffuse atrophy of the hippocampus was observed (although usually more severe in CA1) (19) (20) (21). The idea of selective regional vulnerability in the hippocampus during healthy aging is even more controversial (22). Interestingly, a recent MRI-histological correlation study demonstrated that the modification of hippocampal subfields shape during aging is associated with AD-related tau pathology, but not with amyloid beta or TDP-43 pathologies (23). It suggests that the monitoring of hippocampal subfields damage in elderly people could help clinicians distinguish between healthy aging, the early stages of AD, and other causes of neurodegenerative dementia. Furthermore, as a biomarker of confined tauopathy, it is possible that the early detection of hippocampal subfields atrophy during aging could help to predict future AD.
32
can be explained in several ways. First, many of them included small samples, with significant heterogeneity in terms of the subject’s sociodemographic and clinical characteristics. Second, these studies relied on cross-sectional MRI acquisition procedures that cannot properly measure individual occurences of atrophy, which is a dynamic process measured between two timepoints. Third, none of these studies conducted long-term longitudinal follow-ups of participants that would have allowed for the determination of individual cognitive trajectories to differentiate healthy aging from various neurodegenerative diseases properly. Fourth, most of these MRI studies employed surface-based mesh modelling techniques to study the shape of the hippocampus. However, measuring external surface modifications does not allow for a direct characterization of the inner alterations of a particular subfield (particularly the dentate gyrus), which would require volumetric measures (24).
Thus, the primary aim of the present study was to assess properly the natural history of hippocampal subfields vulnerability during healthy aging and in elderly people who will develop Alzheimer’s clinical syndrome over time. Additionally, we aimed at investigating whether the annualized rates of hippocampal subfields atrophy could predict an increased risk of Alzheimer’s clinical syndrome over time. For these purposes, a well-defined population-based cohort of older adults who underwent two MRI examinations at a 4-year interval and also completed a clinical follow-up period for up to 14 years was evaluated. This long-term clinical follow-up allowed to truly discriminate subjects developing AD pathology from subjects remaining free of dementia over time.
Methods
Participants
The study participants were recruited from the Bordeaux subset of the Three-City (3C) study, which was a longitudinal population-based cohort designed to evaluate the risk factors of dementia (25). During the 1999-2000 inclusion period, non-institutionalized individuals who were 65 years of age and older were randomly selected from electoral lists and then followed-up prospectively for up to 14 years. Information regarding demographic characteristics and ApoE genotype was collected at baseline. Methods for genotyping the ApoE epsilon polymorphism have been described previously (26) and ApoE4 carrier was defined as the presence of at least one E4 allele. Of the initial cohort of participants with baseline MRI data (n=663), only non-demented participants with a MMSE>23, who
33
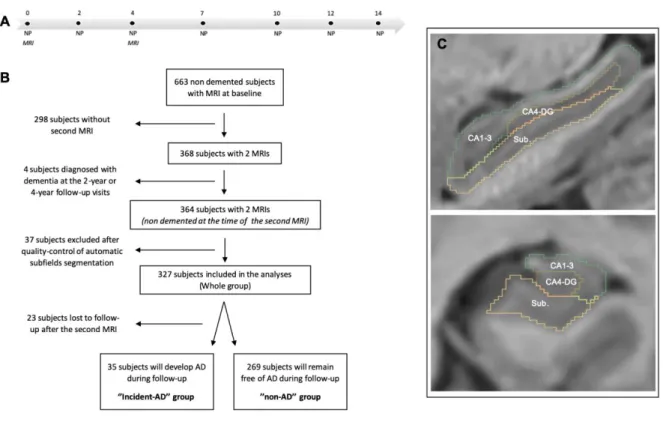
agreed to have a second MRI 4 years later were included in the present hippocampal subfields analyses (n=364) (Fig. 1A and B). There were no significant differences in the baseline demographic or neuropsychological characteristics between subjects who completed one MRI and those who completed two MRIs. All participants provided written informed consent to participate and the study protocol was approved by the ethics committee of Kremlin‐Bicêtre University Hospital (Paris, France).
Neuropsychological assessments and diagnosis of Alzheimer’s clinical syndrome
During the 14-year follow-up period, neuropsychological assessments were administered by trained psychologists at baseline and after 2, 4, 7, 10, 12 and 14 years (Fig. 1A). At each follow-up visit, a diagnosis of dementia was pre-specified at home by the neuropsychologist and a clinical validation of the diagnosis was made at home by a neurologist or a geriatrician. A definitive diagnosis of dementia and diagnoses of possible or probable AD were ultimately made by a panel of independent neurologists based on the Diagnostic and Statistical Manual of Mental Disorders criteria (DSM-IV) and the National Institute of Neurological and Communicative Diseases and Stroke/Alzheimer's Disease and Related Disorders Association criteria (11). Cases of probable or possible AD were labeled as “Alzheimer’s clinical syndrome” according to the recent National Institute on Aging and Alzheimer's Association (NIA-AA) research framework recommendations (27). According to these definitions, people with mild cognitive impairment at the end of the follow-up were not considered as demented and were therefore classified in the “non-AD group”.
The initial neuropsychological battery consisted of the Mini Mental State Evaluation (MMSE: global cognitive functions), the Free and Cued Selective Reminding Test (FCSRT: verbal episodic memory - sum of the number of words retrieved during the three free or cued trials), the Benton Visual Retention Test (BVRT: visuospatial working memory), the Isaacs Set Test (IST: semantic fluency) and the Trail Making Test part A and B (TMT-A and TMT-B: attention, information processing speed and executive functions ((number of correct moves/total time)x10)).
34 MRI acquisition and processing
Participants were scanned on a 1.5 T Gyroscan Intera system (Philips Medical Systems) with a quadrature head coil. The morphological protocol consisted of 3D high-resolution T1-weighted images acquired in transverse plane using magnetization prepared rapid gradient echo sequence (TR=8.5 ms, TE=3.9 ms, =10°, FOV=240 mm, voxel size=0.94x0.94x1mm3). The same scanner and the same sequence were used for the baseline and the 4-year follow-up MRI procedures.
For the volumetric analyses of brain structures (total hippocampal volume, total grey matter volume and total intracranial volume) and hippocampal subfields, T1-weighted images were processed using the volBrain system (http://volbrain.upv.es) (28). After denoising with an adaptive nonlocal mean filter
(29), the images were affine-registered into the Montreal Neurological Institute (MNI) space using ANTS software (30), corrected for image inhomogeneities using N4 (31) and then intensity-normalized
(32). Next, the segmentation of hippocampal subfields was performed with the HIPS pipeline (33), based on a combination of non-linear registration and multiatlas patch-based label fusion with systematic error correction. This method uses a training library from a public repository (www.nitrc.org/projects/mni-hisub25) composed of high resolution T1w images manually labeled (34). We used Kulaga-Yoskovitz protocol instead of Winterburn protocol because its segmentations were more reliable (0.88 vs 0.71) due to the use of a larger number of training cases (33). To perform the segmentation, the images were up-sampled with a local adaptive super resolution method to fit in the training image resolution (35). The method provides automatic segmentation of hippocampal subfields gathered into 3 labels, based on morphology and intensity of densely myelinated molecular layers as follows: Subiculum, CA1-3 and CA4/dentate gyrus (CA4-DG) (Fig. 1C).
Quality control of the image-processing pipeline for the baseline and 4-year MRI data was performed by two neurologists (LN and VP) who were blind to the final dementia diagnosis using 3D Slicer 4.10.0 (www.slicer.org). First, a visual assessment of the image processing quality for all subjects (n=364, at 2 timepoints) was performed using sagittal, coronal and axial slices of the 3D hippocampal volume. Registration into the MNI space, intracranial volume extraction and tissue classification were also carefully evaluated. This step led to the removal of 37 subjects from the study due to segmentation errors that were deemed too important to be corrected. Second, we performed manual correction of 44 labels with minor segmentation errors (such as the inappropriate inclusion of choroidal plexus, para-hippocampal T1-hypointensity, and/or CSF “pockets”). Finally, the present cohort consisted of 327 participants with available quality-controlled hippocampal subfields segmentations at both baseline and 4 years (Fig. 1C). Using these longitudinal MRI data, the annualized rates of atrophy for
35
each participant was calculated as follows: ((volume after 4 years – volume at baseline)/volume at baseline)/4.
Figure 1. Methodology of the study. (A) During the follow-up period, neuropsychological assessments (NP) were administered at baseline and after 2, 4, 7, 10, 12 and 14 years. MRI was performed at baseline and 4 years later. (B) Flowchart of the study. (C) Examples of hippocampal segmentations in the sagittal and coronal main axis.
Statistical analyses
Statistical analyses were performed with Prism software 8 (Graphpad) and XLstats 19.4 (Addinsoft). First, participants who were seen at least one time after the second MRI for a new neuropsychological assessment were classified as “incident-AD” (n=35) and “non-AD” (n=269) based on the final diagnosis after the 14-year longitudinal follow-up period (Fig. 1B). We compared clinical and imaging characteristics at baseline between groups using t-tests for quantitative variables and Chi-squared tests for categorical variables. Second, to describe differential hippocampal subfields atrophy during
36
aging and AD, the annualized rates of atrophy in the three subfields were compared using one-way and two-way analysis of variance tests (ANOVA) for the whole cohort of participants and for the “incident-AD” and “non-AD” groups, respectively. ANOVAs were followed by appropriate post-hoc tests (Sidak’s or Holm-Sidak’s) to account for multiple comparisons. Cohen’s d was used to determine the effect size of atrophy rates between the “incident-AD” and “non-AD” groups. Third, associations between baseline characteristics and the annualized rates of hippocampal subfields atrophy were assessed using t-tests, Pearson correlation coefficients and multiple linear regressions (using Bonferroni correction for multiple comparisons when appropriate). Finally, to identify which hippocampal subfields might be predictive of incident Alzheimer’s clinical syndrome over time, Cox proportional hazard survival regression analyses were performed, using the annualized rates of atrophy as predictors and typical confounding variables, such as age, gender, education level and ApoE4 genotype as co-variates.
Results
Demographic, neuropsychological and MRI characteristics at baseline
Three-hundred and twenty-seven participants were finally included in our analyses after quality control and manual correction of the automatic hippocampal subfields segmentation procedures at both timepoints. Of these participants, 304 (92.7%) were seen at least one time after the second MRI for a new neuropsychological assessment (Fig 1B). During the 14-year longitudinal follow-up period, 35 participants developed Alzheimer’s clinical syndrome after the second MRI (12% of participants, “incident-AD”). The mean time before the estimated conversion to dementia was 11.5 years (±2.2).
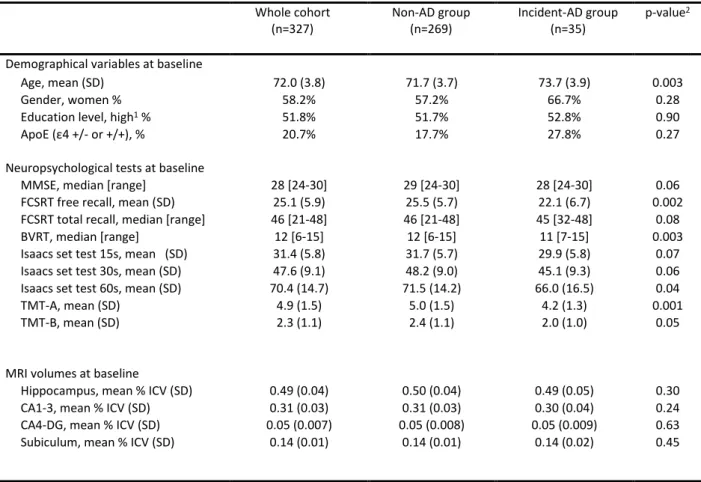
The baseline characteristics of the whole sample and of the two subgroups are summarized in Table 1.
Participants who developed incident Alzheimer’s clinical syndrome were significantly older at baseline than the group of participants who remained free of AD over time (73.7 vs 71.7 years, p=0.003). In term of baseline neuropsychological characteristics, the “incident-AD” group already displayed poorer performance in tests of verbal episodic memory tests (free recall of the FCRST, p=0.002), visuospatial working memory (BVRT, p=0.003) and attentional and executive function (TMT-A and TMT-B, p=0.001 and p=0.05 respectively).
There were no significant differences in the baseline MRI characteristics between the “incident-AD” and “non-AD” groups.
37
Table 1. Clinical, MRI and neuropsychological features of participants at baseline. BVRT: Benson Visual Retention Test ; FCSRT: Free and Cued Selective Reminding Test ; ICV: IntraCranial Volume ; MMSE: Mini Mental State Examination ; TMT: Trail-Making Test.
1. Education level was considered as high or low according to French baccalaureate (equivalent to A-level).
2. p-values refer to χ2 test for categorical variables and t-tests for ordinal variables (“non-AD” vs “incident-AD”
subgroups).
Dynamics of regional hippocampal atrophy
The annualized rates of hippocampal subfields atrophy were calculated based on MRI collected at baseline and 4 years later. Analyses revealed a differential regional vulnerability in the hippocampus during aging (Fig. 2A). In the whole cohort, CA4-DG was significantly more affected than the other subfields whereas CA1-3 was significantly less affected (CA1-3: -0.68%/year; Subiculum: -0.99%/year
Whole cohort (n=327) Non-AD group (n=269) Incident-AD group (n=35) p-value2
Demographical variables at baseline
Age, mean (SD) 72.0 (3.8) 71.7 (3.7) 73.7 (3.9) 0.003
Gender, women % 58.2% 57.2% 66.7% 0.28
Education level, high1 % 51.8% 51.7% 52.8% 0.90
ApoE (ε4 +/- or +/+), % 20.7% 17.7% 27.8% 0.27
Neuropsychological tests at baseline
MMSE, median [range] 28 [24-30] 29 [24-30] 28 [24-30] 0.06
FCSRT free recall, mean (SD) 25.1 (5.9) 25.5 (5.7) 22.1 (6.7) 0.002
FCSRT total recall, median [range] 46 [21-48] 46 [21-48] 45 [32-48] 0.08
BVRT, median [range] 12 [6-15] 12 [6-15] 11 [7-15] 0.003
Isaacs set test 15s, mean (SD) 31.4 (5.8) 31.7 (5.7) 29.9 (5.8) 0.07
Isaacs set test 30s, mean (SD) 47.6 (9.1) 48.2 (9.0) 45.1 (9.3) 0.06
Isaacs set test 60s, mean (SD) 70.4 (14.7) 71.5 (14.2) 66.0 (16.5) 0.04
TMT-A, mean (SD) 4.9 (1.5) 5.0 (1.5) 4.2 (1.3) 0.001
TMT-B, mean (SD) 2.3 (1.1) 2.4 (1.1) 2.0 (1.0) 0.05
MRI volumes at baseline
Hippocampus, mean % ICV (SD) 0.49 (0.04) 0.50 (0.04) 0.49 (0.05) 0.30
CA1-3, mean % ICV (SD) 0.31 (0.03) 0.31 (0.03) 0.30 (0.04) 0.24
CA4-DG, mean % ICV (SD) 0.05 (0.007) 0.05 (0.008) 0.05 (0.009) 0.63
38
and CA4-DG: -1.39%/year; F=19.7, p<0.0001 (ANOVA); mean differences: CA4-DG vs CA1-3 = -0.70, p<0.0001; Subiculum vs CA1-3 = -0.31, p<0.01 and CA4-DG vs Subiculum = -0.40, p<0.01 (Holm-Sidak’s multiple comparisons test)). As a comparison, the annualized rate of atrophy was -0.84%/year in the whole hippocampus and -0.11%/year for the whole cerebral grey matter.
A two-way ANOVA accounting for incident Alzheimer’s clinical syndrome revealed a “subfield effect” (F=10.3, p<0.0001) as well as a “disease effect” (F=29.4, p<0.0001) that could explain the variance in the annualized rates of regional hippocampal atrophy; without any significant interactions (F=1.01, p=0.23). Compared to the “non-AD” group, the “incident-AD” group had significantly higher rates of atrophy in CA1-3 (-1.37%/year vs -0.59%/year; p<0.001) and in CA4-DG (-2.33%/year vs -1.21%/year; p<0.001) but not in the subiculum. Regarding effect size, CA1-3 was the most affected subfield in the “incident-AD” group compared to the “non-AD” group (d=0.77 for CA1-3 and d=0.50 for CA4-DG) (Fig. 2B).
Figure 2. Annualized rate of hippocampal subfields atrophy the whole cohort of participants (A) and in participants with future Alzheimer’s clinical syndrome and participants who will remain free of AD (B). ** p<0.01 and. ***p<0.001. ****p<0.0001 (Holm-Sidak’s multiple comparisons test after one-way ANOVA or Sidak’s multiple comparisons test after two-one-way ANOVA, as appropriate). Cohen’s d values measure effect size between two groups.
39
Associations between baseline characteristics and annualized rates of hippocampal subfields atrophy.
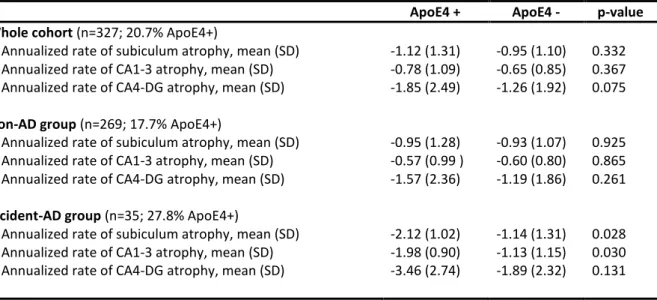
Age, gender, educational level and ApoE genotype were not associated or correlated with the annualized rate of hippocampal subfields atrophy in the whole cohort of participants and in the “non-AD” subgroup. However, there were associations between ApoE4 genotype and a higher annualized rates of atrophy in the subiculum (p=0.028) and CA1-3 (p=0.030) in the “incident-AD” subgroup. Age, gender and educational level were not associated with the annualized rates of hippocampal subfields atrophy in the “incident-AD” group. Associations between ApoE status and annualized rate of hippocampal subfields atrophy are summarized in Table 2.
Regarding the neuropsychological correlates at baseline, there was a significant association between the total recall score on the FCSRT and the annualized rate of atrophy in the CA1-3 (r=0.18, p=0.0015), taking into account multiple comparisons (Bonferroni threshold p-values = 0.0018 for 27 comparisons). This association was still significant after adjusting for age, educational level and ApoE4 status (p=0.0016).
Table 2. Annualized rate of hippocampal subfields atrophy regarding ApoE4 status in the whole cohort of participents and in both the “non-AD” and “incident-AD” subgroups.
ApoE4 + ApoE4 - p-value
Whole cohort (n=327; 20.7% ApoE4+)
Annualized rate of subiculum atrophy, mean (SD) -1.12 (1.31) -0.95 (1.10) 0.332
Annualized rate of CA1-3 atrophy, mean (SD) -0.78 (1.09) -0.65 (0.85) 0.367
Annualized rate of CA4-DG atrophy, mean (SD) -1.85 (2.49) -1.26 (1.92) 0.075
Non-AD group (n=269; 17.7% ApoE4+)
Annualized rate of subiculum atrophy, mean (SD) -0.95 (1.28) -0.93 (1.07) 0.925
Annualized rate of CA1-3 atrophy, mean (SD) -0.57 (0.99 ) -0.60 (0.80) 0.865
Annualized rate of CA4-DG atrophy, mean (SD) -1.57 (2.36) -1.19 (1.86) 0.261
Incident-AD group (n=35; 27.8% ApoE4+)
Annualized rate of subiculum atrophy, mean (SD) -2.12 (1.02) -1.14 (1.31) 0.028
Annualized rate of CA1-3 atrophy, mean (SD) -1.98 (0.90) -1.13 (1.15) 0.030
40 Prediction of incident Alzheimer's clinical syndrome
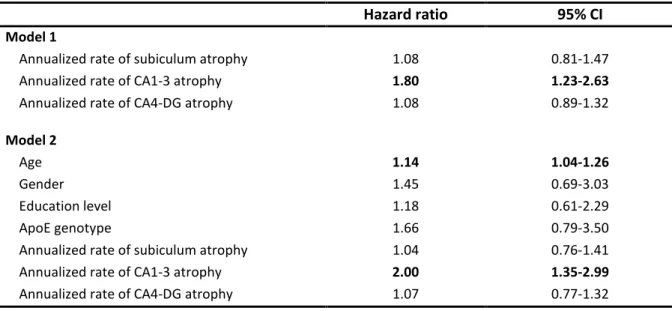
The results of the Cox proportional hazard models assessing relationships of the annualized rates of hippocampal subfield atrophy, age, gender, educational level, and ApoE4 genotype with the risk of developing Alzheimer’s clinical syndrome are shown in Table 3. In terms of regional hippocampal vulnerability, only the annualized rate of CA1-3 atrophy was associated with an increased risk of developing AD over time (HR=1.8; IC95% 1.2-2.6). This association remained significant after adusting for age, gender, educational level and ApoE4 genotype (HR=2.0; IC95% 1.4-3.0).
In contrast, normalized hippocampal subfields volumes at baseline were not predictive of incident Alzheimer’s clinical syndrome over time.
Table 3. Predictive values of annualized rate of hippocampal subfields atrophy alone (model 1) and in combination with age, gender, educational level and ApoE genotype (model 2) on the risk of incident Alzheimer’s clinical syndrome (Cox models).
Hazard ratio 95% CI
Model 1
Annualized rate of subiculum atrophy 1.08 0.81-1.47
Annualized rate of CA1-3 atrophy 1.80 1.23-2.63
Annualized rate of CA4-DG atrophy 1.08 0.89-1.32
Model 2
Age 1.14 1.04-1.26
Gender 1.45 0.69-3.03
Education level 1.18 0.61-2.29
ApoE genotype 1.66 0.79-3.50
Annualized rate of subiculum atrophy 1.04 0.76-1.41
Annualized rate of CA1-3 atrophy 2.00 1.35-2.99
41
Discussion
Thanks to its longitudinal design involving repeated MRI exams and a 14-year clinical follow-up of 327 initially non-demented elderly people, this study showed that hippocampal subfields are differentially affected in healthy aging and AD. Indeed, we have shown that the annualized rate of CA4/dentate gyrus atrophy was the most important during aging, compared to the other hippocampal subfields. Additionally, we showed that participants who developed incident Alzheimer’s clinical syndrome during the follow-up period had higher atrophy rates in CA4/dentate gyrus and CA1-3 compared to those who did not develop AD, but with a larger effect size in CA1-3. Our assumption is that the “neurodegenerative effect” linked to ongoing early AD pathophysiological process mainly affects CA1-3, on top of the aging-related atrophy in the dentate gyrus. Furthermore, participants with a higher initial annualized rate of CA1-3 atrophy had a higher risk of developing Alzheimer’s clinical syndrome during the 14-year follow-up period, independently of age, gender, educational level, and ApoE4 genotype, whereas subicular and CA4/dentate gyrus atrophy were not predictive. The fact that the annualized rate of CA1-3 was associated with lower FCSRT scores at baseline, known to predict dementia in this cohort (36) and able to screen for patients with amnestic syndrome of the hippocampal in prodromal AD support this finding (37). Furthermore, ApoE4 genotype was associated with the annualized rate of CA1-3 atrophy only in the “incident-AD” group, which further strengthens the association of CA1-3 atrophy and AD pathophysiology. Taken together, these results revealed a differential vulnerability of CA4/dentate gyrus to aging process and a differential and early vulnerability of CA1-3 to AD pathology, even several years prior to the onset of dementia.
Many previous MRI studies have demonstrated that the hippocampus shrinks with age and that this shrinkage is not homogeneous among the hippocampal subfields. However, these previous studies were based on cross-sectional analyses that assessed hippocampal volume in subjects of different ages rather than the rate of atrophy over time in individual subjects (22). Furthermore, these studies often failed to isolate participants free of age-related neurological diseases affecting the hippocampal circuit, because they lacked very long-term longitudinal follow-up periods. It may explain the significant discrepancies among the results. For example, some authors concluded that predominant damage during aging occurs either within CA1 (20)(38) (39), whereas others identified the subiculum (40), the dentate gyrus (41) (42), and still others observed homogeneous damage among various subfields (43)(44)(45). By conducting 4-year longitudinal MRI analyses in people over 65 (mean age 72), our work is therefore unique in demonstrating that individuals recruited from the general population who remained free of Alzheimer’s clinical syndrome 10 years after the last MRI, exhibited a maximal annualized rate of atrophy in CA4/dentate gyrus (-1.21%/year) that was more than twice as high as in CA1-3. This CA4/dentate gyrus atrophy over time was even higher in participants who developed