phys. stat. sol. (a), 1 – 14 (2006) / DOI 10.1002/pssa.200621200 1 2 3 4 5 6 7 8 9 10 11 12 13 14 15 16 17 18 19 20 21 22 23 24 25 26 27 28 29 30 31 32 33 34 35 36 37 38 39 40 41 42 43 44 45 46 47 48 49 50 51
Early View publication on www.interscience.wiley.com
(issue and page numbers not yet assigned; citable using Digital Object Identifier – DOI)
Original Paper
Characterization of Duplex steel Uranus 76N
during deformation and heat treatment
J. Lecomte-Beckers*, 1, P. Moureaux2, M. Carton1, and A.-M. Habraken2
1 ASMA department-sector: Special Metallic Materials, University of Liège, Chemin des Chevreuils 1, 4000 Liège 1, Belgium
2 M&S department-sector: Mechanic of Solids and Material, University of Liège, Chemin des Chevreuils 1, 4000 Liège 1, Belgium
Received 2 August 2005, revised 28 August 2006, accepted 30 August 2006 Published online ❚❚❚
PACS 62.20.Fe, 65.40.Gr, 66.30.Xj, 68.37.–d, 81.10.Jt, 81.30.–t
Duplex Uranus 76N is characterized by metallography, thermal and mechanical analysis. The investiga-tion shows that the microstructure of such a Duplex strongly depends on the cooling condiinvestiga-tions determin-ing the quantity of austenite formed in the ferrite matrix. Numerical simulations of 76N behavior durdetermin-ing the rolling process and service life require the knowledge of the recrystallization state during rolling steps at high temperature, thermal parameters such as dilatation, density, specific heat, thermal diffusivity, thermal conductivity and mechanical constitutive laws. These material parameters are determined and presented in this study.
© 2006 WILEY-VCH Verlag GmbH & Co. KGaA, Weinheim
1 Introduction
The first-generation Duplex stainless steels were developed more than 70 years ago in Sweden for use in the sulfite paper industry. Duplex alloys were originally created to combat corrosion problems caused by chloride-bearing cooling waters and other aggressive chemical fluids. Named Duplex because of their mixed microstructure with about equal proportions of ferrite and austenite, Duplex stainless steels are a family of grades, which range in corrosion performance depending on their alloy content. The chemical composition based on high contents of chromium, nickel and molybdenum improves intergranular and pitting corrosion resistance. Additions of nitrogen promote structural hardening by an interstitial solid-solution mechanism, which raises the yield strength and ultimate strength values without impairing toughness. Moreover, the two-phase microstructure guarantees higher resistance to pitting and stress-corrosion cracking in comparison with conventional stainless steels. Duplex solidifies initially as ferrite, then transforms on further cooling to a matrix of ferrite and austenite. In modern raw material the bal-ance should be 50/50 for optimum corrosion resistbal-ance, particularly resistbal-ance to stress-corrosion crack-ing. However, the materials strength is not significantly affected by the ferrite/austenite phase balance. As shown in [1], the main problem with Duplex is that it very easily forms brittle intermetallic phases, such as Sigma, Chi and Alpha Prime. These phases can be rapidly formed, typically 100 s exposure at 900 °C. Moreover, shorter exposure has been shown to cause a drop in toughness, which has been attri-buted to the formation of Sigma on a microscopic scale. Prolonged heating in the range 350 to 550 °C can cause embrittlement by Alpha Prime formation. For this reason the maximum recommended service temperature for Duplex is about 280 °C. However, most standards accept that deleterious phases, such as
1 2 3 4 5 6 7 8 9 10 11 12 13 14 15 16 17 18 19 20 21 22 23 24 25 26 27 28 29 30 31 32 33 34 35 36 37 38 39 40 41 42 43 44 45 46 47 48 49 50 51
Table 1 Chemical composition of the studied Uranus 76N.
C Ni Cr Mo Cu W N
<0.030 7 25 3.4 0.8 0.8 0.23
Sigma and Chi, may be tolerated if the strength and corrosion resistance are satisfactory. Fast cooling from the molten state promotes the formation of ferrite, slow cooling promotes austenite.
Duplex stainless steels are often used as plates obtained by hot rolling. A good understanding of the material behavior during hot rolling requires several investigations. First, the microstructure before hot rolling through the observation of the intermetallics, ferrite and austenite phases must be studied. The proportional changes of the ferrite/austenite must also be characterized, as the quantity of ferrite and austenite must be identical in order to provide a good material quality. Secondly, as the hot-rolling pro-cess involves recrystallization, mechanical behavior and the recrystallization state generated by hot de-formation of the ferrite and austenite phases must be studied.
Therefore, a microstructural investigation was carried out to give information on the phases present before hot rolling [2]. DTA measurement provides data on phase transformations ([3] and [4]). Mechani-cal tests such as hot compression tests allow the characterization of the Duplex steel behavior to deter-mine both the temperature effects on stress – strain curves and the evolution of the recrystallization. The final part of the paper is devoted to presenting thermophysical parameters of the Duplex steel such as dilatation, density, thermal diffusivity and conductivity. These parameters are very important and allow representative thermomechanical simulations of the forming process through numerical models [5 – 8].
2 Experimental
procedure
The studied Uranus 76N comes from a nonrolled steel slab. Its chemical composition is given in Table 1. First, the homogeneity of the slab is studied in order to check potentially different behavior inside the material during the rolling process. Therefore, a microstructure study investigates samples taken in the longitudinal (perpendicular to the casting direction) and the transversal direction of the slab.
Secondly, a DTA characterization is carried out. This analysis allows the determination of phase trans-formations during heating and cooling of the slab. This part of the investigation is important to allow the characterization of the intermetallic phases and to investigate the kinetics of the transformation.
Thirdly, the slab is characterized by mechanical tests. Compression tests are carried out at a constant strain rate of 1 s–1 and 10 s–1 at 1000 °C and 1150 °C. The aim of these tests is to understand the me-chanical behavior of the slab during hot deformation and to study the dynamic recrystallization generated by such deformations. Therefore, a metallurgical study is required on deformed samples to estimate the level of recrystallization according to the different deformation conditions: temperature, strain rate and strain.
Finally, the values of the thermophysical parameters of the slab are given as well as a description of their measurement method. The data such as the dilatation coefficient, the specific heat and the thermal diffusivity are required to simulate the forming process of Uranus 76N.
3 Microstructural
characterization
Optical microscopy investigates a nonrolled slab to identify the microstructure and particularly the fer-rite/austenite proportion both in longitudinal and transversal direction.
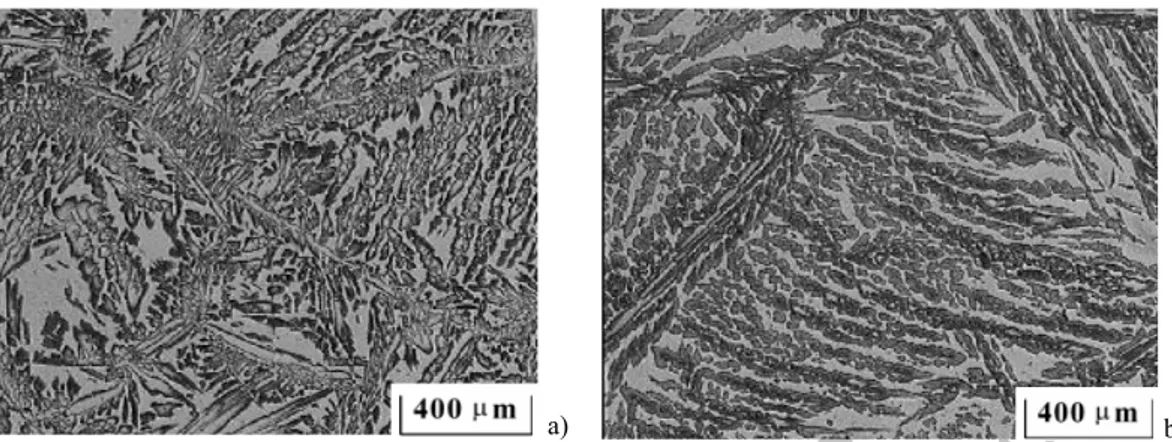
Typical microstructures obtained after Vilella etching are shown inFigs. 1a and b. The ferrite/austen-ite proportion is similar in the transversal and longitudinal directions. The shape of the initial ferrferrite/austen-ite is equiaxal in the longitudinal direction (perpendicular to the casting direction). The shape of initial ferrite and austenite (dark) is thicker and more elongated in the transversal direction (Fig. 1b). The microstruc-ture of Duplex consists of Widmanstätten austenite, as shown in [9], in a ferrite matrix with 55 – 60%
phys. stat. sol. (a) (2006) 3 1 2 3 4 5 6 7 8 9 10 11 12 13 14 15 16 17 18 19 20 21 22 23 24 25 26 27 28 29 30 31 32 33 34 35 36 37 38 39 40 41 42 43 44 45 46 47 48 49 50 51 Original Paper
Fig. 1 a) Microstructure of the nonrolled slab, longitudinal direction. b) Microstructure of the nonrolled slab, trans-versal direction.
austenite. The balance should be 50/50 for optimum corrosion resistance, particularly resistance to stress-corrosion cracking, although this ferrite – austenite proportion does not significantly affect the material strength.
A higher magnification allows the observation of a Sigma phase precipitation in the ferrite matrix (Fig. 2), which is found in the samples taken in both transversal and longitudinal directions. This Sigma phase can be the major problem, for instance, in welding thin-walled small-bore pipes made of super Duplex, although it can occur in thicker sections [9]. It tends to be found in the bulk of the material rather than at the surface, therefore it probably has more effect on toughness than corrosion resistance.
4 Differential
thermal
analysis
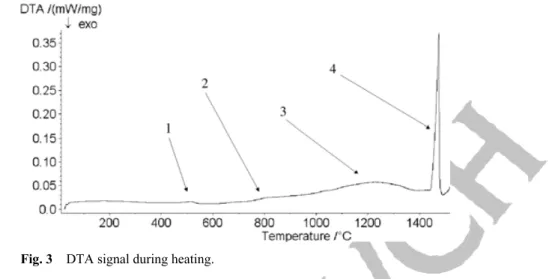
The aim of the DTA measurements is to determine the phase transformations occurring in the slab during heating and cooling and to provide information on the precipitation. The sample is heated until melting. To check the homogeneity of the slab, the DTA measurements are performed on samples taken in both longitudinal and transversal direction. Results are similar in both cases. The DTA measurement with a heating rate of 10 °C/min between room temperature and 1550 °C shows the disappearance of austenite (peak 3) and ferrite (peak 4), respectively, at about 1200 °C and 1450 °C (Fig. 3). The small peak ob-served at 500 °C (peak 1) corresponds to the inverse austenite transformation. And the one correspond-ing to dissolution of the Sigma phase is obtained at 850 °C (peak 2). These transformations are in accor-dance with the diagram given Fig. 4.
Sigma phase precipitation
Fig. 2 (online colours at: www.pss-a.com) Presence of sigma phase in the ferrite matrix.
1 2 3 4 5 6 7 8 9 10 11 12 13 14 15 16 17 18 19 20 21 22 23 24 25 26 27 28 29 30 31 32 33 34 35 36 37 38 39 40 41 42 43 44 45 46 47 48 49 50 51
Fig. 3 DTA signal during heating.
The industrial process shows that the Sigma phase can appear very quickly for Duplex steels containing simultaneously an addition of chromium > 22% and of molybdenum > 2.5% [10]. A few per cent of in-termetallic phase such as Sigma generate an important loss of resilience at room temperature. The trans-formation from α to another ferrite phase called Alpha Prime can also appear between room temperature and 600 °C. This second ferritic phase is alternated by areas very rich and very poor in chromium. This chromium content can reach 80%. As crystal lattices of Alpha and Alpha Prime are similar and the parti-cles are small, these structural modifications are hard to show by light microscopy and DTA measure-ments.
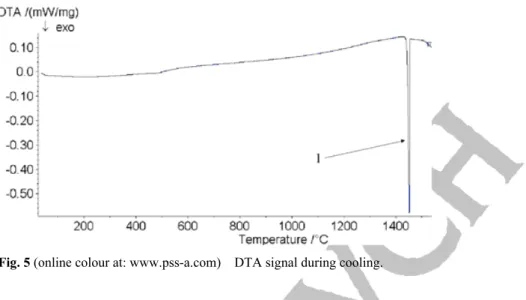
After melting, the sample is cooled at a rate of 10 °C/min. As shown in Fig. 5, the main peak obtained during cooling corresponds to the formation of ferrite at 1450 °C. Reference [11] shows that austeno – ferri-tic steels solidify totally in Alpha mode. The austenite appears during cooling and the structure can present a Widmanstätten structure or acicular ferrite. The proportion of ferrite transformed to austenite depends on the cooling rate. The volumic fraction modification of ferrite and austenite phases by thermal treatment occurs with an evolution of the chemical composition of each phase. Carbides precipitate between 700 °C
Fig. 4 Phase transformations in Duplex steels with 8% Ni [10].
phys. stat. sol. (a) (2006) 5 1 2 3 4 5 6 7 8 9 10 11 12 13 14 15 16 17 18 19 20 21 22 23 24 25 26 27 28 29 30 31 32 33 34 35 36 37 38 39 40 41 42 43 44 45 46 47 48 49 50 51 Original Paper
Fig. 5 (online colour at: www.pss-a.com) DTA signal during cooling.
and 900 °C for relatively short nucleation times (< 1 h). For longer isothermal steps, they can also appear at lower temperature. Chromium carbides are discontinuously formed at grain boundaries that move with the development of the austenite phase in chromium-depleted zones. The peaks corresponding to the austenite and the Sigma formation are not clearly observed in Fig. 5. Therefore, it means that the struc-ture formed during cooling is in the majority composed of ferrite, as confirmed by microscopy examina-tions (Fig. 6a and b).
Figures 6a and b show that the microstructure after DTA cycle is completely different from the one observed before in Fig. 1a and b. The ferrite matrix is in the majority compared to the austenite, present here in a form of needles. The transformation from ferrite to austenite does not require a lot of energy and the peak characterizing this transformation during cooling is not noticeable (Fig. 5). Regarding the quantity of austenite formed, the Duplex is in a more unstable state before heating than after cooling. The optimal structure for industrial applications must be of 50% austenite and 50% ferrite. As ferrite is largely majority to austenite, it shows that slow cooling conditions, as used for DTA measurements, are not well adapted.
In contrast to the microstructure before DTA, intermetallic phases such as Sigma are not formed dur-ing cooldur-ing.
Fig. 6 (online colour at: www.pss-a.com) a) Microstructure after DTA, longitudinal direction. b) Micro-structure after DTA, transversal direction.
1 2 3 4 5 6 7 8 9 10 11 12 13 14 15 16 17 18 19 20 21 22 23 24 25 26 27 28 29 30 31 32 33 34 35 36 37 38 39 40 41 42 43 44 45 46 47 48 49 50 51
Table 2 Compression parameters.
ε = 1 s–1 ε = 10 s–1
in transversal direction maximum strain maximum strain
T = 1000 °C 0.1 – 0.15 – 0.25 0.1 – 0.15 – 0.25
T = 1150 °C 0.1 – 0.15 – 0.25 0.1 – 0.15 – 0.25
in longitudinal direction maximum strain
T = 1000 °C 0.1 – 0.15 – 0.25
T = 1150 °C 0.1 – 0.15 – 0.25
Fig. 7 (a) Stress–strain curves in compression, in transversal direction (strain rate of 1 s–1). (b) Stress – strain curves in compression, in longitudinal direction (strain rate of 1 s–1).
a)
phys. stat. sol. (a) (2006) 7 1 2 3 4 5 6 7 8 9 10 11 12 13 14 15 16 17 18 19 20 21 22 23 24 25 26 27 28 29 30 31 32 33 34 35 36 37 38 39 40 41 42 43 44 45 46 47 48 49 50 51 Original Paper
Fig. 8 Stress–strain curves, transversal direction (temperatures: 1000 °C and 1150 °C, strain rate: 10 s–1).
Fig. 9 (a) Stress–strain curves, transversal direction (temperature: 900 °C, strain rate: 10 s–1). (b) Stress – strain curves, transversal direction (temperature: 950 °C, strain rate: 10 s–1).
a)
1 2 3 4 5 6 7 8 9 10 11 12 13 14 15 16 17 18 19 20 21 22 23 24 25 26 27 28 29 30 31 32 33 34 35 36 37 38 39 40 41 42 43 44 45 46 47 48 49 50 51
Table 3 Compression parameters and recrystallization.
strain rate (s–1) temperature (°C) strain recrystallization in ferrite phase
test 1 10 900 1 complete
test 2 10 900 0.70 nearly complete
test 3 10 900 0.50 important test 4 10 900 0.30 nil test 5 10 950 1 complete test 6 10 950 0.70 complete test 7 10 950 0.50 important test 8 10 950 0.30 nil
5 Recrystallization
study
5.1 Mechanical characterizationCompression tests are performed in order to determine the Duplex behavior during rolling in the limited range of 1000 to 1150 °C where no phase transformation occurs. Samples were taken in the transversal and longitudinal directions. These tests are carried out with a constant strain rate of 1 and 10 s–1 that covers the usual strain rate happening during rolling steps at these high temperatures. The complete test conditions are given in Table 2.
At first, samples are heated from room temperature to 1150 °C with a heating rate of 20 °C/min. After an isothermal step of 5 min (and a cooling from 1150 °C to 1000 °C for the tests requiring this tempera-ture) the compression tests are performed. Tests are stopped at a strain of 0.10, 0.15 or 0.25 in order to determine the influence of different parameters on recrystallization.
Temperature has an important affect on results (Fig. 7a and b). Stresses at 1000 °C are nearly twice those at 1150 °C. Moreover, an influence of the direction within the slab is observed. This can be related to the size of the microstructure, as noticed in Fig. 1a and b. Stress values are slightly higher for the lon-gitudinal direction. This can be related to the size of the microstructure, as noticed in Fig. 1a and b. But the curve shapes at 1000 °C and 1150 °C are similar, meaning that the recrystallization phenomenon is similar in both cases. At these high temperatures the material is ductile and no lack of forgeability is found due to complete continuous recrystallization, as shown through the compression curves flatness. The temperature effect on maximum stresses is also observed with a strain rate of 10 s–1. Figure 8 shows that as for a strain rate of 1 s–1, maximum stress values are also two times higher at 1000 °C than at 1150 °C.
Compression tests at lower temperatures (900 °C and 950 °C) and high strain rate (10 s–1) are per-formed to detect the beginning of recrystallization. Results of the compression tests are shown in Fig. 9a and b. Only one direction is chosen (transversal) as the phenomena are similar.
At 900 °C, the maximum stress value is about 305 N/mm², whereas this maximum value is on average 280 N/mm² at a temperature of 950 °C. In these temperature and strain ranges, the Duplex is ductile and the sample rupture is not systematic.
5.2 Recrystallization characterization
Table 3 gives compression parameters and the associated recrystallization states. It provides indications on the beginning and the end of the recrystallization phenomenon. At lower temperature, the recrystalli-zation is partial.
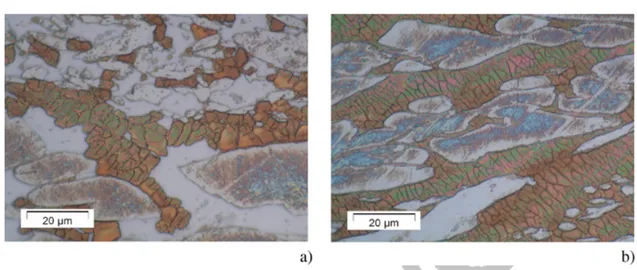
Recrystallization occurs only in the ferrite matrix (important after test 3 and complete after test 5), as no grains from recrystallization are obtained in the austenitic phase. For instance, Fig. 10a and b show the sample microstructure after tests 3 and 5, respectively. Table 3 confirms that the recrystallization in the ferrite matrix increases both with strain and temperature. The recrystallization is partial or nil at lower strain.
phys. stat. sol. (a) (2006) 9 1 2 3 4 5 6 7 8 9 10 11 12 13 14 15 16 17 18 19 20 21 22 23 24 25 26 27 28 29 30 31 32 33 34 35 36 37 38 39 40 41 42 43 44 45 46 47 48 49 50 51 Original Paper
Fig. 10 (online colour at: www.pss-a.com) (a) Microstructure after test 3. (b) Microstructure after test 5.
6 Thermal analysis
Thermal analysis includes a group of methods by which the physical and chemical properties of a sub-stance, a mixture and/or reaction mixtures are determined as a function of temperature or time, while the sample is subjected to a controlled temperature history. The thermal program may involve heating or-cooling (dynamic), or holding the temperature constant (isothermal), or any combination of these. Dilata-tion, density, specific heat, thermal diffusivity and thermal conductivity of Duplex stainless steel are determined. To observe the homogeneity of the slab, samples are taken both in the longitudinal and transversal directions.
6.1 Dilatation coefficient α and density
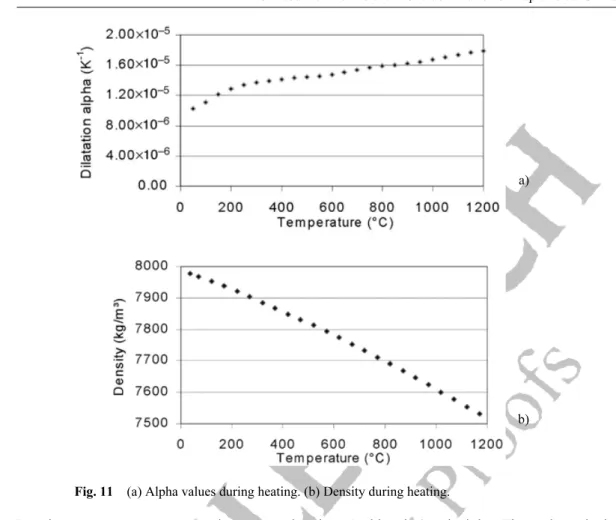
Dilatometry is a technique used to measure the relative dilatation ∆L/L0 of a material submitted to a tem-perature program (∆L is the difference between the length at temperature T and the initial length L0 at room temperature). The sample is heated from room temperature to 1200 °C and immediately cooled down. The heating and cooling rate is 3 °C min–1. The dilatation coefficient α of Uranus 76N in the lon-gitudinal direction is plotted in Fig. 11a.
The dilatation coefficient α is calculated from the elongation values ∆L(T) using relation (2), for the temperature interval (T – T0). 0 0 ∆ ( ) 1 ( )T L T L T T α = - . (2)
The dilatation is almost linear from room temperature to 1200 °C. The sensitivity of dilatation measure-ments to microstructure modification is lower than in DTA measuremeasure-ments. Therefore, it is not surprising that the transformations observed in DTA measurements are not present here.
Density is a parameter that allows determination of the thermal conductivity. As for the dilatation co-efficient, density ρ(T) is determined from dilatation measurements according to the following relation (3).
0 3 0 1 ( ) , ∆ ( ) 1 T L T L ρ =ρ Ê + ˆ Á ˜ Ë ¯ (3)
1 2 3 4 5 6 7 8 9 10 11 12 13 14 15 16 17 18 19 20 21 22 23 24 25 26 27 28 29 30 31 32 33 34 35 36 37 38 39 40 41 42 43 44 45 46 47 48 49 50 51
Fig. 11 (a) Alpha values during heating. (b) Density during heating.
Density at room temperature is measured using Archimedes’ principle. The value obtained is 7980 kg/m³. Figure 11b plots the density evolution versus temperature, from room temperature to 1200 °C. Density decreases from 7980 kg/m³ to 7520 kg/m³. As for the dilatation coefficient, the slope of the curve is nearly constant and no phase transformation is observed.
6.2 DSC-specific heat determination
DSC is a technique in which the difference in energy input into a substance and a reference material is measured as a function of temperature, while the substance and reference material are subjected to a controlled temperature program. Individual specific-heat values at different temperatures are determined using a sapphire as a standard according to the following Eq. (4).
sample bas
sta
sta
sample sta bas
DSC DSC , DSC DSC m Cp Cp m -= - (4) where,
Cp is the specific heat of the sample at temperature T
Cpsta is the tabulated specific heat of the standard at temperature T
msta is the mass of the standard
msample is the mass of the sample
DSCsample is the measured value of DSC signal at temperature T from the sample curve DSCsta is the measured value of DSC signal at temperature T from the standard curve DSCbas is the measured value of DSC signal at temperature T from the baseline
a)
phys. stat. sol. (a) (2006) 11 1 2 3 4 5 6 7 8 9 10 11 12 13 14 15 16 17 18 19 20 21 22 23 24 25 26 27 28 29 30 31 32 33 34 35 36 37 38 39 40 41 42 43 44 45 46 47 48 49 50 51 Original Paper
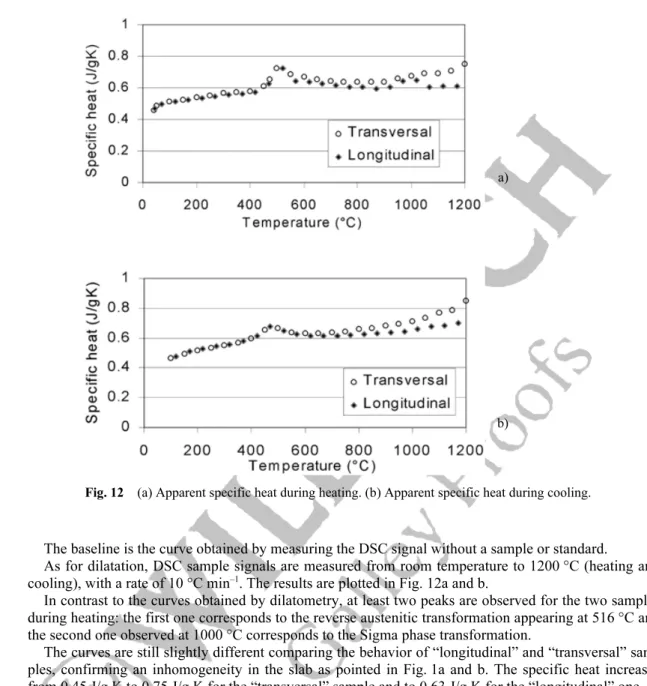
Fig. 12 (a) Apparent specific heat during heating. (b) Apparent specific heat during cooling.
The baseline is the curve obtained by measuring the DSC signal without a sample or standard.
As for dilatation, DSC sample signals are measured from room temperature to 1200 °C (heating and cooling), with a rate of 10 °C min–1. The results are plotted in Fig. 12a and b.
In contrast to the curves obtained by dilatometry, at least two peaks are observed for the two samples during heating: the first one corresponds to the reverse austenitic transformation appearing at 516 °C and the second one observed at 1000 °C corresponds to the Sigma phase transformation.
The curves are still slightly different comparing the behavior of “longitudinal” and “transversal” sam-ples, confirming an inhomogeneity in the slab as pointed in Fig. 1a and b. The specific heat increases from 0.45 J/g K to 0.75 J/g K for the “transversal” sample and to 0.63 J/g K for the “longitudinal” one. During cooling, only one peak at 470 °C localizing the austenitic transformation is observed. The dif-ference of the specific-heat values between the two samples is also observed during cooling. For the “longitudinal”, specific heat decreases from 0.75 J/g K to 0.45 J/g K. The values of the “transversal” are higher, and decrease from 0.85 J/g K to 0.45 J/g K.
6.3 Thermal diffusivity and conductivity
The thermal diffusivity D(T) of a medium is the thermophysical property that determines the speed of heat propagation by conduction during changes of temperature with time. The higher the thermal diffu-sivity, the faster the heat propagation. The thermal diffusivity affects any conductive transient heat trans-fer process within the medium. It has dimensions of length2/time and is expressed in units of m2/s.
a)
1 2 3 4 5 6 7 8 9 10 11 12 13 14 15 16 17 18 19 20 21 22 23 24 25 26 27 28 29 30 31 32 33 34 35 36 37 38 39 40 41 42 43 44 45 46 47 48 49 50 51 Laser Sample Furnace IR Sensor + Iris diaphragm SIGNAL AMPLIFIER FURNACE POWER SUPPLY LASER POWER SUPPLY SOFTWARE COMPUTER + DATA ACQUISITION PLOTTER PRINTER EXPERIMENTAL RESULT
a)
b)
Fig. 13 (online colour at: www.pss-a.com) (a) Laser flash apparatus schematic. (b) Laser pulse on the sample (NETZSCH-Gerätebau in Selb).
The most popular method used for measuring thermal diffusivity is the flash method (Fig. 13a). It has the advantage of being fast while providing values with excellent accuracy and reproducibility. The front face of a cylindrically shaped piece is homogeneously heated by an unfocused laser pulse (Fig. 13b). On the rear face of the test piece the temperature increase versus time is measured. The mathematical analy-sis of this temperature/time function allows the determination of the thermal diffusivity D(T) as pre-sented in Ref. [12].
Fig. 14 (a) Thermal diffusivity during heating. (b) Thermal conductivity during heating. a)
phys. stat. sol. (a) (2006) 13 1 2 3 4 5 6 7 8 9 10 11 12 13 14 15 16 17 18 19 20 21 22 23 24 25 26 27 28 29 30 31 32 33 34 35 36 37 38 39 40 41 42 43 44 45 46 47 48 49 50 51 Original Paper
Fig. 15 (a) Real specific heat during heating. (b) Real thermal conductivity during heating.
Figure 14a shows the evolution of the thermal diffusivity versus temperature for both transversal and longitudinal directions.
As for the previous tests, a difference is observed between the two samples. The thermal diffusivity is slightly higher for the “transversal” sample from room temperature to 1200 °C. Values increase from 3.5 × 10⁻⁶ to 6 × 10⁻⁶ m2/s for the first one and from 3.8 × 10⁻⁶ to 6.2 × 10⁻⁶ m2/s for the second one. Thermal conductivity is the measure of the ability of a material to conduct heat. For a homogeneous material, it is the rate of heat flow, under steady conditions, through unit area, per unit temperature gradient in the direction perpendicular to the area. Knowledge of thermal diffusivity D(T), density ρ(T) and specific heat Cp(T) allows the thermal conductivity χ(T) determination, calculated according the Laplace relation:
( )T D T( ) ( )T Cp T( ) .
χ = ◊ρ ◊ (5)
Samples are heated from room temperature to 1200 °C. Thermal conductivity values are given in Fig. 14b. Thermal conductivity increases from about 13 W/m K to 27.5 W/m K (for “longitudinal”) and to 34 W/m K (for “transversal”). Peaks obtained at 500 °C and 1000 °C come essentially from the spe-cific heat. Figure 15 a gives spespe-cific-heat values taking into account the quantity of heat ∆H released during the transformations.
In fact, Fig. 12 a shows the “apparent” specific heat during heating and Fig. 12b the “apparent” ther-mal conductivity.
Ignoring the quantity of heat ∆H, the specific-heat values obtained are shown in Fig. 15a (named “real” specific heat). The thermal conductivity values calculated with these specific-heat values are pre-sented in Fig. 15b.
1 2 3 4 5 6 7 8 9 10 11 12 13 14 15 16 17 18 19 20 21 22 23 24 25 26 27 28 29 30 31 32 33 34 35 36 37 38 39 40 41 42 43 44 45 46 47 48 49 50 51
Latent heat transformation can be added separately in thermal simulations taking into account transfor-mation. In this case, parameters from Fig. 15a and b are required.
7 Summary
Thermal mechanical analyses have been carried out on Duplex Uranus 76N. Dilatation coefficient, den-sity, specific heat, thermal diffusivity, thermal conductivity and σ – ε curves versus temperature are determined. These parameters consist in the material data required for numerical simulations of the roll-ing process. The measurements present results dependroll-ing on the sample direction (longitudinal or trans-versal) and the microstructure investigation explains such a behavior difference. On the other hand, the recrystallization characterization on compressed samples is described. DTA determines the Duplex be-havior during heating and cooling, showing the presence of Sigma phase and austenite/ferrite transforma-tions.
Acknowledgements The “Région Wallonne”, providing financial support (project RW 981/3793), INDUSTEEL who actively collaborated in the research are thanked for their help. A s senior research associate of the National Scientific Research Foundation (FNRS), A. M. Habraken thanks this fund.
References
[1] J. Li, T. Wu, and Y. Riquier, Mater. Sci. Eng. 174, 149 (1994).
[2] J. Lecomte-Beckers and J. Tchoufang Tchuindjang, G. I. T. Imag. Microsc. 2, 48 – 49 (2005).
[3] J. Lecomte-Beckers, L. Terziev, V. Bojnov, R. Petrov, and J. P. Breyer, J. Chim. Phys. 94, 1107 – 1115 (1997). [4] J. Lecomte-Beckers, L. Terziev, and J. P. Breyer, in: Proceedings of the 39th Mechanical Working and Steel
Processing Conference, Indianapolis, Indiana, USA, 1997, ISS vol. XXXV, pp. 423 – 431.
[5] J. Lecomte-Beckers, A. Rassili, M. Carton, and M. Robelet in: Proceedings of the Conference ESAFORM, Cluj-Napoca, Romania, 2005 (The Publishing House of the Romanian Academy), pp. 1087 – 1090.
[6] P. Moureaux, S. Moto Mpong, M. Remy, C. Bouffioux, J. Lecomte-Beckers, and A. M. Habraken, J. Phys. IV 12, 361 (2002).
[7] C. Bouffioux, M. Carton, J. Lecomte-Beckers, and A. M. Habraken in: Proceedings of the Conference NUMI-FORM, Columbus, Ohio, 2004 (American Institute of Physics AIP Conference Proceedings 712), pp. 1022 – 1027.
[8] S. Casotto, F. Pascon, A. M. Habraken, and S. Bruschi, Int. J. Mach. Tools Manuf. 45, 657 – 664 (2005). [9] X. G. Wang, D. Dumortier, and Y. Riquier, Duplex Stainless Steels 1, 128 (1991).
[10] Chromium-Nickel Stainless Steel, Mechanical and Physical Properties (International Nickel Company, Lon-don, 1962), 7.
[11] Jacques Charles, in: Les aciers inoxydables austénoferritiques Branche belge corrosion (1988/89). [12] J. A. Cape and G. W. Lehman, J. Appl. Phys. 37, 1909 (1963).