Université de Montréal
Monoacylglycerol, /-hydrolase domain-6, and the regulation of insulin secretion and energy metabolism
par Shangang Zhao
Département de biochimie Faculté de médecine
Thèse présentée à la Faculté de médecine en vue de l’obtention du grade de PhD en biochimie
August, 2015
Université de Montréal Faculté des études supérieures
Cette thèse intitulée:
Monoacylglycerol, /-hydrolase domain-6, and the regulation of insulin secretion and energy metabolism
Présentée par : Shangang Zhao
a été évaluée par un jury composé des personnes suivantes :
Sylvie Mader, président-rapporteur Marc Prentki, directeur de recherche
Jennifer Estall, membre du jury Andre Carpentier, examinateur externe Rejean Couture, Représentante du doyen de la FES
Résumé
Le cycle glycérolipides/acides gras libres (GL/FFA) est une voie métabolique clé qui relie le métabolisme du glucose et des acides gras et il est composé de deux processus métaboliques appelés lipogenèse et lipolyse. Le cycle GL/FFA, en particulier la lipolyse des triglycérides, génère diverses molécules de signalisation pour réguler la sécrétion d'insuline dans les cellules bêta pancréatiques et la thermogenèse non-frissonnante dans les adipocytes. Actuellement, les lipides provenant spécifiquement de la lipolyse impliqués dans ce processus sont mal connus. L’hydrolyse des triglycérides dans les cellules β est réalisée par les actions successives de la triglycéride lipase adipocytaire pour produire le diacylglycérol, ensuite par la lipase hormono-sensible pour produire le monoacylglycérol (MAG) et enfin par la MAG lipase (MAGL) qui relâche du glycerol et des acides gras. Dans les cellules bêta, la MAGL classique est très peu exprimée et cette étude a démontré que l’hydrolyse de MAG dans les cellules β est principalement réalisée par l'α/β-Hydrolase Domain-6 (ABHD6) nouvellement identifiée. L’inhibition d’ABHD6 par son inhibiteur spécifique WWL70, conduit à une accumulation des 1-MAG à longues chaines saturées à l'intérieur des cellules, accompagnée d’une augmentation de la sécrétion d'insuline stimulée par le glucose (GSIS). Baisser les niveaux de MAG en surexprimant ABHD6 dans la lignée cellulaire bêta INS832/13 réduit la GSIS, tandis qu’une augmentation des niveaux de MAG par le « knockdown » d’ABHD6 améliore la GSIS. L'exposition aiguë des monoacylglycérols exogènes stimule la sécrétion d'insuline de manière dose-dépendante et restaure la GSIS supprimée par un inhibiteur de lipases appelé orlistat. En outre, les souris avec une inactivation du gène ABHD6 dans tous les tissus (ABHD6-KO) et celles avec une inactivation du gène ABHD6 spécifiquement dans la cellule β présentent une GSIS stimulée, et leurs îlots montrent une augmentation de la production de monoacylglycérol et de la sécrétion d'insuline en réponse au glucose. L’inhibition d’ABHD6 chez les souris diabétiques (modèle induit par de faibles doses de streptozotocine) restaure la GSIS et améliore la tolérance au glucose. De plus, les résultats montrent que les MAGs non seulement améliorent la GSIS, mais potentialisent également la sécrétion d’insuline induite par les acides gras libres ainsi que la sécrétion d’insuline induite par divers agents et hormones, sans altération de l'oxydation et l'utilisation du glucose ainsi que l'oxydation des acides gras. Nous
et l’active, induisant ainsi l’exocytose de l'insuline. Sur la base de ces observations, nous proposons que le 1-MAG à chaines saturées agit comme facteur de couplage métabolique pour réguler la sécrétion d'insuline et que ABHD6 est un modulateur négatif de la sécrétion d'insuline.
En plus de son rôle dans les cellules bêta, ABHD6 est également fortement exprimé dans les adipocytes et son niveau est augmenté avec l'obésité. Les souris dépourvues globalement d’ABHD6 et nourris avec une diète riche en gras (HFD) montrent une faible diminution de la prise alimentaire, une diminution du gain de poids corporel et de la glycémie à jeun et une amélioration de la tolérance au glucose et de la sensibilité à l'insuline et ont une activité locomotrice accrue. En outre, les souris ABHD6-KO affichent une augmentation de la dépense énergétique et de la thermogenèse induite par le froid. En conformité avec ceci, ces souris présentent des niveaux élevés d’UCP1 dans les adipocytes blancs et bruns, indiquant le brunissement des adipocytes blancs. Le phénotype de brunissement est reproduit dans les souris soit en les traitant de manière chronique avec WWL70 (inhibiteur d’ABHD6) ou des oligonucléotides anti-sense ciblant l’ABHD6. Les tissus adipeux blanc et brun isolés de souris ABHD6-KO montrent des niveaux très élevés de 1-MAG, mais pas de 2-MAG. L'augmentation des niveaux de MAG soit par administration exogène in vitro de 1-MAG ou par inhibition ou délétion génétique d’ABHD6 provoque le brunissement des adipocytes blancs. Une autre évidence indique que les 1-MAGs sont capables de transactiver PPARα et PPARγ et que l'effet de brunissement induit par WWL70 ou le MAG exogène est aboli par les antagonistes de PPARα et PPARγ. L’administration in vivo de l’antagoniste de PPARα GW6471 à des souris ABHD6-KO inverse partiellement les effets causés par l’inactivation du gène ABHD6 sur le gain de poids corporel, et abolit l’augmentation de la thermogenèse, le brunissement du tissu adipeux blanc et l'oxydation des acides gras dans le tissu adipeux brun. L’ensemble de ces observations indique que ABHD6 régule non seulement l’homéostasie de l'insuline et du glucose, mais aussi l'homéostasie énergétique et la fonction des tissus adipeux. Ainsi, 1-MAG agit non seulement comme un facteur de couplage métabolique pour réguler la sécrétion d'insuline en activant Munc13-1 dans les cellules bêta, mais régule aussi le brunissement des adipocytes blancs et améliore la fonction de la graisse brune par l'activation
de PPARα et PPARγ. Ces résultats indiquent que ABHD6 est une cible prometteuse pour le développement de thérapies contre l'obésité, le diabète de type 2 et le syndrome métabolique. Mots-clés: Métabolisme énergétique, obésité, diabète de type 2, cycle glycérolipides/acides gras, AB-hydrolase domain 6, monoacylglycérol, cellule pancréatique beta, sécrétion d’insuline, résistance à l’insuline, brunissement des adipocytes, tissu adipeux brun
Abstract
The glycerolipid/ free fatty acid (GL/FFA) cycle is a key metabolic pathway that links glucose and fatty acid metabolism and it consists of lipogenesis and lipolysis. GL/FFA cycling, especially in its lipolysis arm, generates various lipid signaling molecules to regulate insulin secretion in pancreatic ß-cells and non-shivering thermogenesis in adipocytes. Currently, the lipolysis-derived lipid signals involved in this process are uncertain.
Triglyceride hydrolysis in mammalian cells is accomplished by the sequential actions of adipose triglyceride lipase to produce diacylglycerol, by hormone sensitive lipase to produce monoacylglycerol (MAG) and by MAG lipase (MAGL) that releases free fatty acid and glycerol. Our work shows that in pancreatic ß-cell, the classical MAGL is poorly expressed and that MAG hydrolysis is mainly conducted by the newly identified α/β-Hydrolase Domain-6 (ABHDDomain-6). Inhibition of ABHDDomain-6 by its specific inhibitor WWL70, leads to long-chain saturated 1-MAG accumulation inside the cells, accompanied by enhanced glucose-stimulated insulin secretion (GSIS). Decreasing the MAG levels by overexpression of ABHD6 in the ß-cell line INS832/13 reduces GSIS, while increasing MAG levels by ABHD6 knockdown enhances GSIS. Acute exposure of INS832/13 cells to various MAG species dose-dependently stimulates insulin secretion and restores GSIS suppressed by the pan-lipase inhibitor orlistat. Also, various biochemical and pharmacological experiments show that saturated 1-MAG levels species rather than unsaturated or 2-MAG species best correlate with insulin secretion. Furthermore, whole-body and β-cell-specific ABHD6-KO mice exhibit enhanced GSIS in vivo, and their isolated islets show elevated MAG production and GSIS. Inhibition of ABHD6 in low dose streptozotocin diabetic mice restores GSIS and improves glucose tolerance. Results further show that ABHD6-accessible MAGs not only enhance GSIS, but also potentiate fatty acid and non-fuel-induced insulin secretion without alteration in glucose oxidation and utilization as well as fatty acid oxidation. We have identified that MAG binds and activates the vesicle priming protein Munc13-1, thereby inducing insulin exocytosis. Based on all these observations, we propose that lipolysis-derived saturated 1-MAG acts as a metabolic coupling factor to regulate insulin secretion and ABHD6 is a negative modulator of insulin secretion. Besides its role in ß-cells, ABHD6 is also highly expressed in adipocytes and its level is increased with obesity. Mice globally lacking ABHD6 on high fat diet (HFD) show modestly
reduced food intake, decreased body weight gain, insulinemia and fasting glycemia and improved glucose tolerance and insulin sensitivity and enhanced locomotor activity. In addition, ABHD6-KO mice display increased energy expenditure and cold-induced thermogenesis. In accordance with this, these mice show elevated UCP1 level in white and brown adipocytes, indicating browning of white adipocytes. The browning phenotype is reproduced in the mice either chronically treated with the ABHD6 inhibitor WWL70 or an antisense oligonucleotides targeting ABHD6. White and brown adipose tissues isolated from whole body ABHD6 KO mice show greatly elevated levels of 1-MAG, but not 2-MAG. Increasing MAG levels by either exogenous administration of 1-MAG or ABHD6 inhibition or genetic deletion induces browning of white adipocytes in a cell-autonomous manner. Further evidence indicates that 1-MAGs can transactivate PPARα and PPARγ and the browning effect induced by WWL70 or exogenous MAG is abolished by PPARα and PPARγ antagonists. In vivo administration of the PPARα antagonist GW6471 to ABHD6 KO mice partially reversed the ABHD6-KO effects on body weight gain, and abolishes the enhanced thermogenesis, white adipose browning and fatty acid oxidation in brown adipose tissue. All these observations indicate that ABHD6 regulates not only insulin and glucose homeostasis but also energy homeostasis and adipose tissue function.
Thus, ABHD6-accessible 1-MAG not only acts as a metabolic coupling factor to regulate fuel and non-fuel induced insulin secretion by activating Munc13-1 in beta cells, but also regulates glucose, insulin and energy homeostasis. The latter effects are mediated at least in part via browning of white adipocytes and enhanced brown fat function through the activation of PPARα and PPARγ. Collectively these findings suggest that ABHD6 is a promising target for developing therapeutics against obesity, type 2 diabetes and metabolic syndrome.
Keywords: Energy metabolism, obesity, type 2 diabetes, glycerolipid/fatty acid cycling, AB-hydrolase domain 6, monoacylglycerol, pancreatic ß-cell, insulin secretion, adipose browning, brown adipose tissue,
Table des matières
RÉSUMÉ...3
ABSTRACT...6
Table des matières...8
Liste des figures...11
Liste des abréviations...12
Remerciements………..……….17
Introduction………18
1.1 Energy metabolism, obesity and type 2 diabetes……….18
1.1.1 Glucose and lipid metabolism in obesity and type 2 diabetes………..19
1.1.2 Glycerolpid/Free Fatty Acid (GL/FFA) cycling………...20
1.1.2.1 Enzymology and metabolites………...20
1.1.2.2 Role in cellular signaling and fuel detoxification………..25
1.1.2.3 Regulation of MAG levels in mammalian cells…………...28
1.2 Pathogenesis of type 2 diabetes………...29
1.2.1 The various forms of type 2 diabetes………...29
1.2.2 Obesity-induced Insulin resistance………...31
1.2.2.1 Elevated free fatty acids in obesity and insulin resistance………....…32
1.2.2.2 Adipocytes secreted adipokines and insulin resistance……….33
1.2.2.3 Obesity -associated inflammation and insulin resistance………..33
1.2.2.4 Neural mechanisms links to obesity-induced insulin resistance………....…34
1.2.3 Islet-beta cell dysfunction and failure……….…………35
1.2.3.2 Lipotoxicity………...……….……37 1.2.3.3 Glucolipotoxicity……….……..38 1.2.3.4 ER stress………..……….….….39 1.2.3.5 Inflammation………..……….….…..40 1.2.3.6 Additional mechanisms………..………….…...41 1.3 Insulin secretion………...42 1.3.1 Insulin exocytosis………...…….…42
1.3.1.1 Triggering and amplification pathways in glucose induce insulin secretion…...44
1.3.2 Fuel and non-fuel induced insulin secretion...………45
1.3.2.1 Glucose………..46
1.3.2.2 Free fatty acids………...47
1.3.2.3 Amino acids………...48 1.3.2.4 GLP-1 and GIP………...………….………49 1.3.2.5 Acetylcholine………...50 1.3.2.6 Somatostatin………50 1.3.2.7 Galanin……….…………51 1.3.2.2.5 (Nor)epinephrine……….………..51
1.3.3 Metabolic signaling in insulin secretion………...52
1.3.3.1 Anaplerosis and cataplerosis-derived signals………53
1.3.3.2 Electron transport-derived signals……….56
1.3.3.3 Inositol lipids and polyphosphates……….57
1.3.2.4 GL/FFA cycling and lipid signaling for insulin secretion……….57
1.4 Adipocytes and energy metabolism……….59
1.4.1.1 Classical brown adipocytes………61
1.4.1.2 White adipocytes………....………62
1.4.1.3 Beige adipocytes………64
1.4.2 Adipocytes browning pathways and signals……….66
1.4.2.1 Cold exposure……….…...………67
1.4.2.2 Exercise, Irisin and IL-6………68
1.4.2.3 Hormones and peptides...……….………...…………70
1.4.2.4 Metabolites and browning……….………72
1.4.2.5 Gene-manipulations and pharmacological agents causing browning…………74
1.4.3 PPARs in energy metabolism………...78
1.4.3.1 PPAR isoforms and their tissue distribution………78
1.4.3.2 Role in lipid metabolism………..79
1.4.3.3 PPARs and browning of white adipocyes………80
1.5 Overall rationale and hypothesis of the thesis……….82
Article 1……….84 Article 2………...145 Article 3………...…………172 2 Discussion……….…234 3 Perspective………252 4 Bibliographie……….………255
Liste des figures
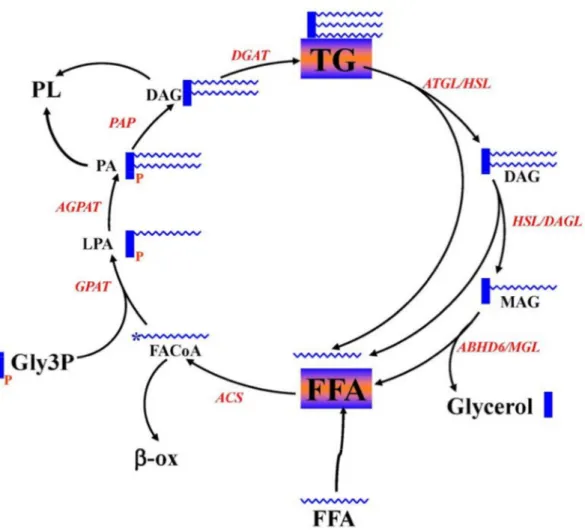
Figure 1 Enzymes and intermediates of GL/FFA cycling……….21
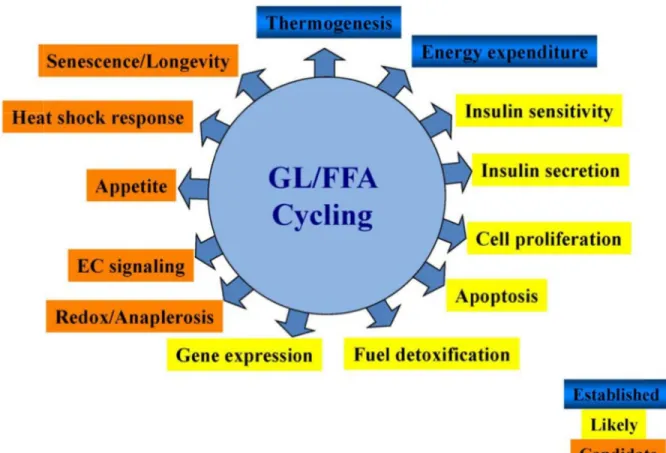
Figure 2 Biological processes regulated by GL/FFA cycling………26
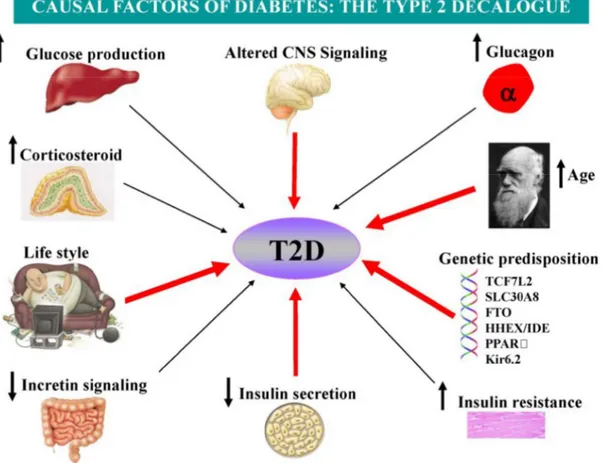
Figure 3 The possible causal factors of T2D……….30
Figure 4 Islet beta cell failure and natural history of T2D……….36
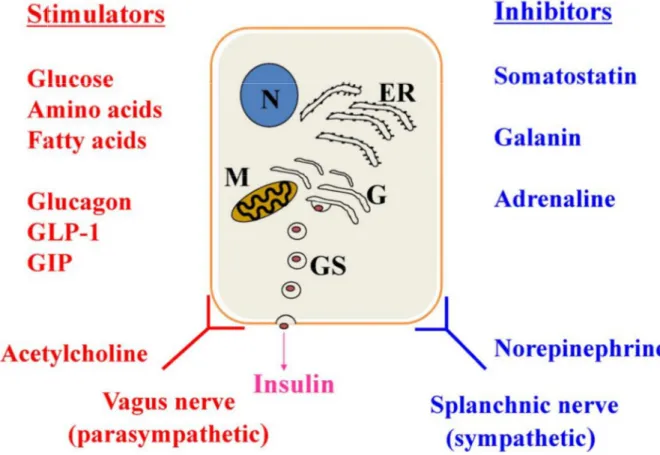
Figure 5 Fuel and non-fuel-induced insulin secretion………...46
Figure 6 Triggering and K+-ATP independent/ amplification pathways in beta cell metabolic signaling. ………...………47
Figure 7 Integrated view of metabolic signaling pathways generating metabolic coupling...53
Figure 8 Anaplerotic- and Cataplerotic-Derived Signals for Insulin Secretion... ………54
Figure 9 The GL/FFA Cycle and Lipid Signaling for Insulin Secretion...59
Figure 10 Lineage of white, beige and brown adipocytes...60
Figure 11 Different agents induced browning of white adipocytes...67
Figure 12 Beneficial effects of deletion of ABHD6 in various tissues………234
Liste des abréviations
2-AG: 2-arachidonoylglycerol 18FDG: 18F-fluorodeoxyglucose ABHD6: α/β-Hydrolase Domain-6 Ach: Acetylcholine
AMPK: 5' AMP-activated protein kinase ATF6: activating transcription factor 6 ATGL: adipocytes triglyceride lipase BAIBA: β-aminoisobutyric acid BMI: body mass index
BMP: bone morphogenetic proteins CHOP: C/EBP homologous protein COX2: cyclooxygenase-2
CPT1: carnitine palmitoyltransferase-1 CNS: central nervous system
CREB: cAMP response element-binding protein DAGL: diacylglycerol lipase
DGAT: diacylglycerol acyltransferase DHA: docosahexaenoic acid
DIO2: type II iodothyronine deiodinase EPA: eicosapentaenoic acid
ER: endoplasmic reticulum
ERK: extracellular signal–related kinase ETC: electron transport chain
FFA: free fatty acid
FGF21: fibroblast growth factor 21
FNDC5: fibronectin type III domain containing 5 G0S2: G0/G1 switch gene 2
GDM: gestational diabetes mellitus
GIP: glucose-dependent insulinotropic peptide GL/FFA cycling: glycerolipid/ free fatty acid cycling GLP1: glucagon-like peptide-1
GLUT: glucose transporter
GPAT: glycerolphosphate acyltransferase HFD: high fat diet
HIF-1α: hypoxia inducible factor 1alpha HSL: hormone sensitive lipase
IL-1β: interleukin-1β
InsP3: 1, 4, 5- inositiol trisphosphate IRE1: inositol requiring protein1 JNK1: JUN N-terminal kinase 1 LCCoA: long-chain acyl-CoA
LPA: lysophosphatidic acid
LPAAT: lysophophatidic acid acyltransferase MAG: monoacylglycerol
MAGL: monoacylglycerol lipase MCD: malonyl-CoA decarboxylase MCF: metabolic coupling factor
MDP: the morphologically docked pool MODY: maturity onset diabetes of youth Myf5: myogenic factor 5
NAFLD: nonalcoholic fatty liver disease NP: natriuretic peptides
PA: phosphatidic acid
PAP: phosphatidic acid phosphatase PDX1: pancreas-duodenum homeobox-1 PERK: PKR-like kinase
PGC1α: peroxisome proliferator-activated receptor gamma coactivator 1α PIP3: phosphatidylinositol 3, 4, 5- triphosphate
PKA: protein kinase A
PKG: GMP-dependent protein kinase PL: phospholipids
POMC: proopiomelanocortin
PRDM16: PRD1-BF-1-RIZ1 homologous domain-containing protein-16 RAR: retinoid acid receptor
ROS: reactive oxygen species
RRP: readily released pool of granules RXR: retinoid X receptor
SNAP: synaptosomal-associated protein 25
SNARE: soluble N-ethylmaleimide-sensitive factor (NSF) attachment protein receptor SSRS5: somatostatin receptor subtype 5
STAT: signal transducer and activator of transcription STZ: streptozotocin
TBX1: T-box transcription factor-1 Tmem26: transmembrane protein 26 TG: triacylglycerol
TG/FFA cycling: triacylglycerol/ free fatty acid cycling T1D : type 1 diabetes
T2D: type 2 diabetes UCP: uncoupling proteins
VEGF: vascular endothelial growth factor ZDF: Zucker Diabetic Fatty
It is not because things are difficult that we do not dare; it is because we do not dare that they are difficult. ~ Seneca
Remerciements
Many thanks to my supervisor- Dr. Marc Prentki, who gave me the chance to join his lab and it completely changed my life. Without Marc, all the achievements do not exist. Marc is such a nice boss that he always puts the student’s need as his priority. And he always made some time to talk to me about my strong points and my weak points to give reasonable advice to improve myself. In the last few years, I learned a lot from him.
Many thanks to my co-supervisor Dr. Murthy Madiraju, who always treats me as his son. He helped a lot not only in science, but also in my personal life. He helped me with everything in such a detail and through discussions with him, I could get lots of good advice to solve the problems. When issues raised among people inside or outside the lab, he always tried his best to help me search for the best solutions, and gave me valuable advice on how to prevent such issues again.
Many thanks to Dr. Erik Joly and Dr. Marie-line Peyot. Through discussion during PLDD, lab meeting and MDRC seminars, new clues are given to help solve the experimental problems and to accelerate experimental process and also they both helped me in improving my oral presentations.
Many thanks to Mr. Yves Mugabo and Dr. José Iglesias. As close friends, they did everything they could to help me. Their encouragement helped me a lot for trouble-shooting the experiments and the issues with people.
Many thanks Dr. Annie, Mr. Marco and Dr. Julien, who gave me the training when I entered the lab. Special thanks to Annie, a really good and strict teacher, and made me learn a lot to start my experiments.
For sure, I do not forget the people in MDRC/CRCHUM. There is a long list of people in my mind and I am very grateful for all what they all brought to me.
At last, many thanks to my wife- Xiaomeng and my babies- Chloé, Chris and Christina, and my parents for their help in encouraging and supporting in my research and daily life. With babies, the first year is always difficult, but we always get more happiness than we expected.
1. Introduction
1.1 Energy metabolism, obesity and type 2 diabetes
The survival of all species depends on energy homeostasis, a precise balance between energy intake and expenditure (Woods et al., 1998). Through evolution, human and animals have developed multiple and complex mechanisms to regulate energy homeostasis to regulate body weight (Ebbeling et al., 2012). In order to maintain normal body weight, energy intake needs to be equal to energy expenditure. Besides this, macronutrient oxidation also has to be balanced with macronutrient intake (Imbeault et al., 1997). Several decades ago, most people in the developed world needed to work hard physically to obtain sufficient food for consumption, and at that time, energy intake and energy expenditure were more well-balanced. However, in our modern society with rapidly developing technology, economic development and industrialization, there is a wide choice of highly caloric food at relatively low cost. Also more and more people prefer to choose meals rich in saturated fatty acids and starch but low in fiber, together with sugar-sweetened beverages (Mela, 2001). In conjunction with more sedentary lifestyle, energy from food intake has often considerably surpassed the daily energy expenditure. The surplus energy is predominantly stored in the form of triacylglycerol (TG) in the subcutaneous and visceral fat depots and other tissues, such as liver, and muscle thereby contributing to obesity among these people and this is particularly marked for individuals with low basal metabolic rate and physical activity (Alappat and Awad, 2010).
As a result of imbalance between energy intake and energy expenditure, the incidence of obesity has increased greatly over the last decades and has become a major socio-economic burden all over the world, especially in developed countries. According to the American Diabetes Association, nearly one third of the total US (Halter et al., 2014) population is affected by obesity and a similar situation is observed in Canada. A report from the National Diabetes Surveillance System indicated that approximately 25% of all Canadian adults are obese as are 10% of the children (Anis et al., 2010).
Obesity-associated systemic insulin resistance is generally thought to be a primary cause for many disorders, such as cardiovascular diseases, hypertension, and type 2 diabetes (T2D)
(Guo, 2014). The parallel rapid increase of individuals with obesity and T2D all over the world is striking and the term ‘diabesity’ has been created to emphasize the potential link between these two conditions (Astrup and Finer, 2000). Besides obesity-associated insulin resistance, insufficient insulin secretion resulting from beta cell dysfunction is another major cause of T2D and type 1 diabetes (T1D) (Eizirik and Darville, 2001; Kahn, 2003). According to the World Health Organization and the International Diabetes Federation, the number of diabetic patients has climbed from 100–135 million in 1994–1995 up to approximately 382 million in 2013, and this number is expected to rise to 592 million by 2035 (Guariguata et al., 2014). In Canada, approximately 1.9 million men and women have been diagnosed with diabetes in 2005-2006, which represents about 1 in 17 Canadians - 5.5% of all women and 6.2% of all men. According to recent statistics in 2013, more than 9 million Canadians live with undiagnosed or diagnosed diabetes or pre-diabetes (Baillot et al., 2014).
1.1.1 Glucose and lipid metabolism in obesity and type 2 diabetes
Impaired metabolism of glucose and lipid is observed in humans with obesity and T2D (Fujioka et al., 1987). Glucose metabolism in mammalian cells requires specific transporter to transport glucose inside the cells. The translocation of the glucose transporter 4 (GLUT4) from cytoplasm to plasma membrane is regulated by the insulin signaling pathway. However, insulin resistance in subjects with obesity or T2D curtails the translocation of GLUT4 to the plasma membrane and thus glucose metabolism inside the cells, in particular in skeletal muscle, is impaired, leading to hyperglycemia, a hallmark of T2D (Mackenzie and Elliott, 2014). The main pathway for glucose utilization is its oxidation through glycolysis and Krebs cycle to produce energy. In the case of obesity or T2D, nutrient oversupply leads to excess ROS production in the mitochondria or increases ER work load, and eventually causes oxidative and ER stress, which in turn have detrimental effects on cellular function. Also, if the TCA cycle is saturated with intermediates, some of the glucose carbons enter other metabolic pathways, which will generate metabolites that become toxic when in excess, such as lysophospatidate (LPA), 1,2 diacylglycerol (DAG) and ceramides, which further affect cell function (Nolan and Prentki, 2008; Poitout and Robertson, 2002).
Taegtmeyer, 2009). In subjects with obesity and T2D, glucose supply is always present, and fatty acid oxidation is under strong inhibition, and thus most of the lipid precursors enter esterification pathway producing triglycerides (TG) and additional complex lipids, for storage in the adipocytes, which further contributes to obesity (Zechner et al., 2012). Once the limitation for fat storage in the adipocytes is reached, the newly synthesized fat is ectopically accumulated in muscle tissues and liver, and further contributes to insulin resistance and increased circulating glucose levels (Shulman, 2014).
1.1.2 Glycerolipid/ free fatty acid (GL/FFA) cycling
GL/FFA cycling, previously named as triacylglycerol/ free fatty acid cycling (TG/FFA cycling), was first described in 1965. With the rapidly increasing knowledge of the mechanisms of obesity and diabetes and the implication of altered lipogenesis and lipolysis in these diseases, it is gradually becoming evident that this cycling is located at the center of metabolic networks, tightly linking glucose and FFA metabolism, with important roles in regulating many signaling molecules controlling numerous biological processes (Prentki and Madiraju, 2008, 2012).
1.1.2.1 Enzymology and metabolites
GL/FFA cycling is active under both fed and fasting states and occurs in almost every cell, tissue, organ and organism. The biological process of this cycle involves the esterification of FFA onto a glycerol backbone to synthesize glycerolipids followed by their hydrolysis with the release of the FFA that can be re-esterified to reenter the cycle (Prentki and Madiraju, 2008). Lipogenesis and lipolysis, two essential parts of GL/FFA cycling, were generally regarded as two separate independent processes. In the Prentki`s laboratory, we found that these two processes are closely linked to each other: thus some TG, once synthesized during lipogenesis, goes through lipolysis to generate glycerol and FFA.
Figure 1 be found The init enzyme fatty ac glycoly generate from th acyl-sn-this pro complet 2009). L Enzymes and d in the chapte tial step in l e glycerolpho cid-CoA (Fig sis of gluco ed from de e lipolysis p -glycerol-3-p ocess is cata ted with th LPA, PA an d intermediat er. The figure lipogenesis osphate acyl gure 1) (Tak se or glucon novo fatty a process. LPA phosphate ac alyzed by P e enzyme d nd diacylgly tes of GL/FFA e is modified is to synthe ltransferace keuchi and neogenesis i acid synthesi A is further e cyltransferas A phosphat diacylglycer ycerol (DAG A cycling. Th from Endocr size lysopho (GPAT) usi Reue, 2009 in the liver ( is or exogen esterified to p
se. The form tase (PAP). ol acyltrans G) generated he detailed des r Rev. 2008 osphatidic ac ing substrate 9). Glycerol-(Pages et al nous fatty ac phosphatidic mation of dia Finally, trig sferase (DG d from lipog scription of th Oct; 29(6):6 cid (LPA) c es glycerol-3 -3-phosphate l., 2001). Fa cids from fo c acid (PA), acylglycerol glyceride (T GAT) (Takeu genesis proc his cycling ca 647-76. catalyzed by 3-phosphate e is derived atty acid-CoA ood digestion catalyzed b is from PA, TG) synthesi uchi and R cess can also
an y the and d via A is n or by 1-and is is Reue, o be
incorporated into phospholipids (PL) (Vance and Tasseva, 2013). Following lipogenesis, the synthesized metabolites, such as TG, DAG and phospholipids (PL), could go through lipolysis process. The full lipolysis process involves the complete breakdown of TG into glycerol and FFA (Prentki et al., 2013b; Zechner et al., 2012). In this process, TG is first degraded to DAG by the enzyme adipocytes triacylglycerol lipase (ATGL) (Smirnova et al., 2006), and then DAG is hydrolyzed to monoacylglycerol (MAG), catalyzed by hormone sensitive lipase (HSL) (Vaughan et al., 1964) and DAG lipase (DAGL) (Bisogno et al., 2003), and finally MAG is hydrolyzed to glycerol and FFA using the enzyme monoacylglycerol lipase (MAGL) (Fredrikson et al., 1986) and α/β-Hydrolase Domain-6 (ABHD6) (Blankman et al., 2007a; Zhao et al., 2014).
It is now well-accepted that the GL/FFA cycle is under stringent control via separate enzymes for forward and backward reactions. The rate-limiting step in this cycle lies in the initial step using glycerol-3-phosphate and fatty acid-CoA to produce LPA (Pages et al., 2001). So the enzyme glycerol-3-phosphate acyltransferase (GPAT) involved in this step is of special importance. Currently, four isoforms of GPAT have been cloned and identified, viz., GPAT1 to GPAT4. GPAT1 and GPAT2 are mainly localized in the mitochondria, while GPAT3 and 4 are in the endoplasmic reticulum (ER) (Wendel et al., 2009). Mitochondrial GPAT1 has been characterized more thoroughly than the other isoforms and shown to represent more than 50% of total enzymatic activity (Wendel et al., 2013). GPAT1 deficient mice display markedly lower hepatic TG and DAG concentration, and are protected from hepatic steatosis (Xu et al., 2006) and hepatic insulin resistance possibly because of a lower DAG-mediated PKC activation (Neschen et al., 2005). Further study using metabolomics analysis shows that several metabolites, including palmitate, 1-mono-16:0-acyl-glycerol, 1,2-di-16:0-acyl-glycerol are decreased, and other metabolites involved in carbohydrate metabolism are increased in the GPAT1 KO mice (Li et al., 2010), which may provide important clues to explain high insulin sensitivity in these mice. Besides GPAT1, mice deficient in GPAT4 have also been generated (Nagle et al., 2008), and these mice show 49% lower total GPAT activity and exhibit a 25% reduction in body weight and resistance to both diet-induced and genetically induced obesity with increased thermogenesis (Vergnes et al., 2006).
The second enzyme involved in this cycle is 1-acyl-sn-glycerol-3-phosphate acyltransferase (AGPAT), also named as lysophophatidic acid acyltransferase (LPAAT), catalyzing the reaction from LPA to PA. Several isoforms of LPAAT have been identified, and only AGPAT1 and AGPAT2 show high activity (Agarwal et al., 2011). Mice deficient in AGPAT2 develop severe lipodystrophy affecting both white and brown adipose tissues, displaying extreme insulin resistance, diabetes, and hepatic steatosis associated with high expression of lipogenic genes and high rates of de novo fatty acid biosynthesis (Cortes et al., 2009).
PA phosphatase (PAP) is responsible for converting PA to DAG. In mammals, two types of PAP (PAP1 and PAP2) have been recognized (Takeuchi and Reue, 2009). PAP-1 is found mainly in the ER and believed to be involved in the synthesis of TG and PL. PAP-2 is located near the plasma membrane and may be producing DAG from PA released from membrane. The next important enzyme involved in acylating DAG to TG is diacylglycerol acyltransferase (DGAT), with important roles in regulating energy storage and metabolism (Smith et al., 2000). Two types of DGAT (DGAT1 and DGAT2) exist in the mammals. DGAT1 has been reported to be highly expressed in skeletal muscle, intestine as well as other tissues, whereas DGAT2 is mostly expressed in the adipocytes and liver. Overexpression of DGAT1 in rat islets has been shown to increase palmitate incorporation into TG resulting in a modest accumulation in TG content and decreased glucose-stimulated insulin secretion, which may be due to “glucolipotoxicity” (Poitout and Robertson, 2002). DGAT-1 knockout mice were shown to have increased insulin sensitivity and enhanced glucose tolerance, and protected from diet induced obesity (Harris et al., 2011); DGAT2 also plays a fundamental role in mammalian triglyceride synthesis and is required for survival based on the fact that DGAT2-deficient mice are lipopenic and die soon after birth, apparently from profound reductions in substrates for energy metabolism and from impaired permeability barrier function in the skin (Yen et al., 2008). Also in both KO mice, DGAT1 was unable to compensate for the absence of DGAT2, supporting the hypothesis that the two enzymes play fundamentally distinct roles in mammalian triglyceride metabolism.
The process of lipolysis is also highly dependent on several enzymes, depending on different reactions. TG hydrolysis is conducted by adipose TG lipase (ATGL), (previously named desnutrin and patatin-like domain containing phospholipase A2, PNPLA2) (Smirnova et al.,
2006), which is the rate-limiting step of lipolysis. It is now known that ATGL when stimulated by CGI58, hydrolyses TG at sn-1 position (Mayer et al., 2015), releasing 2,3-DAG, which is not known as a signaling molecule as 1,2-DAG. On the other hand, ATGL when not associated with CGI58, prefers to hydrolyze TG at the sn-2 position, producing 1,3-DAG (Eichmann et al., 2012).
The product of TG hydrolysis is either 2,3 DAG or 1,3 DAG, and both of these are hydrolyzed by hormone sensitive lipase (HSL) to generate either 2- or 1-MAG. However, the membrane-bound sn-1 DAG lipase hydrolyzes 1,2-DAG that primarily arises from phospholipase C action on the membrane phospholipids. HSL displays a broad specificity for its substrates in vitro, including TG, DAG, MAG and cholesterol esters (CE). However, under in vivo conditions and inside the cells HSL preferentially hydrolyzes DAG to MAG, than TG to DAG and far better than MAG to glycerol (Fredrikson et al., 1981). The activity of HSL is markedly activated by protein kinase A and cAMP raising agents. sn-1 DAG lipases show high activity in brain and pancreatic beta cells compared to other tissues. This enzyme shows remarkable specificity to sn1,DAG containing arachidonic acid (AA) at position 2 and releases 2-arachidonoylglycerol (2-AG), an endocannabinoid, which is an important signaling molecule for activating CB-1 and CB-2 receptors (Hoover et al., 2008).
Hydrolysis of MAG is mainly conducted by the classical MAGL in many tissues. Besides the classical MAGL, other enzymes that can hydrolyze MAG have been identified recently and these include α/β- Hydrolase domain 6 (ABHD6) and ABHD12. MAGL is highly expressed in adipose tissue, liver and brain and responsible for most of the MAG hydrolysis activity in these tissues. MAGL is mainly a cytosolic enzyme. ABHD6 and ABHD12 are shown to hydrolyze MAG in brain, and both of the enzymes account for 15% of total MAG hydrolysis activity. ABHD6 and ABHD12 are located in the plasma membrane, with the catalytic site of ABHD6 facing the cytosolic side of the membrane, and the catalytic site of ABHD12 facing the exterior of the cell. (Blankman et al., 2007a). ABHD6 is shown to be widely expressed in many tissues, including pancreatic islets, liver, adipose tissue and brain, while the tissue distribution of ABHD12 is not very clear. Besides their MAG hydrolyzing activity, ABHD6 and ABHD12 are also shown to hydrolyze other substrates with lower efficiency. Recently, ABHD6 is shown to hydrolyze lysophospholipids such as lysophosphatidylcholine (Thomas et
al., 2013) and also bis(monoacylglycero)phosphate (Pribasnig et al., 2015), even though the physiological relevance of these activities in vivo is not known. Similarly, ABHD12 is also shown to be the major brain lysophosphatidylserine (lyso-PS) lipase. Genetic deficiency of ABHD12 in humans leads to a neurodegenerative disease called polyneuropathy, hearing loss, ataxia, retinitis pigmentosa and cataract (PHARC) (Blankman et al., 2013).
1.1.2.2 Role in cellular signaling and fuel detoxification
As indicated above, GL/FFA cycling consists of multiple steps, catalyzed by separate enzymes in its lipogenic and lipolytic arms. Such a complex enzyme system offers several “regulating points” to better and more conveniently control this cycling, in order to meet the diverse needs of signaling metabolite supply for biological functions. Disturbance of this cycle leads to a wide range of pathophysiological conditions, including obesity, T2D, hypertension, cardiovascular disease and cancer (Prentki and Madiraju, 2008, 2012).
The GL/FFA cycle is able to generate signaling molecules regulating numerous biological functions. These roles could be grouped into three categories: established roles, emerging or likely roles and candidate roles (Figure 2). The established role refers to thermogenesis. In mammals, maintenance of body temperature is at least in part, if not largely dependent on lipolysis, an essential part of GL/FFA cycling. FFA released from lipolysis can activate mitochondrial uncoupling proteins (UCPs), which dissociate the respiration from ATP production to dissipate the respiratory energy as heat. Different rodent models, which show some defects in lipolysis, such as ob/ob mice, ATGL-KO mice and Zucker fatty rats, show intolerance to cold exposure, and the main reason for this may be due to their inability to increase lipolysis to generate sufficient heat to maintain normal body temperature (Triandafillou and Himms-Hagen, 1983).
Figure 2 signals t likely em adapted Among fuel ove express GL/FFA “glucod reincorp kinase. de novo either tr as an en 2: Biological to regulate dif merging roles from Endocr the emergin ersupply, reg ion and insu A cycling a detoxification porated in th Also, in a “ o synthesis o ransported o nergy-consu processes reg fferent biolog s are listed in r Rev. 2008 ng roles of G gulation of c ulin secretion allows for f n” process he cycle in “lipodetoxifi of FFA, and out of the cel uming and fu gulated by G gical processe yellow, and Oct;29(6):64 GL/FFA cycl cell survival n. fuel detoxif it directs th most cell ty cation” proc d these newl lls or transpo utile pathwa GL/FFA cycli es. Some estab
some candid 47-76. ling, recent r and prolifer fication (No he glucose ypes, as the cess, a large ly synthesize orted into m ay (each turn ing. GL/FFA ablished roles date roles are
research has ration, as we olan and Pr carbon to ey express v e portion of ed FFA and mitochondria n of GL/FFA cycling gene are highlight indicated in r s suggested d ell as the reg
entki, 2008 glycerol, w very low lev
glucose carb d lipolysis-re
for beta oxi A cycling co
erates many ted in blue. S red. The figu
detoxificatio gulation of g ) because i which cannot vels of glyc bons is used eleased FFA idation. Furt onsumes 7 A lipid Some ure is on of gene in a t be cerol d for A are ther, ATP
molecules) this cycle releases energy in the form of heat. Thus, several steps in this cycling involve ATP usage, such as conversion of FFA into fatty acid-CoA and LPA and PA synthesis by acylglycerol kinase enzymes. The released heat is necessary to maintain normal body temperature.
Another emerging role of GL/FFA cycling is to regulate gene expression. Some intermediates generated in the cycling, such as DAG, could directly or indirectly activate hypoxia inducible factor 1alpha (HIF-1α), a transcription factor that regulates the expression of various glycolytic enzymes, vascular endothelial growth factor (VEGF) and cell survival. Recently, protein lysine acetylation has emerged as a key posttranslational modification in cell function regulation (Zhao et al., 2010), and some studies showed that lysine acetylation is a prevalent modification of enzymes that participate in intermediary metabolism according to cellular nutrition conditions. GL/FFA cycle is a highly active metabolic pathway, which continuously uses NADH and regenerates NAD, which is a substrate for the protein deacetylation enzymes, sirtuins, which regulate a wide range of cellular functions including gene expressions (Haigis and Guarente, 2006). Thus it is also possible that GL/FFA cycle controls gene expression by regulating redox state, sirtuin activity and protein lysine deacetylation. Also, because of the ability of GL/FFA cycle to activate sirtuins, which are well known for their involvement in promoting longevity, the possibility that GL/FFA cycle indirectly contributes to longevity exists (Park et al., 2013b).
GL/FFA cycle may also be implicated in the regulation of cell survival and proliferation through the distribution of metabolites into tissues and avoiding their toxic build up. High circulating levels of FFA in combination with elevated glucose levels (glucolipotoxicity) is toxic to non-adipose cells, such as beta cells, as these metabolites can disturb many cellular processes, in particular mitochondrial function and energy homeostasis (van Raalte and Diamant, 2011). Several reports have shown that TG accumulation in non-adipose cells could be regarded as a defensive mechanism against acute FFA toxicity (Cheon and Cho, 2014). TG build-up, together with highly active GL/FFA cycle could protect the cells as long as the cells retain the ability to hydrolyze TG to maintain normal amount of TG. The role of the GL/FFA cycle in the regulation of insulin secretion will be discussed in the next chapter in details.
1.1.2.3 Regulation of MAG levels in mammalian cells
The levels of MAG inside the cells are generally regulated by the synthesizing enzymes and degrading enzymes. MAG is mainly produced from lipolysis process through hydrolysis of DAG by HSL and DAGL. Overexpression of ATGL, the rate-limiting step in lipolysis was shown to increase the release of glycerol and FFA (Pulinilkunnil et al., 2013) and probably leads to elevated MAG in cells. Deletion of ATGL in mice leads to large amounts of TG accumulation, reduced glycerol and FFA release (Huijsman et al., 2009) and probably results in lowered MAG levels.
For MAG metabolizing enzymes, three different enzymes, including MAGL, ABHD6 and acyl CoA: monoacylglycerol acyltransferase (MGAT), have been identified. MAGL is considered as the main MAG hydrolyzing enzyme. MAGL is highly expressed in various tissues, including different fat depots, liver and brain (Taschler et al., 2011). Deletion of MAGL in mice leads to MAG accumulation in liver, adipose and brain, and protects mice from high fat diet (HFD)-induced insulin resistance as it reduces circulating FFA levels in the plasma. Even in the adipocytes isolated from MAGL KO mice, some MAG hydrolysis activity is still detectable, indicating that other enzyme(s) can hydrolyze MAG to a significant extent (Taschler et al., 2011). In 2007, another two enzymes ABHD6 and ABHD12 were identified using activity based protein profiling methods in brain tissue (Blankman et al., 2007a), and these two enzymes were shown to contribute to 15% of the total MAG lipase activity in the brain, while classical MAGL is responsible for the remaining 85%. Recent studies have shown that ABHD6 is highly expressed in several tumor cell lines, such as the breast cancer cell line MCF7, but the significance of this high expression is not clear (Li et al., 2009; Max et al., 2009). Another report demonstrated that inhibition of ABHD6 in brain produced the cannabinoid effect via accumulation of 2-AG, indicating the important roles of ABHD6 in regulating cell function (Marrs et al., 2010; Tchantchou and Zhang, 2013). However, the relative importance of ABHD6 in other tissues, including beta cells, adipose and liver, is not yet determined.
MGAT is another enzyme that uses MAG as substrate to synthesize DAG (Shi and Cheng, 2009). This enzyme is mainly expressed in the intestine and responsible for uptake of MAG released from nutrient digestion. Mice deficient in MGAT2 are protected from diet induced
obesity and metabolic disorders with increased thermogenesis. Consistent with this result, intestine-specific deletion of MGAT2 in mice reproduces the effect of global deletion (Nelson et al., 2014). Surprisingly, expression of MGAT1 in the liver is very low, however, deletion of this enzyme specifically in liver produces strong beneficial effects in glucose homeostasis (Hall et al., 2014). However, in all these KO mice models, MAG levels inside the cells were not measured and thus we cannot attribute the beneficial effects to MAG accumulation.
1.2 Pathogenesis of type 2 diabetes
1.2.1 The various forms of type 2 diabetes
In simple terms, T2D can be defined as the pathological situation where the amount of secreted insulin is insufficient to match the increasing needs of tissues with high degree of insulin resistance, resulting in hyperglycemia, the hallmark of diabetes (Prentki and Nolan, 2006). However, T2D is a complex metabolic disorder with a multitude of mechanisms for its causes, including both genetic (Morris et al., 2012; Sladek et al., 2007) and environmental factors (Figure 3). Depending on body mass index (BMI) of the subjects with freshly diagnosed T2D, T2D can be classified into two major groups: lean T2D and obese T2D (Perry et al., 2012). Lean T2D is usually found in elderly and in poor and developing countries. The onset of this lean T2D in some individuals is due to insufficient adipocyte development because of poor nutrition during childhood. The typical mouse model of lean T2D is low-dose streptozotocin-induced diabetes with normal fasting insulinemia, whereas in type 1 diabetes there are very low to non-detectable levels of insulin in the plasma. Obese T2D is the major form and represent most of the cases of T2D. The causes of obese T2D are complex, but we should put some emphasis on the environmental factors, as genetic modifications cannot occur in a short time frame and the genetic factors alone do not explain the pandemic of obese T2D.
Figure 3 factor an arrows h T2D is density many c EXT2-A Sladek SLC308 far, thei to unra therapeu 3. The possibl nd genetic va highlight the f generally re array techno candidate lo ALX4 have et al., 200 8A, are excl ir precise rol avel the mec
utics. le causal facto ariation. So fa factors that ar egarded as a ology that al ci, such as been identif 7). Some o lusively exp le in the path chanisms im ors of T2D. T far, many fact
re currently th
a complex s llows simulta
ACDC, CA fied that sig of the ident
ressed in be hogenesis of mplicated an
T2D is a com tors have bee hought to be m yndrome of aneous geno APN10, ENP gnificantly a ified suscep eta cells. De f T2D is still nd this may mplex disease en shown to i most importan f polygenic n otyping of th PP1, HNF4 associate wit ptible genes espite the nu l unclear. Mu y eventually involving bo implicate in t nt. nature. With housands of p 4A, SLC308 thT2D (Mor s, such as z umerous gen uch effort is y lead to no oth environme this process. h the new h polymorphis 8A, IDE-KIF rris et al., 20 zinc transpo nes identified s currently m ovel targets ental Red high-sms, F11, 012; orter d so made for
T2D accounts for approximately 90 to 95 percent of all cases of diabetes and nearly 3 million Canadians suffered from T2D in 2010. Incidence of T2D is strongly associated with obesity, older age, family history of diabetes, previous history of gestational diabetes, physical inactivity and ethnicity (Stumvoll et al., 2005). There has been an alarming increase in childhood obesity associated with T2D (Lloyd et al., 2012). However, nationally representative data on prevalence of T2D in youth are not available.
The symptoms of T2D develop gradually with time. T2D is virtually considered as a chronic syndrome rather than an acute disease, such as anemia and hypothyroidism. Despite the lack of overt symptoms for T2D, unless the hyperglycemia is well controlled through pharmacological, nutritional or physical intervention, the function of several tissues and organs, such as kidney, nerves and eyes is gradually compromised (1998; Amos et al., 1997). Thus untreated or poorly-treated T2D can become a serious health and social problem as a result of secondary complications (Renard, 2009), greatly reducing the quality of life and even life span. With huge efforts made in elucidating the mechanisms of the onset and progression of T2D, some crucial factors, such as obesity-driven insulin resistance, adipose, liver and beta cell dysfunction, greatly contribute to the pathogenesis of T2D.
The global obesity epidemic significantly contributes to the rapid increase in T2D. Insulin resistance directly links obesity with T2D. However, obesity-induced insulin resistance is not the only cause for T2D and may even be protective for tissues such as the heart and skeletal muscle (Nolan et al., 2015). Hyperglycemia appears only when beta cells are unable to secrete sufficient insulin to compensate for the insulin resistance in peripheral tissues. Thus, obesity-induced insulin resistance and beta cell dysfunction are two major risk factors for the onset of T2D (Prentki and Nolan, 2006; Reaven, 1997). We will further discuss these two factors in more detail in the following chapters.
1.2.2 Obesity-induced insulin resistance
How does obesity cause insulin resistance? The question cannot be answered in a simple way. With huge efforts made in the past decades, major advance in our understanding of the relationship between obesity and insulin resistance has been greatly improved. Large number of metabolites and hormones, and inflammatory, neural and cell-intrinsic pathways are shown
to be affected by obesity. It is possible that some of these factors act either independently or synergistically to induce insulin resistance. Better understanding of the mechanism regarding obesity leading to insulin resistance may offer more efficient and powerful approaches to prevent or treat obesity-associated insulin resistance and its associated metabolic disorders. 1.2.2.1 Elevated free fatty acids in obesity and insulin resistance
FFA levels in the plasma of obese individuals are increased, and positively correlate to the degree of insulin resistance (Capurso and Capurso, 2012). Increased FFA is mainly generated from lipolysis in the adipocytes. In general, in the fasting state, insulin levels are decreased with elevated glucagon levels, and the increased glucagon will lead to the elevated activity of the lipase enzymes, in particular HSL, and lipolysis in the adipocytes. FFA generated in the lipolysis is taken up by other tissues, such as liver and muscle, where they go through fatty acid oxidation and provide energy. However, in obesity, the regulation of lipolysis enzymes in adipose tissues is disrupted, as insulin cannot suppress lipolysis, resulting in elevated lipolysis generated FFA in the plasma (Arner and Langin, 2014).
FFA may exert its effect on insulin signaling pathway mainly via intracellular metabolism in other tissues. Elevated FFA levels are associated with increased DAG, ceramide or acetyl-CoA. 1,2-DAG is a well-known second messenger, and through binding to C1-domain, it activates PKC, causing its translocation from cytoplasm to plasma membrane. Activated PKC phosphorylates insulin receptor and inhibits insulin signaling pathway (Yu et al., 2002). Deletion of PKCζ in liver protects the mice from obesity-induced insulin resistance, indicating DAG-PKC pathway contributes to FFA-induced insulin resistance in liver and muscle (Matsumoto et al., 2003; Perry et al., 2014; Samuel and Shulman, 2012). Besides DAG, ceramides also increase with prolonged FFA treatment, and their roles in insulin resistance are well-established (Holland et al., 2007). It has been shown that plasma ceramides are elevated in obese subjects with T2D and correlate with the severity of insulin resistance (Haus et al., 2009; Kanety et al., 1996). Inhibition of ceramide synthesis ameliorates glucocorticoid-, saturated fat- and obesity-induced insulin resistance via different mechanisms: first, ceramides possibly phosphorylate IRS-1 on inhibitory serine/ threonine residues through activation of extracellular signal-regulated kinase 2, JNK and P38 (Kanety et al., 1996); second, ceramides may directly block PI3K under unstimulated states; however, this observation is still under
debate (Hla and Kolesnick, 2014; Turpin et al., 2014); third, ceramides can directly inhibit Akt by activating protein phosphatase 2A or by activating PKCζ, which inhibits Akt translocation to the plasma membrane (Powell et al., 2004; Teruel et al., 2001).
1.2.2.2 Adipocytes secreted adipokines and insulin resistance
Adipose tissue participates in regulating energy homeostasis via secretion of adipokines, such as leptin and adiponectin (Rosen and Spiegelman, 2014). In response to excess energy intake, adipose tissue expansion, by the formation of new adipocytes or enlarging the existing adipocytes, is necessary to avoid the lipotoxic effects. With adipocyte remodeling, the adipokine secretion is also changed accordingly.
Among the adipokines, the functions of leptin and adiponectin are best understood (Meier and Gressner, 2004). Leptin is a hormone that directly regulates energy homeostasis by regulating energy intake and modulating energy expenditure, and its secretion is positively correlated to obesity (Moran and Phillip, 2003). The discovery of leptin was once regarded as a cure for obesity; however, leptin resistance in the brain makes it impossible to treat human obesity in the context of excess food intake (Caro et al., 1996). Adiponectin was identified in 1995 and 1996 by two different groups, and is specifically expressed in different adipose depots, such as visceral fat and brown fat (Matsuzawa, 2005). Further studies indicated that circulating adipinectin level is decreased with obesity, and restoring its levels curtails insulin resistance in different animal models (Yamauchi and Kadowaki, 2013). In line with this, mice deficient in adiponectin are glucose intolerant and show severe insulin resistance, associated with increased circulating FFA levels (Maeda et al., 2002). Various mechanisms are proposed to explain the beneficial effects of adiponectin in energy homeostasis. It has been demonstrated that adiponectin can increase FFA oxidation and reduce hepatic glucose output (Xu et al., 2003; Yamauchi et al., 2002), while in the muscle, it activates the energy sensor AMPK to increase glucose uptake and usage as well as fatty acid oxidation (Yoon et al., 2006).
1.2.2.3 Obesity-associated inflammation and insulin resistance
Chronic inflammation builds a crucial link between obesity and insulin resistance (Dandona et al., 2004). It is well accepted that the circulating inflammation markers, such as TNF alpha, IL-6 and C-reactive protein, are elevated in obese individuals, and these markers are predictive
of future development of T2D (Mugabo et al., 2010; Mugabo et al., 2011). Activation of inflammation pathway is directly associated with systemic insulin resistance in different tissues, such as liver (Gauthier et al., 2011). In white adipose tissue, obesity increased macrophage infiltration, which leads to local inflammation. Inhibition of macrophage infiltration in the adipose ameliorates obesity-induced insulin resistance (Apovian et al., 2008). With respect to the mechanisms related to inflammation and insulin resistance, several signaling proteins, such as JUN N-terminal kinase 1(JNK1) (Hirosumi et al., 2002), IKKβ (Arkan et al., 2005), and SOCS proteins (Ueki et al., 2005; Ueki et al., 2004) have been implicated in this process. Many inflammation markers, such as TNF activate JNK1 (Nguyen et al., 2005). In obese animal models, such as ob/ob mouse, or diet-induced obese mouse, JNK1 activity in different tissues positively correlates with inflammation markers and insulin resistance (Han et al., 2013). Suppression of JNK activity in liver improves obesity-induced insulin resistance and energy homeostasis, emphasizing the importance of this pathway in the liver (Seki et al., 2012). Further studies have shown that JNK-1 directly acts through insulin signaling pathway via serine phosphorylation of IRS-1 (Lee et al., 2003); IKKβ has been shown to be a mediator of TNFα-induced insulin resistance. Transgenic mice with constitutive expression of IKKβ in liver show activation of NFĸB, and systemic insulin resistance. In line with this, inhibition of IKKβ by high dose of aspirin (Yuan et al., 2001) (Yin et al., 1998) improves insulin resistance in obese individuals with T2D. Furthermore, IKKβ directly phosphorylates IRS-1 on serine residues (Zhang et al., 2008). Besides JNK1 and IKKβ, SOCS proteins (SOCS1, SOSC3 and SOCS6) have also been shown to be implicated in inflammation-induced insulin resistance. SOCS3 protein levels are increased with obesity. Inhibition of SOCS3 protein activity increases insulin sensitivity, while overexpression of SOCS1 and SOCS3 in liver decreases insulin sensitivity. Furthermore, SOCS proteins work through insulin signaling pathway by phosphorylation of IRS-1 on serine residues.
1.2.2.4 Neural mechanisms links to obesity-induced insulin resistance
The central nervous system (CNS) receives various signals from peripheral tissues, such as insulin from beta cells and leptin from adipocytes, and signals from local nutrient metabolism, such as oleate and ketone bodies, and integrates all this information, and sends signals to
control food intake and metabolism in peripheral tissues to balance energy intake, storage and expenditure.
The central role of leptin and insulin in the regulation of energy metabolism in peripheral tissues is well-accepted (Balthasar et al., 2004; Plum et al., 2006). Lipodystrophic and leptin-deficient mice show high degree of insulin resistance, and this can be reversed by central administration of leptin. Also, deletion of insulin receptors in the hypothalamus leads to insulin resistance and elevated glucose output in liver and impaired energy homeostasis. Multiple evidences show that the central effect of insulin and leptin depends on signal transducer and activator of transcription (STAT) 3 (Bates et al., 2003). It has been shown that STAT3 accounts for essential effects of leptin in energy homeostasis and deletion of STAT3 in mice mirrors the mice with deletion of leptin receptors (Takeda et al., 1997).
In addition to leptin and insulin, local brain FFA and its metabolism have also proven to be implicated in regulation of energy homeostasis. With obesity, increased circulating levels of FFA in the brain lead to hepatic insulin resistance, which is recaptured by central infusion of high amounts of oleate (Obici et al., 2002). Also, central administration of a carnitine palmitoyltransferase-1 (CPT-1) inhibitor, which reduces fatty acid oxidation, ameliorates liver insulin resistance (Kim et al., 2004). The beneficial effects of CPT1 inhibitor are partially mediated by activation of vagal efferent fibers connecting between the brain and liver.
Disturbed circadian rhythm is one of the risk factors in insulin resistance and T2D (Perciaccante et al., 2006). It is well-documented that the CLOCK transcription factor is one of the essential components of the circadian clock within hypothalamic neurons. Deletion of Clock in mice leads to a disturbed feeding behavior, and increased susceptibility to diet-induced obesity with hyperleptinemia, hyperlipidemia, hepatic steatosis, hyperglycemia, and hypoinsulinemia, indicating that circadian rhythm works via central mechanism to regulate energy homeostasis (Rudic et al., 2004).
1.2.3 Beta cell dysfunction and its underlying mechanisms
The main role of the beta cell is to secrete insulin in response to different signals in order to maintain glycemia in a narrow range. In the context of insulin resistance, beta cells need to secrete higher amounts of insulin to compensate increased needs of tissues. Hyperglycemia
arises o regarde cell dys differen dysfunc Figure 4 environm insulin r maintain hypergly 1.2.3.1 It is we chronic stimulat only when b d as a beta c sfunction, se nt mechanism ction. 4 Islet beta c mental factor resistance in p n euglycemia ycemia occurs Glucotoxici ell-accepted exposure of ted insulin s beta cells fa cell disease everal mecha ms may hel cell failure a rs contribute peripheral tiss a. Once the s. This figure ity that glucoto f these cells secretion an fail to comp (Figure 4) ( anisms have lp us find b and natural h to obesity, w sues forces th beta cells is adapted fr oxicity of be to high conc nd insulin ge pensate. From (Prentki et a e been propo better prom history of T2 which is ass he beta cells t fail to com om J Clin In eta cells is centrations o ene expressi m this pers al., 2013b). R osed, and be mising appro 2D. Over-nut sociated with to proliferate mpensate the nvest. 2006 J defined as d of glucose, re ion as well spective, dia Regarding th etter underst oaches to pr trition, inacti h insulin resis and to secret increased n Jul;116(7):1 dysfunction esulting in im as apoptosi abetes could he cause of b tanding of th revent beta
ivity and var stance. Incre te more insuli need for insu
802-12. induced by mpaired gluc is under cer d be beta hese cell rious ased in to ulin, y the cose rtain
conditions (Harmon et al., 1999). After chronic high glucose exposure, several commonly used beta cell lines, such as HIT-T15 and INS-1 as well as rodent and human islets show reduced glucose-stimulated insulin secretion (GSIS) and also reduced insulin content (Boyd and Moss, 1993; Olson et al., 1993). In line with this, insulin promoter activity and pancreas-duodenum homobox-1 (PDX-1) and MafA binding activity to the insulin promoter are also decreased (Sharma et al., 1995; Ye et al., 2006). Similar results have been obtained in rat islets cultured ex vivo for up to six weeks (Jacqueminet et al., 2000).
The proposed mechanism with regard to glucotoxicity is closely related to the remodeling of glucose metabolism in the beta cell (Robertson et al., 2003). Instead of glucose being metabolized via glycolysis and Krebs’ cycle, additional pathways are activated that include glyceraldehyde autoxidation, lipogenesis with DAG formation and PKC activation, sorbitol metabolism leading to the accumulation of reactive oxygen species (ROS) (Poitout and Robertson, 2002). Due to poor defense mechanisms against ROS available in the beta cells (low levels of superoxide dismutases and virtually no expression of catalase or glutathione peroxidase), ROS produced from altered glucose metabolism pathways eventually leads to beta cell dysfunction. In support of this hypothesis, beta cells with overexpression of glutathione peroxidase preserve intra-nuclear MafA binding activity and beta cell function, and thus slow down the progression of diabetes in db/db mice (Harmon et al., 2009).
Due to the role of increased oxidative stress in causing glucotoxicity, some antioxidants may be beneficial in protecting beta cell from this insult. This hypothesis has been supported in studies using the anti-oxidants N-acetylcysteine and aminoguanidine. In the Zucker Diabetic Fatty (ZDF) rats, treatment with these antioxidants has been shown to decrease markers of oxidative stress and improve glucose tolerance (Briaud et al., 1999). In db/db mice, treatment with N-acetylcysteine enhanced insulin secretion, ameliorated glycemia, reduced apoptosis and increased beta cell mass (Kaneto et al., 1999).
1.2.3.2 Lipotoxicity
The concept of lipotoxicity is derived from the phenomenon that T2D is commonly associated with elevated levels of TG and FFA in the plasma. Similar to glucotoxicity, lipotoxocity refers to chronically elevated levels of FFA eventually causing beta cell dysfunction (Gremlich et al.,
1997). Different fatty acid species have distinct effects in inducing beta cell apoptosis. Saturated fatty acids, such as palmitate and stearate have strong effect in inducing cell apoptosis. By contrast, monounsaturated fatty acids, such as oleate and palmitoleate, have been shown to protect beta-cells from apoptosis (Cnop et al., 2001) (El-Assaad et al., 2003). Of special interest, mixture of equimolar saturated and monounsaturated fatty acid is also not toxic to cells. And this protective effect may be due to the strong ability of unsaturated fatty acid in inducing TG synthesis. But this conclusion has been under debate, as other results indicate the protective effect lies in the fatty acid structure rather than the metabolism of FFA (Diakogiannaki et al., 2008). Even though the concept of lipotoxicity has been proposed for many years, it is still short of strong experimental support. We and others reported that FFA can induce beta cell dysfunction only in combination with elevated levels of glucose. In the presence of low glucose, high FFA (at reasonable concentrations) does not change both in vitro and in vivo the total insulin content of the ß-cell and only slightly affects GSIS. So from this standpoint, the concept of glucolipotoxicity (Prentki et al., 1998), combined chronic effect of both high glucose and FFA, is more appropriate to explain the toxic effect of FFA in beta cells and therefore gained more focus in recent research.
1.2.3.3 Glucolipotoxicity
Glucolipotoxicity is a combination of glucotoxicity and lipotoxicity, but importantly incorporates the concept of synergy of the toxicity of these fuels when present in excess simultaneously. This concept has been initially advanced by our lab together with Dr B Corkey and has been widely accepted. Glucolipotoxicity indicates the synergistic chronic effect of glucose and fatty acid in inducing beta cell dysfunction, and therefore glucolipotoxicity shows some similar features as glucotoxicity, such as decreased glucose-stimulated insulin secretion and decreased total insulin content of beta cells. Glucolipotoxicity also induces beta cell dysfunction in a unique fashion. When INS832/13 cells, derived from rat beta cells, are incubated in different conditions with high glucose (20mM glucose, no FFA), or high FFA (0.4mM palmitate, 5mM glucose), or high glucose (20mM) plus high FFA (0.4mM), high FFA alone has no effect in comparison to high glucose, indicating that high FFA per se have no significant toxic effect. Of special importance, the combination of high glucose and high FFA showed highest apoptosis, compared to the group with low glucose (El-Assaad et al.,
2003; El-Assaad et al., 2010). Further study indicated that this strong apoptosis inducing effect was closely related to lipid esterification processes, TG accumulation and ceramide deposition as well as activation of caspase-3 pathway in the cells (El-Assaad et al., 2010). Similar results were also reported in dispersed rat and human islets (Buteau et al., 2004). Some in vivo results also favor the concept of glucolipotoxicity. A 72 h infusion of glucose and intravenous fat emulsion in 6- month-old rats leads to insulin resistance and reduced insulin secretion in vivo. This was associated with diminished glucose-stimulated second-phase insulin secretion and proinsulin biosynthesis and lower insulin content as well as reduced expression of typical beta cell genes in isolated islets (Fontes et al., 2010). The mechanisms related to glucolipotoxicity are associated with glucose and FFA metabolism. As proposed by our lab, glucose is the main determinant of fatty acid partitioning inside the beta cells. When glucose concentration is in the low to normal range, fatty acids are transported into mitochondria through CPT-1, for beta oxidation without causing any toxic effect. When glucose and fatty acids are both elevated, glucose is converted to citrate through TCA cycle and then leads to the synthesis of malonyl-CoA, which inhibits CPT-1 activity. Inhibition of fatty acid oxidation, at the CPT-1 step causes fatty acid partitioning from beta oxidation to esterification (Prentki et al., 2002). High glucose also leads to enhanced lipolysis (Hu et al., 2005), and if the rates of esterification and lipolysis are the same, there is little toxic effect even in the presence of high glucose and high fatty acid. But if these rates of esterification and lipolysis are not balanced, many lipid derivatives may accumulate and induce beta cell dysfunction (Poitout et al., 2010; Prentki and Madiraju, 2012).
1.2.3.4 ER STRESS
The main function of pancreatic beta cell is insulin synthesis and secretion according to the body’s demand. Beta cell needs to produce huge amounts of insulin in face of hyperglycemia. This large amount underscores the special “insulin factory” characteristic of beta cells with a highly developed ER, which is the major site responsible for posttranslational modification, folding and assembly of newly synthesized secretory proteins, and a cellular calcium store. ER is also an organelle that controls cell survival. A myriad of pathological and physiological factors, such as impaired protein transport from the ER to the Golgi, and calcium depletion from the ER lumen, can compromise the function of the ER, termed as ER stress (Laybutt et
al., 2007). Beta cells have to employ certain cytoprotective mechanisms to mitigate ER stress, referred to as the unfolded protein response (UPR), also named as ER stress signaling, which is elicited by ER stress (Eizirik and Cnop, 2010). The UPR can reduce ER stress and maintain ER function to produce and process proper amounts of proteins. In the event that the UPR cannot maintain ER homeostasis, cells activate at least three apoptosis pathways to induce cell apoptosis (Janikiewicz et al., 2015): the transcriptional induction of the genes for CHOP (C/EBP homologous protein)/ GADD153 pathway, the c-JUN NH2-terminal kinase (JNK) pathway and the ER-localized cysteine protease caspase-12 pathway. Multiple studies have implicated ER stress in beta cell apoptosis and this may be responsible for the reduction of beta cell mass in individuals with T2D.
Three ER membrane-associated proteins, inositol requiring protein 1 (IRE1), PKR-like kinase (PERK), and activating transcription factor 6 (ATF6), have been identified as master regulators in ER stress signaling and shown to regulate glucose homeostasis. Pancreatic beta cells deficient in PERK are more susceptible to ER stress-induced apoptosis. And PERK-deficient mice develop severe hyperglycemia soon after birth due to defects in islet proliferation and increased apoptosis. However, our understanding of the UPR in beta-cells is incomplete. The complexity of UPR pathways as well as its master regulators has not been completely investigated. We need to identify the cross talk between UPR pathway and other signaling pathways, such as mTOR, which have been shown to decrease ER stress, and also to focus on identifying endogenous molecules and chemical compounds that could modulate ER stress and protecting beta cells from metabolic stress-induced apoptosis.
1.2.3.5 Inflammation
In response to inflammation resulting from injuries or infection, the immune system plays a key role in restoring the normal function. Excess energy intake also leads to inflammation in different tissues, including pancreatic islets. Generally speaking, inflammation induced by circulating cytokines, such as interleukin-1β (IL-1β), tissue necrosis factor 1α and interferon-γ, plays a major role in inducing beta cell apoptosis seen in type 1 diabetes, and now it is also observed in T2D (Donath, 2013). In response to chronic high glucose exposure, human islets will secrete high amount of IL-1β, and in combination high glucose and IL-1β synergize in causing beta cell dysfunction (Boni-Schnetzler et al., 2008; Fei et al., 2008). The synergistic