A Reliable and Robust Algorithm to Identify Episodes of
Hospitalizations Using RAMQ Medical Services Claims:
Methodology Issues & Data Validation
par
Amir Abbas Tahami Monfared
Programme de Sciences Biomédicales
Faculté de Médecine
Thèse présentée à la Faculté des études supérieures
en vue de l’obtention du grade de Docteur de Philosophie (Ph.D.) en Sciences Biomédicales
avril 2004
w
U58
Q
ocY-f
I I ‘JG
o
Université
Eh
de Montré al
Direction des bibliothèques
AVIS
L’auteur a autorisé l’Université de Montréal à reproduire et diffuser, en totalité ou en partie, par quelque moyen que ce soit et sur quelque support que ce soit, et exclusivement à des fins non lucratives d’enseignement et de recherche, des copies de ce mémoire ou de cette thèse.
L’auteur et les coauteurs le cas échéant conservent la propriété du droit d’auteur et des droits moraux qui protègent ce document. Ni la thèse ou le mémoire, ni des extraits substantiels de ce document, ne doivent être imprimés ou autrement reproduits sans l’autorisation de l’auteur.
Afin de se conformer à la Loi canadienne sur la protection des renseignements personnels, quelques formulaires secondaires, coordonnées ou signatures intégrées au texte ont pu être enlevés de ce document. Bien que cela ait pu affecter la pagination, il n’y a aucun contenu manquant. NOTICE
The author of this thesis or dissertation has granted a nonexclusive license allowing Université de Montréal to reproduce and publish the document, in part or in whole, and in any format, solely for noncommercial educational and research purposes.
The author and co-authors if applicable retain copyright ownership and moral rights in this document. Neither the whole thesis or dissertation, nor substantial extracts from it, may be printed or otherwise reproduced without the author’s permission.
In compliance with the Canadian Privacy Act some supporting forms, contact information or signatures may have been removed from the document. While this may affect the document page count, it does not represent any loss of content from the document.
Faculté des études supérieures
Cette thèse intitulée:
A Reliabie and Robust Algorithm to Identify Episodes of Hospitalizations Using RAMQ Medical Services Claims: Methodology Issues & Data Validation
Présentée par:
Amir Abbas Tahami Monfared
a été évaluée par un jury composé des personnes suivantes:
Dr Gilies Bleau Président-rapporteur
Dr Jacques LeLorier Directeur de recherche
Dr Lucie Biais Membre du jury
Dr Elham Rahme Examinatrice externe
Dr André-Pierre Contandriopoulos Représentant du doyen de la FES
Abstract
Introduction:
The management of health care system nowadays places major emphasis on reducing cost and resource utilization. On average, the most important characteristics contributing to the total cost in a health care system are inhospital length of stay (LOS) and number ofhospitalizations.
MED-ECHO, which is the hospital discharge summary database in the province of Quebec, contains relevant information regarding hospitalizations, duration, and their related diagnoses (including primary and up to 15 secondary diagnoses). While estimates of inhospital episodes relying extensively on ffiis database would provide more accurate information, the associated time (about 1 year) for accessing this information currently appears prohibitive in many studies; permission for maldng a linkage to these data must be granted by the Commission d’accès à l’information (CAl), a procedure that can take several months. Thus, there would be enormous value in finding reliable ways to estimate episodes of hospitalizations in a routine and affordable manner.
Claims data maintained by the Régie de l’assurance Maladie du Québec (RAMQ) have been used in various studies in relatively large populations at limited cost and reasonable time. Most concems about the validity of research findings, in those cases, were related to the accuracy of diagnostic coding and systematic bias. Although pharmaceutical services information contained in the RAMQ has been subject for validation, the completeness and accuracy of the RAMQ medical services information, particularly conceming inpatient daims remains uncertain. This requires further endeavor since the data conceming hospitalizations are not specifically contained in these data files.
Objective:
Time-efficiency in usmg the RAMQ medical daims data provided the key motivation for this dissertation, which explored the capacity and reliability of daims data, a less costly and albeit less informative data source, to estimate inhospitai LOS and number of hospitalizations (including readmissions) as proxies for hospital morbidity.
The objectives of this study were (1) to develop and validate a reliabie and robust algoritbm to identify episodes of hospitalizations using the RAMQ physician daims database (training dataset); (2) to examine whether the capacity of the RÀMQ clalins data for estimating the above-mentioned proxies is being fuliy recognized; and (3) to assess ifie applicability and generalizabiiity of the developed algorithm in other clinical conditions, nameiy acute myocardial infarction and gastrointestinai hemorrhage, using an external validation dataset provided by the RÀMQ (validation dataset). Ail these would increase the potential for acquiring quaiity information regarding hospitalizations in the RAMQ medical daims database.
Methodology:
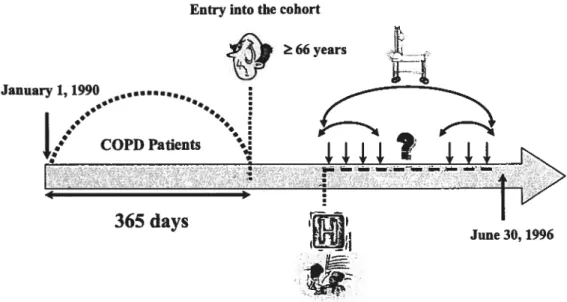
While the identification of inhospital codes provides essential information to establish the fact that a patient was certainly admitted to the hospital, we additionally needed an analytical algorithm to identify episodes of hospitalizations. Since it is very likely that a patient does flot receive any medical services for a certain period while being hospitalized, to conectly estimate the episodes of care we assumed that there was a service interruption (gap) within services provided. Accordingly, several aigorithms were built based on a predefined gap between 1 to 15 days. Development of the analyticai algorithm to identify inhospital information with the best possible accuracy required an additional linkage to the MED-ECHO database.
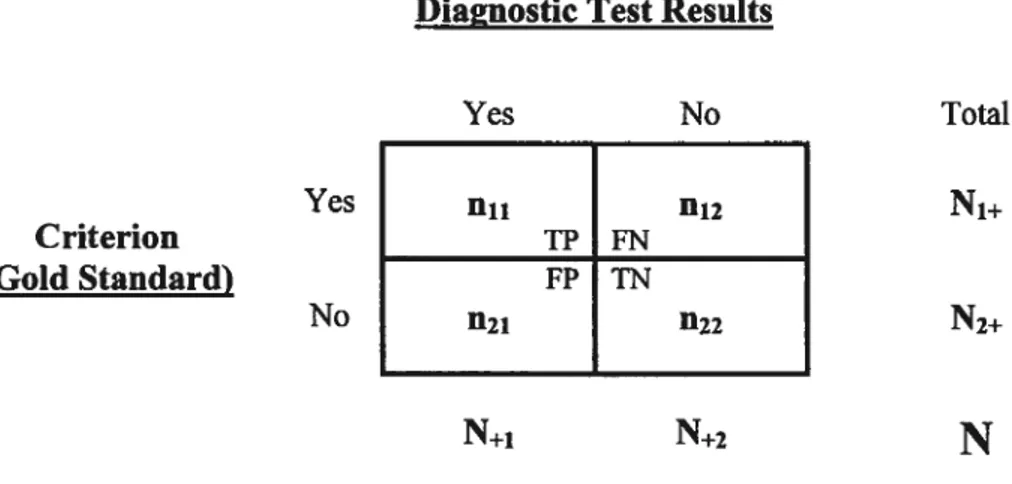
The accuracy of the RAMQ medical daims data conceming inpatient services was assessed using the concepts of diagnostic test evaluation, which was implemented through comparison analyses with a “gotd standard”, MED-ECHO database. The strengths and limitations of the RAMQ daims data were examined using separate analyses. First, episodes of hospitalizations in a training dataset (a cohort of COPD-diagnosed patients) were analyzed using the developed algorithm. A separate analysis compared agreement between inhospital episodes derived from daims data and the gold standard using an automated deterministic linkage algorithm. This demonstrated whether daims data could be used to identify inhospital morbidity indices. The accuracy of the parameter estimates using daims data were then assessed by comparing the central tendency of the parameters to those observed in the gold standard. The generalizability of the developed algorithm for other clinical conditions (i.e., acute myocardial infarction and upper gastrointestinal bleeding) was assessed in a validation dataset provided by the RAMQ using the concept of external validity.
Resuits:
Compared with the observed durations and number of hospitalizations in MED-ECHO, the analytical algorithm with the gap of 7 days best defined the episodes of hospitalizations in the RAMQ daims database. This selection was based on the resuits of the statistical and predictive performance analyses. It was shown that the RAMQ daims data lias the capacity for being used as an accurate and reliable source of data for identifying hospitalization episodes. Applying the developed algorithm to an extemal source of data (provided by the RAMQ) resulted in the close estimates for hospitalization episodes in two other clinical conditions (AMI and UGIB), when compared to those obtained from the MED-ECHO database. The resuits of the latter analysis simply confirmed the generalizability of the developed algoritbm.
Discussion:
The present study demonstrated that the RÀMQ daims database could be used to accurately measure the LOS and number of hospitalizations for different diseases; it provided reasonable diagnostic agreement with the data collected in the hospital discharge summaiy database. When estimates of hospitalization episodes from the RAMQ daims data were compared to those obtained from MED-ECHO, ifie average inhospital lengths of stay were slightly underestimated in the daims based estimates, whereas the average number of hospitalizations were quite similar. This finding was in total agreement with the assumption that daims data are consistently underestimate the degree of inhospital morbidities and performance indicators. Furthennore, consistent with prior studies, the fmdings confirmed that identification of patients with more complicated clinical conditions using lCD-9 codes can be difficult and fraught with unknown effects. Proper design and inclusion criteria should be adapted for patients’ selection.
Conclusion:
Results of the analyses established the RAMQ daims database as being an excellent source of information for the study of health care resource utilization, particularly hospitalization episodes. The developed algorithm is a valuable tool for identification of inhospital episodes in the RAMQ daims database. It can easily be integrated in epidemiologic and outcomes research studies. The use of the RAMQ daims database lends itself readily to analyses, providing extremely large data sets at a veiy hile cost. Substantial time and cost savings can be made if information is gathered from the RAMQ.
Keywords: Administrative database; physician daims; data quality; analytical algorithm; validation; reliability; hospitalization; length of stay.
Résumé
Introduction:
De nos jours, la gestion du système de santé met un accent majeur sur la réduction significative des coûts et de l’utilisation des ressources. Par conséquent, pour réduire les coûts, on doit identifier les diverses caractéristiques qui pourraient influencer l’utilisation des ressources. En moyenne, les facteurs les plus importants contribuant aux coûts dans le système de santé sont la durée du séjour (DS) et le nombre d’hospitalisations. Ils sont fréquemment employés comme déterminants de la performance des hôpitaux, de la complexité des cas, de la sévérité de la maladie, de la qualité des soins et des coûts d’utilisation en santé. En outre, examiner les tendances de l’hospitalisation est une priorité importante afin de trouver des moyens appropriés pour l’usage efficace des ressources.
Les données de MED-ECHO (les données récapitulatives de congé d’hôpital) contiennent tous les renseignements pertinents à l’hospitalisation, notamment sa durée, ainsi que le diagnostic primaire et les diagnostics secondaires pour la province de Québec. Alors que les évaluations des épisodes d’hospitalisation se fondant intensivement sur ces données fourniraient des informations plus précises, le temps d’accès à ces informations semble actuellement prohibitif dans la plupart des études; elles sont toujours fournies lorsque la permission est accordée (il est nécessaire d’obtenir la permission de la Commission d’accès à l’information (CAl) pour faire le lien avec une autre source). Ainsi, il y aurait un grand avantage à trouver des moyens fiables d’estimer les épisodes d’hospitalisation de façon courante et accessible.
Les données de réclamations médicales maintenues par le Régie de l’assurance maladie du Québec (RAMQ) ont été employées dans diverses études portant sur des populations relativement grandes, à un coût limité et dans un temps raisonnable. La
plupart des études peuvent être réalisées en croisant les fichiers de base de données de services pharmaceutiques et de services médicaux. Le plus grand souci concernant la validité des résultats de recherche, dans ce cas, s’est concentré sur des questions liées à l’exactitude du codage diagnostique et des erreurs systématiques (biais). Bien que l’information sur les services pharmaceutiques contenue dans les fichiers de la RAMQ ait été soumise à une validation, l’exactitude de l’information sur les services médicaux de la RÀMQ, en particulier au sujet des réclamations des personnes hospitalisées, reste incertaine. Ceci exige davantage d’efforts puisque les données se rapportant aux hospitalisations ne sont pas spécifiquement contenues dans ces fichiers de données.
Objectifs:
Le rapport temps-efficacité produit en utilisant les données de la RAMQ pour estimer la DS et les nombres d’hospitalisations (y compris les réadmissions), comme déterminants de la morbidité hospitalière, a fourni la motivation principale à cette thèse qui a exploré la capacité et la fiabilité des données de réclamations, moins coûteuses mais par contre moins instructives.
Les buts de cette étude étaient les suivants: (1) développer et valider un algorithme fiable et robuste pour identifier les épisodes d’hospitalisation en utilisant une base de données des services médicaux de la RÀMQ (base de données de formation); (2) examiner si la capacité des données de réclamation de la RAMQ pour estimer les déterminants, mentionnés ci-dessus, est entièrement identifiée; (3) évaluer l’applicabilité de l’algorithme développé pour d’autres conditions cliniques, spécifiquement l’infarctus aigu du myocarde et l’hémorragie gastro-intestinale, en utilisant un ensemble de données de validation externes fourni par le RÀMQ (bases de données de validation). L’atteinte de ces buts permettrait d’accroître la qualité de l’information concernant l’estimation des hospitalisations basées sur les données de la RAMQ.
Méthodologie:
Bien que l’identification des codes d’établissements fournit des informations essentielles pour établir le fait que le patient a certainement été admis à l’hôpital, nous avons également eu besoin d’un algorithme analytique pour estimer les épisodes d’hospitalisation. Le développement d’un algorithme analytique pour identifier l’information d’hospitalisation avec la meilleure précision a exigé de faire un croisement additionnel avec la base de données de congé d’hôpital de MED-ECHO. Puisqu’il est très probable qu’un patient n’ait aucun service médical inscrit à la RAMQ pendant une certaine période tout en étant hospitalisé, nous avons supposé qu’il y avait une interruption de service (intervalle) parmi les services fournis afin d’estimer correctement les épisodes de soin. Par conséquent, plusieurs algorithmes ont été basés sur un espace prédéfmi (intervalle) entre 1 et 15 jours.
L’exactitude des données de réclamations médicales de la RÀMQ au sujet des
services aux patients hospitalisés a été mesurée en utilisant les concepts de l’évaluation et la validation de tests diagnostiques à l’aide d’analyses de comparaison
avec une base de données «gold standard» de MED-ECHO. Les forces et les lacunes des données de réclamations de la RAMQ ont été examinées en utilisant des analyses distinctes. Pour commencer, des épisodes d’hospitalisation dans une base de données de formation (une cohorte de patients atteints de maladie pulmonaire obstructive chronique (MPOC)) ont été analysés en utilisant l’algorithme développé. Ensuite, une nouvelle analyse a comparé l’accord entre les épisodes d’hospitalisation dérivés des données de réclamations (RAMQ) et le « gold standard» (MED-ECHO) à l’aide d’un algorithme automatisé à liaison déterministe. Ceci a démontré que des données de réclamations pourraient être employées pour identifier des index de morbidité hospitalière. L’exactitude des paramètres d’évaluation employant des données de réclamations a par la suite été évaluée en comparant la tendance centrale des paramètres à celle observée dans le « gold standard ». L’applicabilité de l’algorithme
hémorragie gastro-intestinale) a été évaluée, en utilisant le concept de validité externe, dans un ensemble de données de validation fourni par le RAMQ.
Résultats
Comparativement aux durées et aux nombres d’hospitalisations observés dans MED-ECHO, l’algorithme analytique avec un intervalle de 7 jours est celui qui a le mieux défmi les épisodes d’hospitalisation dans la base de données de réclamations de la RAMQ. Le choix de 7 jours a été basé sur les résultats des analyses de performances statistiques et prédictives. Il a été démontré que les données de réclamation de la RAMQ peuvent être utilisées comme source précise et fiable de données pour identifier les épisodes d’hospitalisation. L’application de l’algorithme analytique avec une nouvelle source externe de données (fournie par la RAMQ) a résulté, en faisant la comparaison avec MED-ECHO, à des estimations similaires quant aux épisodes d’hospitalisations pour deux conditions cliniques étudiées (infarctus aigu du myocarde et hémorragie gastro-intestinale). Les résultats de cette dernière analyse ont simplement confu-mé la généralisabilité de l’algorithme développé.
Discussion:
La présente étude a démontré que la base de données de services médicaux de la RAMQ peut efficacement être employée pour mesurer la D$ et les nombres d’hospitalisations pour différentes maladies; ces données sont raisonnablement en accord avec les données recueillies dans la base de données sommaires des congés d’hôpital (MED-ECHO). Lorsque les évaluations des épisodes d’hospitalisation des données de réclamation de la RAMQ ont été comparées à celles obtenues de MED ECHO, les durées moyennes de séjour ont été légèrement sous-estimées dans les évaluations basées sur la RÀMQ alors que le nombre moyen d’hospitalisations était
tout à fait semblable. Ces résultats sont totalement en accord avec la prétention que les données de réclamations sous-estiment régulièrement le degré de morbidité hospitalière et les index de performance. De plus, en accord avec les études antérieures, les résultats ont confirmé que l’identification des patients dans des conditions cliniques plus compliquées, en employant les codes lCD-9, peut être difficile et comporter des conséquences inconnues. Des critères de conception et d’inclusion appropriés devraient être adaptés pour la sélection des patients.
Conclusion
Les résultats des analyses ont établi que la base de données de réclamations de la RAMQ est une excellente source d’information pour l’étude de l’utilisation des ressources en santé, en particulier pour les épisodes d’hospitalisation. L’algorithme développé est un outil valable pour l’identification des épisodes d’hospitalisation dans la base de données de réclamations de la RÀMQ. Il peut facilement être intégré dans des études épidémiologiques et économiques. L’utilisation de la base de données de la RAMQ se prête aisément aux analyses, fournissant des données vastes à un coût raisonnable. Des économies de temps et de coûts substantiels peuvent être ainsi faites par rapport à l’utilisation de la banque de données MED-ECHO.
Mots clés: Base de données administratives; réclamations médicales; qualité des données; algorithme analytique; validation; fiabilité; hospitalisation; durée du séjour.
Achnowiedgement
The completion of this thesis would have flot been possible without the generous contribution, support, and guidance of many individuals to whom I would like to extend my gratitude and appreciation. First and foremost, I would like to express my deepest gratitude to my supervisor, Dr. Jacques LeLorier, whose enonnous clinical experience, scientific enthusiasm, and continuous support and encouragement have been invaluable. I truly appreciate his positive and insightfui guidance, inspiring leadership, “open door” poiicy, as weii as his vast knowledge in the field of clinical phannacology. I am aiso thankful for lis high standards, communication skiils, and patience. They are trademarks that I constantly strive to attain for myself.
I would aiso like to acknowledge the contribution of my committee members for their generosity, time, and energy. These people generousiy undertook to read the manuscript entireiy and to give me the benefit of their expert criticisms and suggestions. Each of ifiem deserves major credit for the quality of the content of this dissertation, without bearing any responsibility for the shortcomings it contains.
A great appreciation is aiso due to Dr. Lucie Biais (University of Montreal, Faculty of Pharmacy) and Dr. Eiham Rahme (McGili University, McGiii University Health Center) who flot oniy provided the data for this study but also accommodated insights throughout my research. For their availabiiity, guidance, and insightful comments I am most grateful.
Speciai thanks are aiso due to Marc Dorais, my friend and colieague, who provided me a priceiess tutorial in SAS (Statistical Anaiysis Software) programming language. The expertise he provided and his willingness to teach were integral to tins
study. I sincerely appreciate ail the time and effort ftom him. His everlasting enthusiasm for statistics has been a continuous motivation for me!
I would aiso like to thank my friends and colleagues, Deiphine Gueylard Chenevier, Caroline Quach, Héloïse Cardinal, and Hani Tamim for stimulating discussion and pleasant atmosphere that have been of great value to me while struggiing with this study. Caroline and Hani were also good enough to read segments of early versions of the manuscript. They gave me the running start I needed in order to transform rough drafts into a finished materiai.
The foilowing people aiso made significant contributions to my work and warrant my deepest appreciation: Mrs. Anita Massicotte for her outstanding organizational and interpersonal skiils, patience, and secretarial assistance; Odile Sheehy, Frédéric Lavoie, and Ciaudie Charbonneau for stimulating discussions, support, and pleasant work environment, particularly during our group meetings.
Ail these individuals from a wide variety of disciplines have constantiy provided invaluable assistance combined with criticisms, creative suggestions, mentoring, and encouragement during my matriculation. My gratitude to them is boundiess. To each ofyou, “Thank you”.
I cannot begin to express my gratitude to my famiiy and spouse for their continued support and encouragement in my academic and professional choices. I hereby wish to express my heartfelt thanks to my parents; they have followed my academic career and have always been encouraging, offering unconditionai love and support. Last but flot ieast, my deepest and most loving thanks are due to my wife, Sanaz, for her encouragement and inspiration throughout the entire course of my studies, everlasting support, and unconditional love. Certainly, this dissertation could not have been compieted without her.
To myparents,
who made me who lam
Contents
Abstract j Résumé y Acknowledgement x Contents xiii List of Tables xxList of Figures xxi
Symbols & Abbreviations xxiii
CHPTER 1: Introduction 1
CHAPTER 2: Review of Literature 9
2.1 CHRONIC OBSTRUCTWE PuLM0NARY DIsEAsE 9
2.1.1 Definition 9 2.1.2EtioÏogy 11 2.1.3 Epidemiology 13 2.1.3.1 Prevalence 13 2.1.3.2 Mortality 13 2.1.3.3 Morbidity 13
2.1.4 Burden of Chronic Obstructive FuÏmonaiy Disease 14
2.2CUMCALINDICATORS IN OUTCOMESRESEARCH 18
2.2.1 Introduction 18
2.2.2 Background 20
2.2.2.2 Process or outcome indicators .21
2.2.2.2.1 Outcomes ofcare 22
2.2.2.2.2 Process ofcare 23
2.2.2.3 Domains of quality 24
2.2.2.4 Rate-based or sentinel event indicator 24
2.2.3 Common Themes 25
2.2.3.1 Evidence-based process measures 25
2.2.3.2 Generic outcome measures 26
2.2.3.2.1 Mortality 26
Cimical significance 29
2.2.3.2.2 Inhospital Length of Stay (LOS) 30
Clinical significance 33
2.2.3.2.3 Readmission to hospital 34
Clinical significance 37
2.3 DATA COLLECTION ANDSAMPUNG 39
2.3.1 Administrative Databases 40
2.3.2 Canadian Administrative databases 45
2.3.3 Accuracy and Sources 46
2.3.4 Substantive Databases 49
2.3.4.1 Populations andEvents 49
2.3.4.2 Hospital Discharge Data 50
2.3.4.3 Pharmaceutical Data 56
2.3.4.4 Physician Claims 5$
2.3.4.5 Extemal Criteria 60
2.3.4.6 Sensitivity Testing 61
2.3.4.7 Summaryof Databases by Province 62
2.4 ACCuRACY AssEssMENT0fADMINISTRATIVE DATABASES 63
2.4.1 Electronic Database Comparison Method 64
2.4.2 ChartAuditliethod 66
2.4.2.2 Diagnostic Data .68
2.4.2.3 Procedural Data 70
2.4.3 Expert Clinicat Criteria Method 70
2.5ANoMALIEs IN ADMTMSTRATWE DATABAsEs 73
2.5.1 Error 74 2.5.1.1 Acquisition Errors 74 2.5.1.1.1 Data Entiy 74 2.5.1.1.2 Invalid Value 75 2.5.1.1.3 Misrepresentation 76 2.5.1.1.4 Consistency 76 2.5.1.2 Transformation Errors 77 2.5.1.2.1 Transformation Algorithms 77 2.5.1.3 Analysis Errors 78 2.5.1.3.1 Wrong Assumptions 78 2.5.2 Missing Data 78
2.5.2.1 Acquisition Missing Data 78
2.5.2.1.1 Not Applicable 79 2.5.2.1.2 Unknown 79 2.5.2.1.3 NotMeasured 79 2.5.2.1.4 Not Noteworthy 79 2.5.2.1.5 NotNecessaiy 79 2.5.2.1.6 Not Recorded 80 2.5.2.1.7 Mis-recorded $0 2.5.2.1.8 Lost Data $0 2.5.2.1.9 Normal Values $1
2.5.2.2 Transformation: Missing Data 81
2.5.2.2.1 Exclusion of Rows and/or Records $1
2.5.2.2.2 Exclusion ofFields $1
2.5.2.2.3 Exclusion of Values $2
2.5.2.3 Analysis of Missing Data $2
2.5.2.3.2 Eliminating Fields .83 2.5.2.3.3 Eliminating Values 83 2.5.3 Variation 84 2.5.3.1 Acquisition Variation 84 2.5.3.1.1 Structural $5 2.5.3.1.2 Definition $6 2.5.3.1.3 Method / Measurement 86 2.5.3.1.4 Constraints/Rules 86 2.5.3.1.5 Temporal/Historical $7
2.5.3.1.6 Record Keeping Practices $7
2.5.3.1.7 Purpose 82
2.5.3.2 TransformationVariation 88
2.5.3.2.1 HowData AreTransformed 8$
2.5.3.3 Analysis Variation 89
2.5.3.3.1 How Data Are Used 89
2.5.3.3.2 Assumptions $9
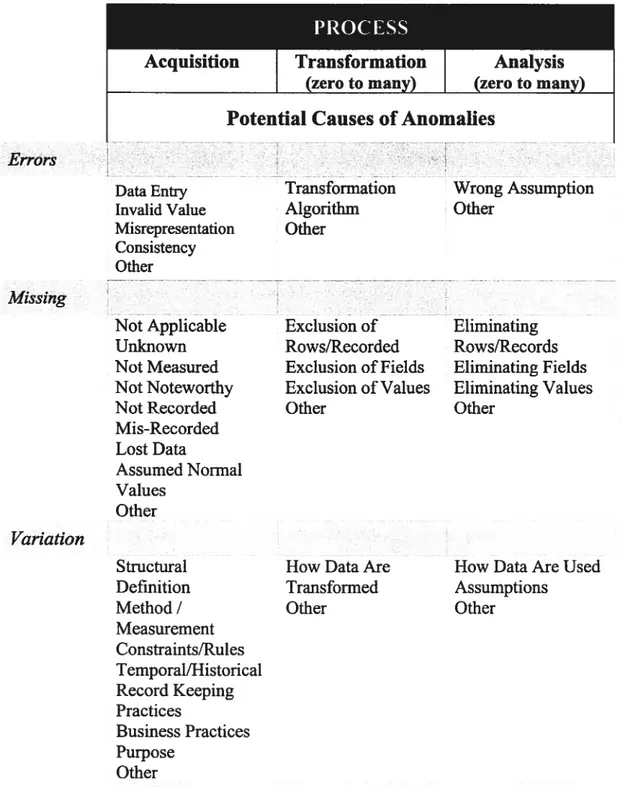
PROCESS 90
Acquisition 90
Transformation (zero to many) 90
Analysis 90
(zero to many) 90
Potential Causes of Anomalies 90
Errors 90
Missing 90
2.5.4 Assessing a Condition in Administrative Databases Using a Gold Standard Test. 91
CIIAPTER 3: Objective & Hypothesis 94
3.1 PR0BLEM 94
3.2 HYP0THEsIsANDOBJECTIVE 95
CHAPTER 4: Methodology 98
4.2 DATA SOURCES .101
4.2.1 MED-ECHO 102
4.2.2RAMQ 104
4.2.2.1 Medicare Registrant Database (Enroliment) 106 4.2.2.2 Physician Claims Database 107 4.2.2.3 Physician Demographic Database 109 4.2.2.4 Prescription Claims Database 109
4.3 DEFiNITI0N5 111
4.3.1 Available Information on Claims Data 111
4.3.2 Accuracy and Agreement 112
4.4 THE L0GIC0F COMPARISON 114
4.5ALG0RITHM 117 4.5.1 Introduction 117 4.5.2 Study Sampte 118 4.5.3 Development 119 4.5.4 StatisticalAnatysis 128 4.5.4.1 Descriptive Statistics 129 4.5.4.2 Predictive Performance 130 4.5.4.3 Measures and Levels of Agreement 133
4.5.4.3.1 Efficiency (Overali Agreement) 135
4.5.4.3.2 Sensitivity 135 4.5.4.3.3 Specificity 136 4.5.4.3.4 Predictive Values 138 4.5.4.3.5 Likelihood Ratio 138 4.5.4.3.6 Kappa 139 4.5.4.3.7 Kullback-Leibler Distance (KLD) 141 4.5.4.3.8 Levels of Agreement 142 4.5.5 Application 144 4.5.5.1 Study Sample 145 4.5.5.2 Analyses 146 4.5.5.2.1 Primary 146
4.5.5.2.2 Secondary .147
CHAPIER5: Resuit 153
5.1 DEvEL0PED ALGORITHM(COPD) 153
5.1.1 Central Tendency 154 5.1.2 Predictive Performance 160 5.1.3 Analysis ofAgreement 171 5.2APPLICATION 173 5.2.1 Population Characteristics 174 5.2.2 Central Tendency 175
5.2.3 Hospitalizationsfor Specfic Indications 183
5.2.3.1 Acute Myocardial Infarction (AMI) 183
5.2.3.1.1 Diagnosis Agreement 184
5.2.3.1.2 Central Tendency 185
5.2.3.2 Upper Gastrointestinal Bleeding (UGIB) 189
5.2.3.2.1 Diagnosis Agreement 189
5.2.3.2.2 Central Tendency 194
CHAPTER 6: DISCUSSION 198
6.1 HOSPITALIZATION EPIs0DE5 200
6.1.1 The Optimal Gap 201
6.1.2 Appropriateness of Central Tendency 205
6.1.2.1 Typical Measure 207 6.1.2.2 Outiiers 20$ 6.1.3 Diagnosis Agreement 210 6.1.3.1 COPD Hospitalizations 211 6.1.3.2 AMI Hospitalizations 213 6.1.3.3 UGIB Hospitalizations 214 6.2 LIMITATIoNs 218 6.3 IMPLIcATIoNs 221 CIIAPTER 7: Conclusion 224
Reference .227
Appendix 1 254
Appendix 2 255
Appendix 3 256
List of Tables
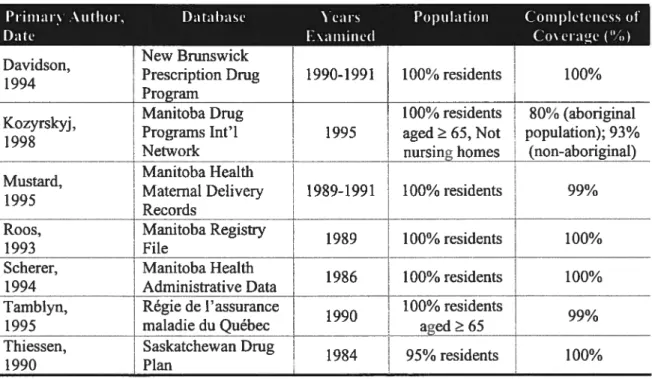
Table 2.1— Assessment of population coverage.49
Table 2.2— Comparison of hospital discharge summary with an additional source 51
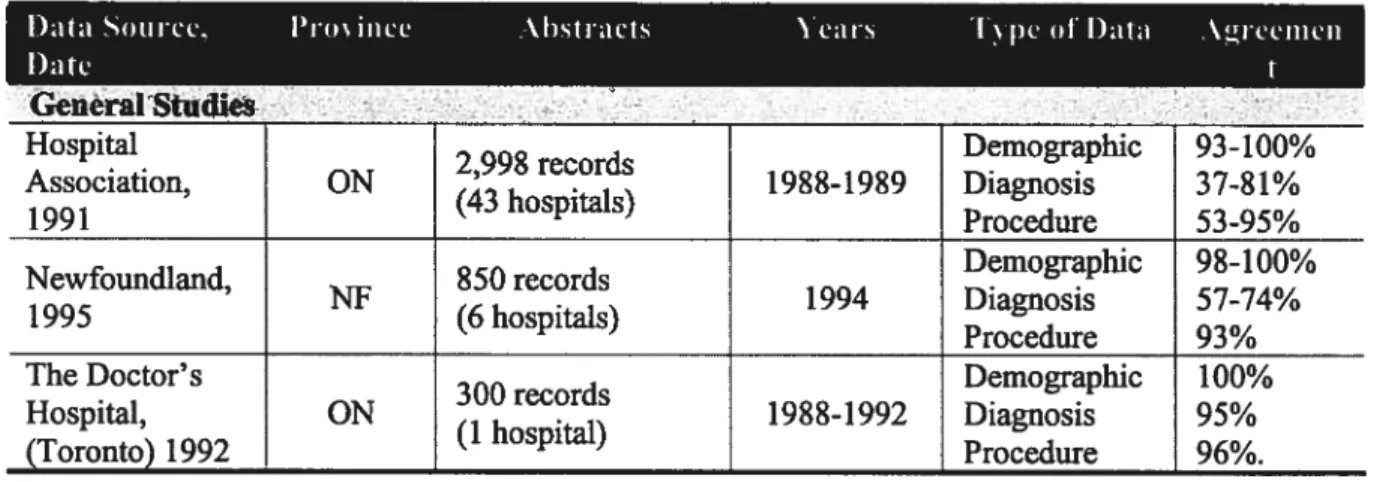
Table 2.3— Summary of Canadianreabstraction studies of hospital records 52
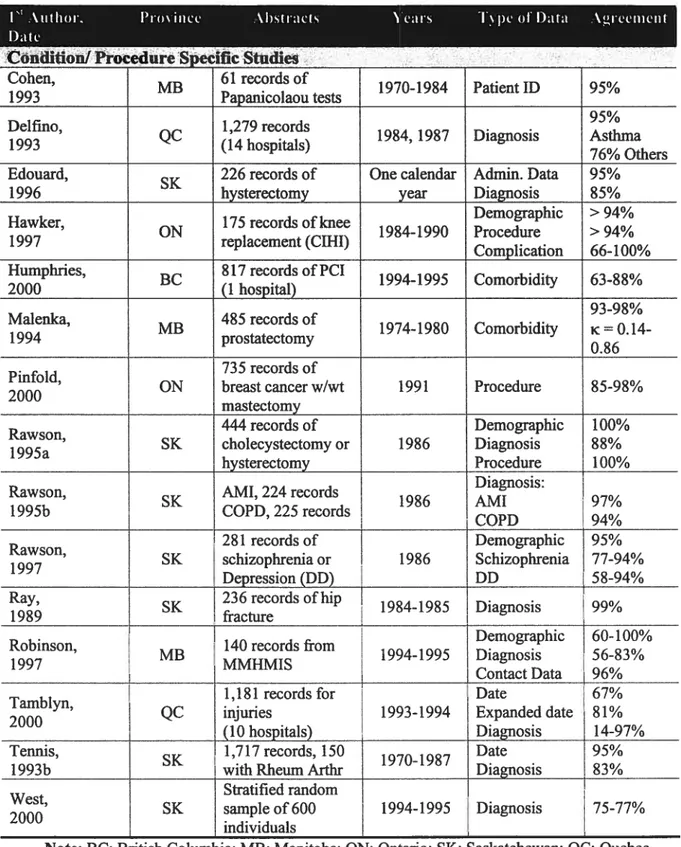
Table 2.4— Summaryof Canadian reabstraction studies (specific) 53
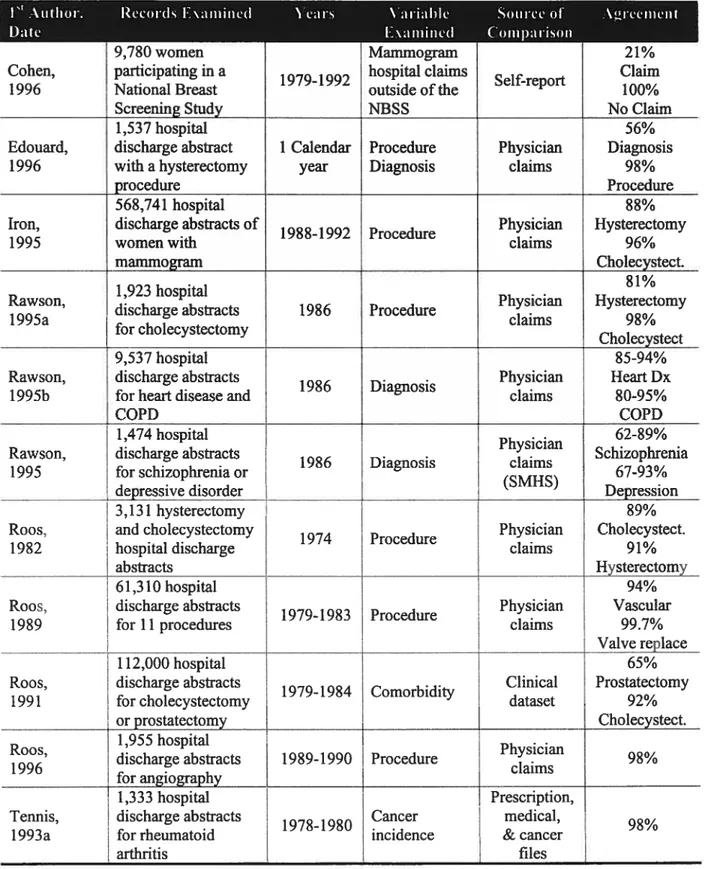
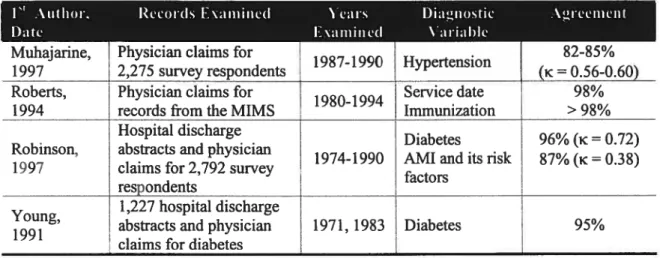
Table 2.5— Studies ontheaccuracy ofphysician daims in Canada 59
Table 2.6— Summaryof abnonnalities found in administrative databases 90
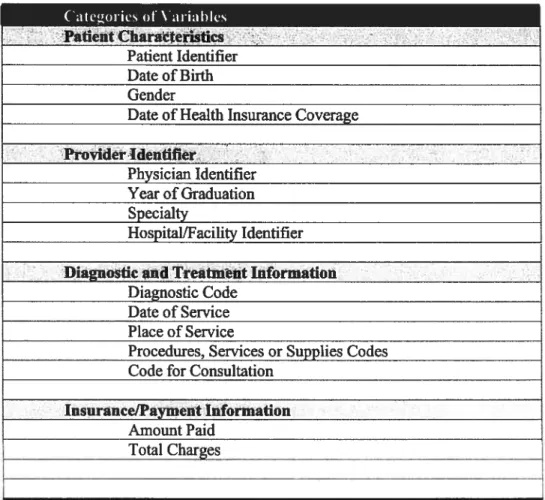
Table 4.1— List of standard data elements intheRAMQ medical database 112
Table 5.1— Estimated LOS in ifie RAMQ medical daims database 156
Table 5.2— Estimated number of hospitalizations in the RAMQ medical daims database.. 157
Table 5.3— Abso lute predictive perfonnance of selected algorithms (gaps) 161
Table 5.4—Estimated population parameters in a cohort of COPD patients using the RAMQ
database, compared to theGold Standard 170
Table 5.5—Estimated population parameters in the RAMQ database compared to the values
observed in the Gold Standard 176
Table 5.6—Estimated population parameters for AMI in the RAMQ database compared to the
values observed in MED-ECHO 186
Table 5.7—Selected agreement statistics comparing different models for UGIB 191
Table 5.8—Reliability statistics comparing different models for UGIB 192
Table 5.9 —Estimated population parameters for UGIB in the RAMQ database compared to
List of Figures
figure 4.1 —Four stages in a database validation study using linkage method 100
Figure 4.2—Algorithm to estimate episodes of hospitalizations 121
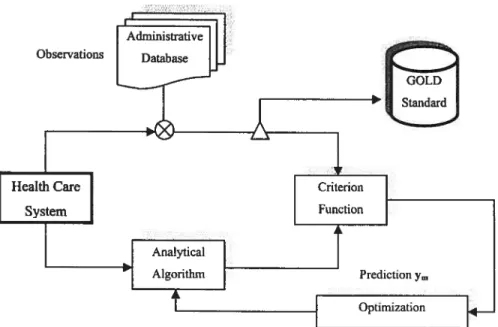
Figure 4.3—Schematic overview of analysis of agreement in daims data 134
figure 5.1—Age distribution inthe COPD cohort by gender 154
Figure 5.2 —Estimated lengthof stay(LOS) in RAMQusing different gaps 15$ Figure 5.3—Estimated N° of hospitalizations inRAMQusing different gaps 159 Figure5.4 —Distribution of predictive performance (% PE) for selected algorithms 162
Figure 5.5—Residual error estimates of selected algorithms (LOS) 163
Figure 5.6—Residual error estimates of selected algorithms (N° of Hospitalizations) 164
Figure 5.7—Frequency distribution of gaps inthe RAMQmedical daims database 166
Figure 5.8—frequency distribution of hospitalization intervals in MED-ECHO 167
Figure 5.9—Histogram of average LOS anditspdf 168
Figure 5.10—Histogram of N° of hospitalizationsanditspdf 168
figure 5.11 —Comparison of the estimated LOS andN° ofhospitalizations to the gold
standard (MED-ECHO). As shown in these graphs, LOS and number of
hospitalizations boffi follow a lognormal distribution 169
Figure 5.12—Estimated LOS and N° ofhospitalizations compared to MED-ECHO database
(Gold Standard) 178
Figure 5.13—Histogram and thepdfofLOS in MED-ECHOandRAMQ databases 179
Figure 5.15 — Comparison of ffie estimated LOS and N° of hospitalizations with the gold
standard, both pdfs follow lognormal distribution 180
Figure 5.16—Frequency distribution of gaps in the RAMQ medical daims database 182
Figure 5.17—frequency distribution of hospitalization intewals in MED-ECHO 182
Figure 5.18—Histogram and pdfdistribution ofLOS in MED-ECHO and RÀMQ 187
Figure 5.19 — Comparison of the estimated LO$ inth RAMQ with MED-ECHO as the gold
standard, LOS follows a lognonnal distribution 188 Figure 5.20 — Histogram and the pdf distribution of LOS in MED-ECHO and RAMQ for
models M2 (Most sensitive) and M4 (most specific) 196
Figure 5.21 —Comparison of ifie estimated LOS in the RAMQ with MED-ECHO as the gold
standard; distribution of LOS can be approximated using a lognormal
distribution 197
Symbols & Abbreviations
ic Cohen’s kappa
E
Summation symbolq
Square rootI
I
Absolute valuex Operation for multiplication group % APE Absolute prediction error percentage % PE Prediction error percentage
CI Confidence interval
CV Coefficient ofvanation
FN False negative
FP False positive
KL distance Kullback-Leibler distance LR+ Likelihood ratio of positive test LR- Likelihood ratio of negative test
MAE Mean absolute error
ME Mean error
PABAK Prevalence and bias adjusted kappa pdf probability density function
Pe Expected (Chance) agreement
P0 Observed agreement
Rule-in probability Rule-out probability
PVP Predictive value of positive test PYN, NPV Predictive value of negative test RMSE Root mean squared error
SD, a Standard deviation
Se Sensitivity
Sp $pecificity
TN True negative
Introduction
Today’s research increasingly focuses on the observation of outcomes to assess the impact of medical procedures and interventions. Outcomes Research seeks to understand, describe, interpret, and predict the impact of various practices, especially (but flot exclusively) interventions on «final» end resuits that matter to decision makers: patients, providers, private payers, govemment agencies, or society at large.
Measuring outcomes—and applying the results to continually improve care— is an on-going challenge. Assessing the outcome of care is particularly important for chronic diseases, such as chronic obstructive pulmonary disease (COPD), because of their increasing burden upon the health care system. COPD is a chronic progressive disorder and in spite of the large number of patients undergoing active medical interventions at any given lime and various guidelines for the treatment and management of COPD [Briggs DD, 2000], there is a lack of consensus regarding the detailed components of effective Outcomes research. It is flot known, for example, whether management plans are effective in reducing health care costs (e.g.; by decreasing the length of inhospital stay) or improving the outcomes of exacerbations (e.g.; by reducing the number of inhospital visits). A patient with COPD is ftequently encountered by the physician, and may further require inhospital admission for an
acute exacerbation episode. Therefore, for an outcome research study in COPD, the collection of data must cover the primary care setting including inhospital records, which should strongly depend on solid information base—valid data. Inhospital information is inevitably important since it can be used for Effective Outcomes Research by which one can readily assess health care utilization, evaluate costs, and last but flot least, examine inhospital morbidity and disease complexity.
Effective Outcomes Research becomes even more important, when we realize that a more broadly defmed set of outcomes than short-term morbidity and mortality indexes are necessary to develop efficient ways of providing services to patients. for instance, Outcomes data including hospital discharge are needed to fully evaluate some effects of inpatient interventions and services. Single indicators, indeed, in isolation often do flot provide the answer, particularly when one considers a high variation in surrogate measures in different clinical settings. Accordingly, measuring Outcomes indicators, particularly in the management of certain diseases, with exactitude is essential and requires modem technologies and analytical instruments. The traditional approach to Outcomes Research is often based on analysis of secondary (administrative daims) data, through data collected from patient surveys, or medical chart reviews [Wray NP, 1995].
Accordingly, the development of complex health care systems in several countries lias contributed to the creation of large health databases, such as those maintained by the provincial health insurance database in Quebec (Régie de
l’assurance Maladie du Québec—RAMQ), for administrative purposes. Although they were flot originally intended for research use, and despite their limitations [Bright RA, 1989; Potvin L and Champagne F, 1986; Demlo LK and Campbell PM, 1981], administrative databases are frequentiy used in analytical epidemiologic studies. Indeed, they can provide an increasingiy accessible and widely used source of data for health care research and technology assessment [Roos LL, 1989; Conneli FA, 1987]. Because of the large size and neariy universai coverage of defmed populations in these databases, they offer the opportunity for popuiation-based research, with large sample sizes and possible longitudinal follow-up. Moreover, administrative databases benefit from other advantages namely: non-intrusive data collection, low cost, and no reliance on individual recali [Roos LL and $harp SM, 1988; Roos LLJr, 1987].
Medicare files provided by the RAMQ have been used in various studies (j) to investigate disease incidence, adverse drug reaction, and systematic bias [Garbe E, 1998; McLean M, 1994; Beland F, 1989], (ii) to document variations in treatment pattems [Sheehy O and LeLoner J, 2000], (iii) or regionai variation in the management of certain diseases [Rodrigues EJ, 2002], (iv) to evaluate the outcomes of specific medical treatments [Garbe E, 1997], (y) to examine diagnostic and procedure coding validation [Tamblyn R, 2000], (vi) to investigate the utilization pattems and effects of dmgs [Biais L, 2003; Rahme E, 2002; Biais L, 2001; LeLorier J, 1995], and (vii) to assess the effect of different factors on health care utiiization [Biais R and Maiga A, 1999; Demers M, 1995] in relatively large populations at iimited cost and
reasonable lime. Most concem about the validity of research findings, in those cases, has focused on issues related to the accuracy of diagnostic coding and systematic bias. In a number of studies, drug prescription daims information included in ffie RAMQ has also been linked to other health care databases, and has been subject for validation [Tamblyn R, 1995]. However, the completeness and accuracy of the RAMQ medical services information, particulariy concerrnng inpatient (hospitalization) records remains uncertain. This requires further endeavor since the data conceming hospitalizations are flot specifically contained in these data files and must be deduced from the medical daims designated to inhospital visits by the physician. Moreover, a readmission occurring within a few days after the discharge complicates the process.
Although the identification of inhospital codes provides essentiai information to establish the fact that the patient was certainly admitted to the hospital, we additionally need a computer algorithm to estimate the duration of hospitalizations. Development of an algorithm to identify inhospital information with the best possible accuracy requires an additional linkage to the Quebec hospital discharge database (known as MED-ECHO: Maintenance et Exploitation des Données pour l’Étude de la Clientèle Hospitalière) in which ail the relevant records regarding hospitalizations, duration, and their related diagnoses are stored. Aithough this linkage is flot technically difficuh, it is time-consuming and usually imposes delays in research projects (inefficiency). Investigators, including those at the Epidemioiogy and Economics Research Unit at Centre Hospitalier de l’Université de Montréal (CHUM),
have used this research methodology to report the health outcomes in a number of publications using administrative databases and record linkage.
Using administrative databases, however, makes one to contend wiffi the problem of overcoming bias from the many confounding factors, such as the question of data validity. Validation of data in any epidemiologic study is veiy important; and the RAMQ medical services database is flot an exception. fortunately, the structure of RAMQ database permits examination of some aspects of the completeness and accuracy of its data through extemal validation. The validation of RAMQ database, conceming hospitalization of a target population, can be implemented through comparison analyses with a “gold standard”, i.e., MED-ECHO database. Since it is unlikely ifiat the two data streams would agree and that both would be incorrect, the integration of these two independent data streams could also be used to investigate the outcomes of care.
Outcome measures are often seen as the ‘Holy Grau’ for quality of care measurement [Berwick DM, 1989). Generic markers of patient outcomes are commonly used as surrogate measures of quality-of-care because of the relative ease of obtaining this information. Examples of these quality-of-care parameters are mortality and morbidity. Morbidity is ofien described by the inhospital length of stay (LOS) or hospital readmission; which both can be estimated by the RAMQ medical services database. Moreover, the RAMQ database can provide the opportunity for
comparative analyses through the use of summary statistics to identify trends over time and between institutions.
The length of stay (LOS) is an important variable in the analysis of hospital performance; it is frequently used as an indicator of efficiency, and also used as a proxy to other aspects of care, such as case complexity, severity of iÏÏness andquality of care. Usually, it is tacitly assumed that the actual length of stay is ffie number of days it takes for the hospital to provide proper care for the patient, including time for diagnostic examination, treatment, recoveiy, and whatever is needed.
In the changing healthcare environment, efficient utilization of inpatient resources is an essential task. The length of stay can be used as a proxy for hospital costs and efficiency. Reducing the length of hospital stay is a fundamental element of modem health cost containment (or policy). Managing of health care resources has become a daunting task and the ability to gaffier and meaningfully evaluate the pertinent administrative data is essential for operational success. Relevant objective data must be collected, analyzed, and interpreted appropriately. The information thus obtained can be used to estimate the average hospitalization length of stay and consequently the relative cost of health care services provided to the target population.
furthermore, clinical curiosity and the high economic cost of patient readmission have stimulated the interest in hospital readmissions over the past decades. Research studies, for this purpose, are extremely facilitated by the ease and
relative small costs associated with extracting the data from existing administrative systems. These factors and the apparent face validity of hospital readmissions as a quality-of-care measure promulgated the use of readmission rates as a clinical indicator [Ibrahim JE, 1999]. Furifier studies can then be implemented in order to examine the appropriateness of the hospital readmissions.
Evaluating hospital length of stay and readmission is a challenging task, particularly since some patients could have rather extended stays. This dissertation explores this issue in an effort to investigate the quality of RAMQ administrative data. In so doing, we developed an analytical algorithm to evaluate the length of stay and number of hospitalizations in a group of patients based on the gold standard database, MED-ECHO. Although acquiring information on resource utilization is much easier and faster when data are gathered using administrative databases (compared to prospectively data collection); validation of the RAMQ medical daims database is essential since information recorded in this database are relatively more accessible compared to the MED-ECHO database that is often time-consuming. Substantial time and cost savings can be made if information could instead be collected from RAMQ, although tins approach has possible shortcomings as weIl as advantages.
The consistency between inpatient resource utilization found in the RAMQ administrative data and records from MED-ECHO database could be based on choice of selected diagnostic codes. The main goal of this project is to develop and to validate a reliable and robust algorithm to determine inhospital episodes of
hospitalizations, including length of stay and readmission using the RAMQ medical services database. This can be made through an automated deterministic linkage model with the hospital discharge summary, MED-ECHO database; the sensitivity, specificity, and positive and negative predictive values of the RAIvIQ database can then be estimated, as well as measures of reliability such as kappa (x) statistics.
Review ofLiterature
2
2.1 Chronic Obstrucfive Pulmonary Disease
2.1.1 Definition
Chronic obstnictive pulmonary disease (COPD) is a progressive lung disease characterized primarily by airway obstruction and decreased airflow [Ferguson GT and Chemiack RM, 1993]. Its symptoms do flot usually become apparent until the age of 55. The changes to the lung, however, actually begin many years earlier. Chronic bronchitis and emphysema are two distinct components of COPD, but may occur simultaneously in the same individual.
Chronic bronchitis is defined as “the presence of a chronic cough for 3 months in each of two successive years in a patient in whom other causes of chronic cough have been excluded” [American Thoracic Society, 1995]. Chronic bronchitis is characterized by chronic inflammation and edema of the peripheral airways, excessive mucus production and accumulation, bronchospasm, bronchial airway obstruction, and hypennflation of the alveoli distal to the obstructed airways.
Emphysema is defmed as “the abnormal permanent enlargement of the afrspaces distal to the terminal bronchioles, accompanied by the destruction of their walls and without obvious fibrosis” [American Thoracic Society, 1995]. It is
characterized by alveolar deterioration and hyperinflation, destruction of pulmonary capillaries, weakened respiratory bronchioles, and air trapping.
COPD develops slowly over a period of years and is irreversible, ofien resulting in death. As ffie disease progresses, individuals with COPD experience reduced quality of life due to limited activity levels. The prhnary physical manifestations that resuit from pathophysiologic changes in COPD include dyspnea (shortness of breath), persistent cough, excessive sputum production, fatigue, decreased exercise tolerance, hypoxemia, and deconditioning [Gerald LB, 2001; Schulman LL, 20001.
COPD is a progressive disease that worsens in severity with time, and is characterized by recurrent “exacerbations” of vaiying intensity. An acute COPD exacerbation is defined as any combination of worsening dyspnea, increase in sputum production, andlor increase in sputum purulence [Snow V, 2001]. In Canada it is estimated that individuals with COPD experience anywhere from 1-4 acute exacerbations of the disease each year [Canadian Respiratory Review Panel, 1998].
Thus, exacerbations are detrimental to a COPD patient’s quality of life and may resuit in either temporary or permanent disability, increased emergency room visits and hospital admissions, respiratory failure, or even death. An important goal of COPD management therefore is to decrease the number and the severity of
exacerbations expenenced by COPD patients, through comprehensive patient education, early aggressive medicai management, and proper follow-up care.
2.1.2 Etiology
The etiology of COPD can be attributed to smoking in 80-90% of cases. COPD can also 5e induced by exposure to second-hand smoke andlor environmental poilutants, a history of recurrent respiratory infections in chuldhood, as well as a genetic disorder in 1-5% of cases [Lacasse Y, 1999]. Approximateiy 15% of ail individuals who smoke will develop COPD [Sherk PA and Grossman RF, 2000] and they are 10 times more iikely to die of COPD than nonsmoker. Smoking cessation has been associated with a decreasing frequency of recurrent respiratory symptoms and infections in former smokers, as compared to those individuals who continued to smoke [Heaith Canada, 2001].
Smoking is not the oniy etioiogy that is related to the development of COPD. Hereditary disorders aiso play a role in the onset of COPD eariy in life. The most common genetic cause of COPD is related to an inherited deficiency in aiphal antitrypsin (ATT), a protein that is normaily produced by the liver that plays a role in ffie inhibition of severai proteases, inciuding neutrophil elastase [Sandford AI and Pare PD, 2000].
The remaming causes of COPD include prolonged exposure to second-hand smoke and/or environmental pollutants and recurrent respiratory infections during childhood. Second-hand smoke can be just as harmful to nonsmokers. It contains 200 poisonous chemicals that can cause serious health problems including respiratory infections, COPD exacerbations, and asthma. Other environmental pollutants such as carbon monoxide, suiffir dioxide, nitrogen oxide, the ozone, and suspended particulates may initiate the inflammatory process and contribute to the development of COPD [Lohr KN, 1992].
Recurrent respfratory infections dunng chuldhood have also been suggested as a cause of COPD. Early recurrent infections in childhood can stunt the growth of lung tissue and resuit in decreased forced expiratory volume in 1 second (FEV1) and forced vital capacity (fVC) in adulthood [Shaheen 50, 1998]. Permanent damage and fibrotic scarring of the airways may occur as a resuit of the excessive inflammatory response (airway hyper-responsiveness) potentiated by frequent lower respiratory tract bacterial infections in childhood [Murphy TF, 2000; Sethi S, 2000]. Chronic mucus hyper-secretion and poor control of lung elastase activity causing increased lung tissue damage both occur, which contribute to the development of chronic bronchitis andJor emphysema. Ail of these pathologic changes caused by recurrent childhood infections make the individual even more susceptible to the further lung damage caused by cigarette smoke and other poilutants.
2.1.3 Epidemiology
2.1.3.1 Prevalence
A recent study reported on the prevalence of COPD in Canada by patient age [Lacasse Y, 1999]. Notably, the prevalence of COPD is clearly age-dependent; based on clinical presentation and spirometry data, 5% to 10% of patients who are at least 55 years of age have COPD. Data from the early 1980s show that the prevalence of this disease is increasing in Canada [Petty TL, 1997; National Institutes of Health, 19961.
2.1.3.2 Mortality
COPD has consistently ranked as the fourth leading cause of mortality and morbidity in Canada and the United States; and is the only cause of death that has increased in prevalence over the last several years. For instance, the number of deaths attributed to COPD almost doubled between the early 19$Os (4438) and the mid
1990s ($583) [Lacasse Y, 1999].
2.1.3.3 Morbidity
Although many COPD exacerbations can be successfully treated in the outpatient setting, hospitalization is common. Individuals with COPD may need to be hospitalized for treatment of an acute exacerbation or in the final end stage of their disease. The total annual number of hospital separations—hospital morbidity—in which COPD was the primaiy diagnosis increased by 32% from 19$ 1-82 to 1993-94 (from 42,102 to 55,785) [Lacasse Y, 19991. Moreover, respiratory diseases, including
COPD, were the third most common primary diagnoses contributing to hospitalization in both genders in 1998 (13% of ail hospitalizations for men and 11% of those for women) [Heaiffi Canada, 2001]. Hospitalization rates vary among age groups. for example, beginning at age 55 years, hospitalization rates for COPD in 199$ increased steadily wiffi age among both men and women. Rates were higher for men than women particularly among the elderly [Health Canada, 2001]. It is also noteworthy that the rates of hospitalization are the highest in the eastem provinces—including Quebec {Health Canada, 2001]. The variation in hospitalization rates among provinces may reflect variations not only in prevalence, but also in the way health services are deiivered.
2.1.4 Burden of Chronic Obstrucfive Pulmonary Disease
The real burden of COPD is best understood by comparing its indexes of mortality and (hospital) morbidity with other health conditions. Such data recently became available in a report detailing the causes of mortality and hospitalization among Canadian senior citizens. for the period from 1984 to 1993, COPD was the fourth-ranked cause of both mortality and morbidity in Canada [Stokes J and Lindsay J, 1996]. Therefore, it exerts a major economic impact on the Canadian health care system. The direct costs of heaiffi care associated with COPD, such as drugs, physician care, and hospital care, are estimated to be more than 3.5 billion dollars per
year [Healifi Canada, 2001; Health Canada, 1998]. The economic burden of this disease is more prominent if one takes into consideration the less visible or indirect expenses associated with COPD. for example, if one includes indirect costs associated with disability, work absenteeism, and early retirement, the economic burden would be even more significant (more than 12 billion dollars) [Health Canada, 2001; Health Canada, 1998]. The proportion of direct heaiffi care costs attributed to respiratory diseases ranked in the top 5 in terms of total costs in both 1993 and 1998 reports [Heaiffi Canada, 1998].
These 3 factors: high smoking prevalence (by far the most common etiological cause of COPD), increasing COPD prevalence, and rising costs of tiils disease; converged on health care system can easily motivate Outcomes Research studies.
• EFFECTWE MANAGEMENT 0F COPD: Tracking trends in COPD outcomes over time needs to be carried out so that health care system can plan for future increases in the need for services in view of predicted increases in COPD. This need is especially urgent in countries with limited health care resources.
• DATA COLLECTION: Data are needed on the use, costs, and relative distribution of medical and non-medical resources for COPD, especially in countries such as Canada where smoking and other risk factors are prevalent. These data are fflcely to have some impact on health policy and resource allocation
decisions. As options for treating COPD grow, more research will be needed to help guide health care personnel and health budget managers regarding the most efficient and effective ways of managing this disease.
OUTCOMES ASSESSMENT THROUGH A ROBUST AND INEXPENSWE METHOD: While conducting research is recommended to assess and monitor COPD outcomes, some (statistical) techniques need to be developed and evaluated in epidemiologic studies. Reproducible and inexpensive methodologies (e.g., use of RAMQ database) need to be evaluated and their use encouraged. This can ensure economical and accurate measurement when a relatively inexpensive and time-saving administrative database is being used.
• IDENTWICATION THROUGH EFFECTWE TECHNIQUES: Since COPD is flot fully reversible (with current therapies) and slowly progressive, it will become even more important to identify ail cases of resource utilization, particularly hospitalizations, as more effective techniques in data analysis emerge. Data to reveal whether or flot screening and performance are efficient in directing management decisions in COPD outcomes are required.
• HEALTH CARE UTILIZATION: The specific components of effective heaiffi care utilization for COPD patients need to be determined. It is not known, for example, wheffier management plans are effective in reducing health care costs (e.g., by reducing the LOS) or improving the outcomes of exacerbations.
Developing and evaluating effective tools for management of COPD will be important in view ofthe increasing public health problem presented by COPD.
2.2
Clinical Indicators in Outcomes Researcli
2.2.1 Introduction
Outcomes Research is rapidly becoming recognized as an essential component of health care systems. As providers continue to explore new technologies and develop more efficient ways of providmg services to patients, Outcomes Research becomes even more ofa necessity; and the search—tofind methodsfor measuring and monitoring Outcomes indicators in clinical settings and their impacts on quality of heaÏth care—continues. It is driven by the recognition that health care resources are fmite; but our aging population, with an increasing prevalence of chronic diseases, requires more health care. This means each part of the health care system must undertake responsibility for its own activities and should be able to justify its actions when another party is affected (i.e., accountability) [Emanuel El and Emanuel LL,
1996].
Hence, identification and assessment of a set of clinical indicators, which may be used to monitor and evaluate the outcomes and quality of acute clinical care provided within public hospitals, are greatly encouraged. In fact, Outcomes Research provides the ability to identify areas of risk and to assist decision-makers in directing resources and strategies. However, these tasks have many challenges and obstacles to be overcome. These obstacles can be summarized as:
1. Ambiguity: How to identify and measure the end resuits in health institutions by the use of available resources (e.g., RAMQ databases)? Generally, making use of new data to assess the distribution ofhealth care resources and the effectiveness ofclinical practices are highly required. Yet, measuring clinical indicators using a new data set
is flot aiways an easy task.
2. The validity of data gathering and data infrastructure: Therefore, the contribution of chance, bias, or confounding to a difference in outcomes cannot be excluded [O’Connor GT, 1993J. Moreover, it could be more difficuit if ifie information regarding these indicators is flot directly collected and must be explicitly deduced.
3. Costs: Although a few existing databases allow the measurement and evaluation of Outcomes indicators in hospital settings, the complicated process to access and Ïegal hurdies for the verification can be costly in terms of time delays. This, in tum, can effectively prevent a large number of researchers from being able to readily conduct their studies. Consequently, assessment of Outcomes indicators through robust and inexpensive methods is highly recommended; implementation of new methods may Iead to cost savings.
2.2.2
Background
Obviously, there is a need for objective tools, and a desire for development of algorithms, which will allow precise measurements and rational comparisons of hospital outcomes in health care systems. This would satisfy’ a multitude of users ranging from the providers of health care to administrators, consumers and govemments [The Quality Indicator Study Group, 1995; Sisk JE, 19901.
Amongst the many proposed objective tools are clinical indicators, which are viewed as a guide for the evaluation of the management and outcomes of patient care. “The purpose of a set of clinical indicators should be to provide objective, quantitative measures of the application in clinical practice and service deÏiveîy of evidence on the clinical and cost effectiveness of healthcare interventions “[Gold L, 1998]. These measures may increase the awareness of the public regarding the policies ofthe government and health care facilities.
2.2.2.1 Definition: Clinical Indicator
There are a number of definitions for clinical indicator. It is often defined as ‘a ineasurable element in the process or outcorne of care whose value suggests one or more dimensions of quality-ojcare and is theoreticalÏy amenabÏe to change by the
provider’ used in clinical management and decision-making [Bemstein SJ and Hilbome LH, 1993]. Simply stated a clinical indicator provides a means to reflect on and improve cimical practice, it is flot a precise measure of quality of care; rather it is a screen or flag which indicates areas for more detailed analysis.
Cimical indicators can be divided into groups based on:
(1) whether the clinical indicator measures a process or outcome of care;
(2) which domain of quality the clinical indicator is designed to measure; and fmally (3) whether ffie clinical indicator can be constructed into a rate-based measure or if it
should be regarded as a sentine! event.
2.2.2.2 Process or outcome indicators
The large numbers required to identfy statistical dfferences in outcome measures and the confounding effect on outcome offactors such as severity, casemix and demography are likely to make process indicators more attractive’ [Gold L, 199$].
It is an important debate whether a clinical indicator is the outcome of care or the process of care; and in which context it is being measured. For instance, whether it is an evaluation of the technical performance of medica! care for COPD by comparing the total number of patients treated, (1) with the number of patients who were hospitalized (outcome), or (2) with the number of patients who received the appropriate therapy (process).
Unless the crucial link between the process and outcome of care is established this debate caimot be resolved. At the center of the debate is the capacity of the human body to accommodate poor care and stili have a good outcome and the fact that excellent medical care cannot guarantee against a poor patient outcome.
2.2.2.2.1 Outcomes of care
Outcome measures are often seen as the ‘Holy Grau’ for quality measurement [Berwick DM, 19891. Generic markers of patient outcomes are commonly used as surrogate measures of quality-of-care because of the relative ease of obtaining this information, mcluding mortality and morbidity indexes. Morbidity is ofien described by the length of hospital stay, ratio of post operative wound infection, or ratio of hospital readmissions.
These outcome measures are perceived as more objective and clearly defined events with obvious relevance to the patient. The idea that the end resuit of care to the patient is the best indication of care is a simplistic and attractive concept [Donabedian A, 1989], while it is a fallacious one in practice [Caplan RA, 1991; Donabedian A, 1988]. Moreover, markers of an adverse event, a direct link of these outcomes to the quality of the hospital care delivered, cannot be easily made because of confounding variables such as patient and disease factors [Brook RH, 1996]. However, generic
outcome measures have been shown to be relatively efficient at addressing improvements in quality-of-care [Domingo-Salvany A, 2002; Fan VS, 20021.
2.2.2.2.2 Process of care
The potential advantage of process over outcome measures include the ability to readily identify the area of care deficiencies [Brook RH, 1996; Mant J and Hicks N, 1995; Brook RH and Appel FA, 1973], ffiereby, giving the efforts to improve care for these patients. An additional factor is that process of care (especially when judged using explicit criteria) could be more sensitive to poor care ffian outcome measures [Mant J and Hicks N, 1995]. This makes a strong case for using process rather than outcome measures when evaluating care particularly for medical as opposed to surgical care. The critical element, in this case, is to identify the processes of care, which are clearly proven to influence a patient’s outcome, such as the use of mechanical ventilation in the treatment of COPD [Soto FJ and Varkey B, 2003]. If objective evidence does flot support a particular process of care, selecting the process to measure becomes difficuh. Further the relevance of the particular process of care to quality is debatable. As with outcomes, the interpretation of process measures requires information about the patient characteristics and disease stage (complexity).
2.2.2.3 Domains of quality
Both process and outcome measures can be used to address different aspects of health care, from the purely technical aspects of clinical procedures in a hospital to the outcomes of preventive health measures. These domains of health care can be expressed in many ways. But they are essentially offering fair access to health services; providing whether health care is effective, appropriate, timely, and safe; conveniently demonstrating that the resources are used to achieve value for money; and ensuring that the health care system is sensitive to individual patients’ needs.
2.2.2.4 Rate-based or sentinel event indicator
A sentine! event is an ‘unexpected, usually avoidable event that must be investigated because the consequence is so grave’, such as post-operative mortality. These events are typically rare and so provide insufficient opportunities for improvement. However, sentine! events are a very important source of information if a detailed critical analysis is undertaken [Langford AM and Reitz JA, 1995 j.
Rate based indicators are expressed as a ratio with the number of occurrences divided by the total patients at risk for the event. These indicators can be used to data trend using eiffier external comparative data or for internai monitoring [Langford AM and Reitz JA, 1995].
2.2.3 Common Themes
The common themes of performance measures can be summarized as (1) specific evidence-based process measures and (2) genenc or specific outcome measures. These estimates can be applied to a single episode of care (i.e. hospital stay) or more broadly to the population. But the mai orily of outcome-based clinical indicators ofien reflect short term (e.g., the period of a hospitalization) and usually a proxy outcome (e.g., readmission).
The common generic outcome measures are usually based on mortality and hospital morbidity such as length of stay and readmission. Specific outcome measures are determined by the different interventions available for different diseases that can be extremely diverse, which are beyond the scope of this thesis.
2.2.3.1 Evidence-based process measures
Clinical indicators developed from evidence-based medicine have an inherent attraction because these indicators usually readily satisfy the criteria for validity, clinical relevance and potential to improve. However, the greatest concem with these clinical indicators is the ability to extract regularly and efficiently the necessary data. These indicators are normally developed from clinical research trials and practice guidelines.
The vaiidity of the mai ority of process-of-care clinicai indicators is based on face validity and consensus opinion rather than randomized controlled clinicai trials [Mannion R and Davies HT, 2002]. The major limitation of using these process-of care clinical indicators is the need for an intensive and costly effort to collect the data from the medical records.
2.2.3.2 Generic outcome measures
2.2.3.2.1 Mortality
Mortality is a critical event that requires continuous monitoring in ail health care settings. Mortality data raises many questions and has become ffie focus of consumers, insurers and public health agencies [Iezzoni LI, 1 997b; Gamick DW, 1995; Knaus WA, 1993; Green J, 1991; Seagroatt V, 1991; Kahn KL, 1988; Dubois RW, 19875].
The clinical indicators about mortality can be considered in the following broad categories:
1) overall mortality rates (e.g. total inhospital mortality)
j) high risk conditions (inhospital mortality for patients with acute myocardial infarction [Gamick DW, 19951)
ii) elective low risk conditions (post-surgical mortality [Roos LL, 19901)
3) deaffi wiffiin a specified time period
j) period of greatest risk (mortality within 24 hours of surgical processes such as percutaneous transiuminal coronary angioplasty [Miils TJ, 19891)
ii) during the entire inhospital stay (inhospital mortality following knee replacement [Mangaleshkar SR, 200 1])
iii) 30 day suwival and beyond (death within 30, 90 & 182 days of hospitalization for hip fracture [Roos LL, 1 996b])
The use of mortality rates, however, is almost aiways linked with the issue of risk adjustment. The complex series of events leading to a patient’s death are difficuit to unravel; in apportioning blame (i.e., poor quality of care) the relative contribution of the patient’disease factors must be considered. Studies [Dubois RW and Brook RH, 1988; Dubois RW, 19$7a] in the late 1980s examined the concept of screening hospitals for poor quality of care based on their mortality rates. Comparison between the expected and observed death rates were made, and if differences existed, the
question of whether the hospital performance or ffie uniquely iii patient populations was responsible for the deaths stiil had to be answered.
In 1986, the USA Health Care Fmancing Administration (HCFA) released risk adjusted hospital mortality rates for Medicare patients in an effort towards public accountability. Similarly the NUS also published «league tables» for several years of overali mortality rates. These efforts had a limited impact on improving quality of care and the HCFA eventually abandoned its program because the method for determining quality of care was not valid. These included concems about coding inconsistencies, inability to control adequately for the severity of illness [Fleming SI, 1995; Hartz AI, 1995]. Further, the reactions of hospital leaders to the HCFA data was extremely negative, the hospital leaders expressed major concems about the accuracy, usefiilness, and interpretability of the mortality data [Berwick DM and Wald DL,
1990].
Mortality rates for procedures (e.g., following cardiac surgery) have the most prominence in the debate about the use of these performance measures for quality. The time between a surgical intervention and death is usually closely linked; but tins is flot the case with chronic medical conditions (e.g., heart failure).