arXiv:1106.4393v1 [astro-ph.EP] 22 Jun 2011
June 23, 2011
Transiting exoplanets from the CoRoT space mission
⋆
XVII. The hot Jupiter CoRoT-17b: a very old planet
Sz. Csizmadia1, C. Moutou2, M. Deleuil2, J. Cabrera1
,3, M. Fridlund4, D. Gandolfi4, S. Aigrain5, R. Alonso6,
J.-M. Almenara2, M. Auvergne7, A. Baglin7, P. Barge2, A. S. Bonomo2, P. Bord´e8, F. Bouchy12
,13, H. Bruntt7,
L. Carone14, S. Carpano4, C. Cavarroc8, W. Cochran9, H. J. Deeg10
,11, R. F. D´ıaz13, R. Dvorak15, M. Endl9,
A. Erikson1, S. Ferraz-Mello16, Th. Fruth1, J.-C. Gazzano2
,17, M. Gillon18, E. W. Guenther19, T. Guillot17,
A. Hatzes19, M. Havel17, G. H´ebrard12
,13, E. Jehin18, L. Jorda2, A. L´eger8, A. Llebaria2, H. Lammer20, C. Lovis6,
P. J. MacQueen9, T. Mazeh21, M. Ollivier8, M. P¨atzold14, D. Queloz6, H. Rauer1
,22, D. Rouan7, A. Santerne2,
J. Schneider3, B. Tingley10
,11, R. Titz-Weider1, and G. Wuchterl19
(Affiliations can be found after the references)
Received 3 April, 2011; accepted 27 April, 2011
ABSTRACT
We report on the discovery of a hot Jupiter-type exoplanet, CoRoT-17b, detected by the CoRoT satellite. It has a mass of 2.43 ± 0.30MJupand a radius of 1.02 ± 0.07RJup, while its mean density is 2.82 ± 0.38 g/cm3. CoRoT-17b is in a circular orbit with a period of 3.7681 ± 0.0003 days. The host star is an old (10.7 ± 1.0 Gyr) main-sequence star, which makes it an intriguing object for planetary evolution studies. The planet’s internal composition is not well constrained and can range from pure H/He to one that can contain ∼380 earth masses of heavier elements.
Key words.stars: planetary systems - techniques: photometry - techniques: radial velocities - techniques: spectroscopic
1. Introduction
Similar to eclipsing binaries, which offer the ”Royal Road” to understanding the physics and nature of stars (Russell 1932; Batten 2005), transiting exoplanets are key objects in terms of understanding the formation, evolution and properties of planets. In Russell’s context, ’Royal Road’ means that we have a way to obtain data that were previously unavailable by other observa-tional methods (Batten 2005). The transits and - if they are ob-servable - occultations of exoplanets provide unique possibilities to determine e.g. their mass, radius and orbital characteristics, atmospheric composition as well as internal structure. The con-secutive transit and occultation observations allow us to study
⋆ The CoRoT space mission, launched on December 27th 2006,
has been developed and is operated by CNES, with the contribution of Austria, Belgium, Brazil, ESA (RSSD and Science Programme), Germany and Spain. Part of the observations were obtained at the Canada-France-Hawaii Telescope (CFHT) which is operated by the National Research Council of Canada, the Institut National des Sciences de l’Univers of the Centre National de la Recherche Scientifique of France, and the University of Hawaii. Based on observations made with HARPS spectrograph on the 3.6-m European Organisation for Astronomical Research in the Southern Hemisphere telescope at La Silla Observatory, Chile (ESO program 184.C-0639). Based on ob-servations made with the IAC80 telescope operated on the island of Tenerife by the Instituto de Astrof´ısica de Canarias in the Spanish Observatorio del Teide. Part of the data presented herein were obtained at the W.M. Keck Observatory, which is operated as a scientific part-nership among the California Institute of Technology, the University of California and the National Aeronautics and Space Administration. The Observatory was made possible by the generous financial support of the W.M. Keck Foundation.
the orbital element changes caused by either gravitational inter-action with another body or by tidal and/or magnetic interinter-actions between the star and the planet.
CoRoT (Convection, Rotation and planetary Transit) is a 27 cm diameter space-telescope (Baglin 2007). The goals of the mission are to obtain long-term photometric data sets for aster-oseismological studies on relatively bright pulsating stars and to search for new transiting exoplanets. Here we report the detec-tion of another hot Jupiter, named CoRoT-17b. It orbits a faint star (V ≈ 15.5) in a 3.76 days orbit. As we will show below, the host star is evolved and quite old: its age is 10.7 ± 1.0 Gyr.
2. CoRoT observations and their analysis
2.1. Data
CoRoT-17 is located in the so-called LRc03 field, which was a medium-long field (for the target’s coordinates see Table 1 and for the finding chart see Fig. 1)1. The star is listed in many pho-tometric catalogues (for a selection see Table 1), from which its spectral energy distribution is known from the optical to mid-infrared.
The star was observed for 89.2 days, from HJD 2 454 925.4199 to HJD 2 455 014.6107, corresponding to the period from 2009 April 03, 22 UT until 2009 July 02, 03 UT. In total, 14,861 data points were obtained in white light. However, some of these data points were obtained when the satellite 1 The interested reader can find more details about the CoRoT ob-servational strategy in Baglin et al. (2007), Boisnard et al. (2006) and Auvergne et al. (2009).
Table 1. IDs, coordinates, and magnitudes of CoRoT-17. CoRoT window ID LRc03 E2 2182 CoRoT ID 311519570 2MASS 2MASS18344782-0636440 UCAC3 3UC 167-181321 USNO-A2 0825-12387389 USNO-B1 0833-042306 GSC 2.2 S3003-3212601 GSC 2.3 S9O9002601 NOMAD1 0833-0454552 Coordinates RA (J2000) 18h 34m 47.82s Dec (J2000) −6◦ 36’ 44.04” Magnitudes
Filter Mag & Error Source
r’ 15.346±0.007 ExoData i’ 14.521±0.011 ExoDat V 15.46 ExoDat J 13.174 ± 0.036 2MASS H 12.615 ± 0.062 2MASS K 12.472 ± 0.054 2MASS [3.6] 12.232 ±0.068 IRAC [4.5] 12.181 ±0.069 IRAC [5.8] 12.149 ±0.142 IRAC [8.0] 12.079 ±0.151 IRAC
Notes.(a)Deleuil et al. (2009)
crossed the so-called South Atlantic Anomaly (SAA), which causes an increase in the high-energy particle flux and strongly affects the observed fluxes. We excluded these data points as well as those that were flagged by the pipeline for other reasons (Baudin et al 2008). For instance, we excluded all data points that were acquired during the transition of the satellite from light to Earth-shadow (see Auvergne et al. 2009) or vice versa (779 and 795 data points, respectively). These transitions cause con-siderable voltage and temperature fluctuations (Auvergne 2009). We kept 10,489 good data points (71.4% of all the data points). The exposure time was uniformly 512 seconds for CoRoT-17b because of the faintness of the star.
The original observations were reduced by the CoRoT pipeline. The jumps, caused by high-energy particle impacts (cosmic ray events, see Auvergne et al 2009), were corrected by us. The result can be seen in Figure 2.
The light curve also shows some non-periodic modulation with an amplitude of ∼ 2%, probably caused by stellar activity. The spectroscopic analysis of the star (Sect. 3.3) yielded v sin i ≈ 4.5 ± 0.5 km/s projected rotational velocity and the combined spectroscopic and photometric analysis of the stellar properties gave Rstar = 1.59R⊙(Sect. 3.3). From this one can expect P =
20.1 days rotational period for the star. We calculated the Lomb-Scargle periodogram of the light curve, but no clear periodicty nor any peak in the periodogram relatively close to this expected value were found.
The transits were detected in the so-called ’alarm-mode’ (Quentin et al. 2006 Surace et al. 2008). Twenty-five transit events were observed by CoRoT with an orbital period of 3.7681 days. These events are analysed in Sect. 2.2. The duration of the transit was measured to be 4.72 hours and its depth is approxi-mately 0.44% (see Figure 3 and Table 2.).
Fig. 1. Sky area around CoRoT-17 (star in the centre). Left:
g-filter image with a resolution of 0.7” taken with the CFHT tele-scope. Right: image taken by CoRoT at the same scale and ori-entation. The jagged outline in its centre is the photometric aper-ture mask; indicated are also CoRoT’s x and y image coordinates and positions of nearby stars that are in the ExoDat database (Deleuil et al. 2009). 0.97 0.98 0.99 1 1.01 1.02 1.03 1.04 1.05 4920 4930 4940 4950 4960 4970 4980 4990 5000 5010 5020 Flux (normalized) time (HJD - 2 450 000)
Fig. 2. Light curve of CoRoT-17 after removing the most
obvi-ous jumps.
2.2. Transit modelling
Owing to the very complicated nature of the light curve, which is affected by various instrumental effects such as jumps, SAA-crossing etc., we constructed the transit light curve for the mod-elling in the following way. We excluded transits 5, 8, 12, 18, and 24, which were strongly altered by instrumental effects. Then we folded the light curve as shown in Fig. 3.
The instant of the centre of the ith transit is obviously Ti =
T0+ iP. Preceeding and following the beginning and the end of each transit, we cut one transit duration-long part of the light curve before and after the transit and fitted them by a parabola. Next, we selected the data points from the interval Ti−1.5D <
t < Ti+ 1.5D and then divided these light curve segments by the corresponding parabola. Here D is the duration of the transit. After that we removed outliers by applying a 5σ clipping. As a final step, we repeated this procedure again.
The transit light curve (Fig. 3) was fitted by a model to obtain the relevant geometrical and physical parameters of the system. We used the Mandel & Agol (2002) model and a specified ge-netic algorithm (Geem et al. 2001) for the transit fit. Gege-netic al-gorithms have already successfully been used to model the light
curves of eclipsing binary stars, and it was also applied to transit light curves (Fridlund et al 2010). Genetic algorithms have the advantage that it is possible to map the whole parameter space, therefore it is more likely to find the global minimum in the pa-rameter hyperspace. The errors of the papa-rameters can be easily estimated using a genetic algorithm approach, too. We give the 1σ-error bars, estimated from the width of the distribution of points, which are between χ2
minand χ
2
min+ 1.
Our free parameters were: semi-major axis to the stellar ra-dius ratio (a/Rstar), planet-to-stellar radius ratio (k), impact pa-rameter (b = a cos i/Rstar, where i is the inclination), and the combination of u+= u1+ u2, while we kept fixed u−= u1−u2. Here u1 and u2are the linear and the quadratic limb-darkening coefficients, respectively. The usage of these combinations was suggested by Brown et al (2001) and they are widely used in the transit modelling studies.
The contamination factor was a free parameter as well. This parameter gives an estimate of the fraction of the total observed flux that comes from different stars and not from the target ob-ject, because of the large PSF of CoRot (Figure 1). Bord´e et al (2010) described in detail how to determine this factor for CoRoT-targets. Applying the same method, we adopted 8 ± 4% for the contamination factor and it could vary within these con-straints.
In total, we had five free parameters. Because the radial ve-locity curve indicates a probably circular orbit, we assumed that the eccentricity is zero for the light curve modelling .
We calculated 13 different models, each of which had a fixed, but different value of u−. The fixed values of this combination of
limb darkening coefficients were -0.3, -0.2, -0.1, ..., 0.7, 0.8 and 0.9. Convergence was reached after ∼40 000 iterations at every fixed u−value. The “best“ light curve solution was then defined
as the ”centre of gravity”-like average-value of the 1000 lowest
χ2at every fixed u
−value.
The χ2-values showed an absolute minimum value at u
− =
0.2 where u+was equal to 0.65 ± 0.17. We checked whether our
limb-darkening coefficients agree with the theoretical ones, de-rived from the effective temperature, logg and metallicity of the star (see Sect. 3.3). Using the tables of Sing (2010), we found that theoretically they are u−= 0.23 ± 0.03 and u+= 0.68 ± 0.03
for CoRoT-17. (The uncertainties of the theoretical values stem from the uncertainties of the stellar parameters.) The modelled values are close to this prediction. We do not investigate this problem further, because the photometric signal-to-noise ratio is not sufficient to determine both limb-darkening coefficients si-multaneously, and because the found best value was within the error bars of the predicted one, the agreement is satisfactory. The finally adopted solution is shown in Fig. 3. The results of the transit light curve modelling is given in Table 2. In the sub-sequent analysis we need the M1/3star/Rstar for the determination of the stellar mass and radius. Re-arranging Kepler’s third law (Roberts 1899; Winn 2010), we calculate a value for this quan-tity of 0.61 ± 0.03 (solar units).
2.3. Parameter correlations
The result of transit lightcurve modelling can be degenerate, leading to equally acceptable solutions. For CoRoT-3b, for stance, the light curve modelling itself showed that in the in-clination - limb darkening coefficient plane there are two solu-tions, which cannot be distinguished from each other (Deleuil et al. 2008). It was already noticed in Brown et al. (2001) that at low impact parameters the solutions are degenerate in the
Fig. 3. Light curve solution of CoRoT-17. For the sake of clarity,
we superimposed the fit (red line) on the binned data instead of the original ones. The features on the bootom of the light curve (sudden flux increases) maybe caused by some spot crossing.
inclination-limb darkening coefficient plane if the observational errors are relatively large. Because CoRoT-17 is relatively faint, the light curve modelling most likely forms an ill-posed problem because of the noise levels involved. Therefore it is important to investigate how the various derived parameters are correlated.
To do that, we selected six combinations of four free parame-ters (a/Rstar, k, b and u+, see Fig. 4). Each of these combinations
consisted of two parameters. Then we fixed the other parameters at their values given in Table 2 determined before, while several hundreds of randomly selected combinations of the two investi-gated parameters were varied over a large interval of values. The panels of Fig. 4 show the models within 1σ (red), 2σ (green) and 3σ (blue).
We found that a/Rstar and k are not correlated, while we found negligible correlation for the pair of a/Rstar – u+, and the
correlation between k – u+is moderate. It is remarkable that the
k – b and b – u+ diagram has a non-symmetrical distribution.
The well-known correlation between a/Rstar and the impact pa-rameter b can also be seen. From the top right panel of Fig. 4 we can only give wide limits for these two parameters.
Studying these correlation diagrams, we concluded that all the parameters are well determined and unique, but the semi-major axis and the impact parameter are correlated. An impact parameter between 0 and 0.3 is the most probable value, but we are not able to constrain it better from the presently available photometry. It is safer to state that the semi-major axis/stellar ra-dius ratio is most probable between 6.0–6.4, but it is also hard to give better constraints. To gain more precise values one requires even more precise photometry for this faint star.
3. Ground-based observations and their analysis
3.1. Photometric measurements
As part of the ground-based photometric follow-up programme of CoRoT candidates, observations of CoRoT-17 were under-taken from several telescopes. The aim of these observations was to assess if the transit-events observed by CoRoT really arise from the CoRoT target star and not from any contaminat-ing nearby variable source. For more details on this follow-up programme, its motivation, techniques and results, see Deeg et al. (2009).
Fig. 4. Parameter-correlation diagrams for CoRoT-17.
Table 3. Telescopes used to assess the transit events observed by CoRoT and the log of observations. See text for discussion. For
TRAPPIST see Gillon et al. (2011) while for BEST II see Erikson et al. (2011).
Telescope Date of observation Note
CFHT/MEGACAM 2010 May 17 ON/OFF
2010 June 5 ON/OFF
OGS (Tenerife) 2010 June 9 ON
2010 June 10 OFF
TRAPPIST (La Silla) 2010 May 24 Only egress phase was observed
BEST II (Cerro Armazones) 2010 June 5 Photometry during the full event
The log of observations and the list of the used telescopes can be found in Table 3. Of these observations, none showed any sign of relevant variability on any of several stars that are con-taminating the CoRoT-aperture (Fig. 1). These stars would have to display eclipses with amplitudes of at least 7%, which would have been detected by any of the ground-observations that were undertaken. Only the second night from CFHT on 2010 June 5 also showed a significant variation on the target itself with an amplitude of 0.55%, close to the expected one from CoRoT.
The absence of a signal from the target in the other data has the following reasons: (i) the observations obtained in May suf-fered from a preliminary ephemeris and thus they did not see the deepest part of the transit. As a result of this experience, the ephemeris was refined and replaced in early June, 2010. (ii) The transit event in June was too shallow for OGS and BEST II and that is why these data were used only to exclude possible back-ground eclipsing binaries.
Table 2. Physical and geometrical parameters of the CoRoT-17
system. Inclination (i) was calculated from the a/Rstarratio and from the impact parameter b. The parameter M1/3/R can be cal-culated from the orbital period and from the a/Rstar value (see e.g. Winn 2010). Teqis the equlibirium temperature of the planet.
Determined from photometry
Epoch of periastron T0[HJD-2400000] 54 923.3093±0.0036
Orbital period (days) 3.7681±0.0003
Duration of the transit (hours) 4.72
Depth of the transit (%) 0.44
Determined from RV-measurements
Orbital eccentricity e 0 [fixed]
Argument of periastron ω [deg] 0 [fixed]
Radial velocity semi-amplitude K [ m s−1] 312.4 ± 29.0
Systemic velocity Vγ[ km s−1] 54.770 ± 0.008
O-C residuals [ m s−1] 77
Determined from spectral analysis of the star
Te f f[K] 5740±80
log gstar[cgs] 4.40±0.10
[Fe/H] 0.0±0.1
v sin i [ km s−1] 4.5±0.5
Spectral type G2V
Determined from light curve modelling
a/Rstar 6.23±0.24 b 0.18±0.16 i [deg] 88.34±1.54 k 0.0661±0.0019 u+ 0.65±0.17 u− 0.2 (fixed) Combined results
Stellar mean density ρst[solar] 0.23 ± 0.02
Stellar mass Mst[solar] 1.04 ± 0.10
Stellar radius Rst[solar] 1.59 ± 0.07
Stellar age [Gyrs] 10.7±1.0
Orbital semi-major axis a [AU] 0.0461 ± 0.0008
Planet mass Mp[MJ] 2.43 ± 0.30
Planet radius Rp[RJ] 1.02 ± 0.07
Planet mean density ρp[gcm−3] 2.82 ± 0.38
Mst1/3/Rst[solar units] 0.61 ± 0.03
Teq[K] 1626 ± 31
Distance [pc] 920 ± 50
AV[mag] 2.60± 0.10
In conclusion, the absence of variability in the brighter con-taminating stars as well as the detection of a correct brightness-variation on the target assured that the signal observed by CoRoT really arose from the target.
3.2. Radial velocity measurements and orbit of CoRoT-17b
HARPS is used to establish the planetary nature of CoRoT can-didates and to identify binaries, in coordination with SOPHIE at Observatoire de Haute-Provence and HIRES at the Keck tele-scope (Bouchy, Moutou and Queloz, 2009). For radial veloc-ity measurements of CoRoT-17, we used only HARPS (Mayor et al 2003). RV positions are estimated by cross-correlation of the stellar spectrum with a numerical mask (Baranne et al 1996, Pepe et al 2003). It commonly reaches uncertainties of 1 m/s on bright stars, up to typically 50-100 m/s for a V≃ 15.5 as CoRoT-17.
Between May and August, 2010, CoRoT-17 has been ob-served with HARPS at a spectral resolution of 110,000, together with a simultaneous on-sky reference in fiber B for monitor-ing the sky background. In total, seventeen measurements have
been secured. Some measurements have been acquired when the moon was up, but the velocity difference between the stel-lar spectrum and the barycentric Earth RV is always stel-larger than 22 km/s, so that the stellar cross-correlation function is not sig-nificantly contaminated. Hence, the RV measurements have not been corrected for, even when the sky background is detected. With an exposure time of 1 hour, a typical signal-to-noise ratio of 8 is achieved on this target. The average uncertainty of the derived velocities is 74 m/s (see Table 4).
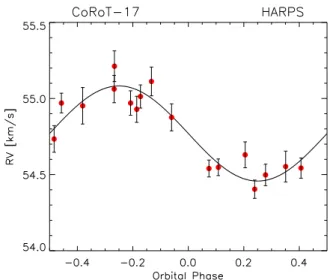
The rms of the RV time series is 244 m/s, indicating a fluctu-ation three times higher than the error bars (Fig. 5). When phased at the CoRoT period and transit ephemeris, a sinusoidal variation is clearly observed (Fig. 6), characterized by a semi-amplitude
K = 312 m/s and systemic velocity V0 =54.8 km/s. The cross-correlation function is narrow (FW H M = 9.6 km/s), typical of a main-sequence slow-rotating star. The estimated projected ve-locity of the star is 5 ± 1 km/s (this value is slightly refined in the next paragraph, using the co-added spectra). The Keplerian solution is shown in Figures 5 and 6, where the orbital eccentric-ity is fixed to 0. Assuming e is a free parameter, a value of 0.08
±0.12 is found. Our current data set does not significantly con-strain the eccentricity. The final rms of the residuals is 77 m/s, a value close to individual error bars; the achieved reduced χ2is 1.25 when period, time, and eccentricity are fixed.
Common tests on the bisector behaviour have been per-formed, as shown in Figure 7. The bisector span is estimated between the wings and the core of the cross-correlation func-tion, and its behaviour as a function of the radial velocities and the residuals to the Keplerian fit are examined.
No trend is found between the bisector span and the velocity, with a correlation coefficient of 7%; this indicates a low proba-bility of a triple system or a diluted binary scenario. A slight trend (correlation of 41%) is observed between the bisector slope and the residuals to the fit. However, as suggested in Figure 7, this bisector behaviour is dominated by the data that have the lowest signal-to-noise ratios. This test shows the limitation of the bisector diagnostics, when the wings of the cross-correlation function are strongly affected by the spectrum continuum, at SNR typically less than ∼5. Because the bisector has no detected variation in phase with the radial-velocity variations, we con-clude that the scenario involving a transiting planetary compan-ion of CoRoT-17 is the only explanatcompan-ion for the observed radial velocity variations.
3.3. Spectral analysis of the host star
As part of the NASA’s key science programme in support of the CoRoT mission, CoRoT-17 was also observed on 2010 June 20 (UT) with the HIRES spectrograph (Vogt et al. 1994) mounted on the Keck I 10 m telescope, at the Keck Observatory (Mauna Kea, Hawai’i). The red cross-disperser along with the 0.′′861 wide slit and 14′′tall decker were employed to properly subtract
the sky background, yielding a resolving power of R ≈ 50 000 and a wavelength coverage 3800 ≤ λ ≤ 7975 Å. Six consecutive spectra of 1200 sec each were acquired to increase the S/N ratio and remove cosmic ray hits. The spectra were extracted and co-added with standard IRAF routines, giving a final S/N ratio of about 65 at 6000 Å.
Following the standard practice already adopted in previous CoRoT discovery papers (e.g., Deleuil et al. 2008; Fridlund et al. 2010; Gandolfi et al. 2010), we used a HIRES co-added spec-trum to derive the fundamental physical parameters of CoRoT-17, i.e., effective temperature (Teff), surface gravity (log g),
Table 4. HARPS radial-velocity measurements of CoRoT-17 hline BJD-24500000. RV σRV BIS (days) [km/s] [km/s] [km/s] 55326.90632 54.548 0.055 0.044 55340.87074 54.929 0.086 -0.054 55342.89312 54.553 0.101 -0.060 55351.86818 55.062 0.090 0.071 55352.64808 54.876 0.089 -0.141 55353.64740 54.630 0.085 0.273 55354.82094 54.734 0.087 0.231 55355.64015 55.212 0.101 0.189 55359.62782 54.970 0.081 -0.026 55372.76478 54.498 0.071 0.051 55387.68993 54.404 0.060 0.103 55396.65855 54.952 0.120 -0.173 55399.62341 54.543 0.067 -0.040 55407.67391 54.970 0.065 0.101 55409.67746 54.540 0.056 0.082 55412.66468 55.112 0.095 0.028 55427.58796 55.013 0.076 0.065
metallicity ([Fe/H]), and projected rotational velocity (v sin i). Some methods consist of comparing the observed spectra with a grid of model atmospheres from Castelli & Kurucz (2004), Coelho et al. (2005) and Gustafsson et al. (2008), using spec-tral lines that are sensitive to the different photospheric param-eters. Other methods rely on the use of spectral analysis pack-ages like SME 2.1 (Valenti & Piskunov 1996; Valenti & Fischer 2005) and VWA (Bruntt et al. 2004, 2008, 2010). We found con-sistent results regardless of the spectrum and procedure. The fi-nal values adopted for the above mentioned physical parameters are Teff= 5740 ± 80 K, log g = 4.40 ± 0.10, [Fe/H] = 0.0 ± 0.1, and v sin i = 4.5 ± 0.5 km/s (Table 2).
Using the M1/3star/Rstar value obtained from the transit light curve modelling, we obtained the mass, radius, and age of the host star via the same procedure we applied in earlier CoRoT planet-detection publications (see e.g. Deleuil et al. 2008). The results are reported in Table 2. Note that the star is quite evolved from the ZAMS, and based on the presently available constraints (effective temperature, metallicity, M1/3star/Rstar parameter), we found the age of the star to be 10.7 ± 1.0 Gyr.
3.4. The spectral energy distribution of the host star
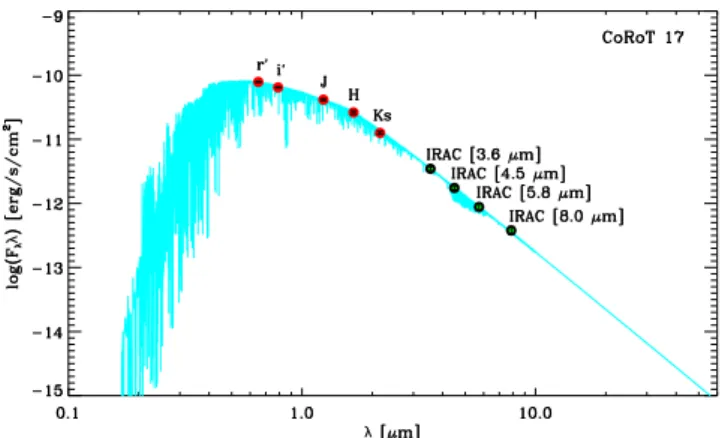
The interstellar extinction (AV) and distance (d) to the star were derived using the r′i′JHK s photometry from the ExoDat
database combined with IRAC@Spitzer 3.6, 4.5, 5.8, and 8.0
µm magnitudes (Table 1). The Spitzer-magnitudes were
ex-tracted by applying aperture photometry on the IRAC image cut-outs centred around CoRoT-17, as retrieved from the IRSA-NASA/IPAC Infrared Science Archive2. Following the method described in Gandolfi et al. (2008), we simultaneously fit-ted the colours ecompassed by the spectral energy distribution (SED, see Figure 8) with synthetic magnitudes derived from the
NextGen stellar atmosphere model (Hauschildt et al. 1999) with
the same Teff, log g, and [Fe/H] as the star. Assuming a nor-mal total-to-selective extinction coefficient ratio RV = 3.1 and a black body emission at the star’s effective temperature and ra-dius, we found AV= 2.60 ± 0.10 mag and d = 920 ± 50 pc. The IRAC 5.8 and 8.0 µm images reveal a patchy nebula spatially projected towards the direction of CoRoT-17. The presence of foreground interstellar medium for such a low galactic latitude
2 http://irsa.ipac.caltech.edu/
Fig. 5. Radial-velocity variations of CoRoT-17 obtained with
HARPS as a function of time. The Keplerian best fit is super-imposed. The bottom plot shows the residuals to this model.
Fig. 6. RV data of CoRoT-17 folded to the ephemeris derived
from CoRoT transits.
star (b ≈ 0.7◦) might account for the derived high extinction value.
4. Discussion
We reported the discovery of a transiting exoplanet around the faint star CoRoT-17, detected by the CoRoT satellite. Extensive radial velocity, spectroscopic and photometric follow-up mea-surements proved that the cause of these transits is a transit-ing exoplanet that orbits the star. The measurements also helped to determine the basic characteristics of this planetary system.
Fig. 7. Variations of the bisector span of CoRoT-17 RV data as
a function of the measured velocities (top) and the residuals to the Keplerian fit (bottom). The first plot shows no correlation, a good indication for the planetary hypothesis as opposed to a blend binary signal. The second plot shows a weak correlation, owing the lowest SNR data of the sample (open points show the data where SNR is less than 5).
The planet has a mass of 2.43 ± 0.30MJup and a radius of 1.02 ± 0.07MJup, while the mean density is 2.82 ± 0.38 g/cm3 (Table 2). The transit is almost central and it has 0.44% depth, but the CoRoT light curve is contaminated by another star, which contributes 8 ± 4% to the total observed flux. The host star is an evolved G2V type star, with mass 1.04 ± 0.10M⊙and radius
1.59±0.07R⊙. The isochrone fit yielded the age of the star, which
is 10.7 ± 1.0 Gyr. This makes the system one of the oldest known systems among the transiting exoplanets.
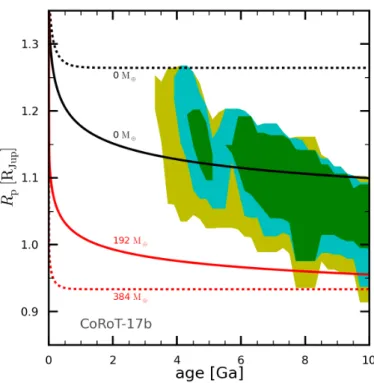
CoRoT-17b is located in a quite common place on the mass – radius diagram of the known transiting exoplanets (see eg. Southworth 2010; Swift et al. 2010). To probe the possible com-position of CoRoT-17b, we computed stellar and planetary evo-lution models using PADOVA (Marigo et al. 2008; Bertelli et al. 2008) and CEPAM (Guillot & Morel 1995), as described in Guillot & Havel (2011). The results are shown in Fig 9 where the evolution of the size of CoRoT-17b is plotted as a func-tion of the system age. The colours indicate the distance in
Fig. 8. Spectral energy distribution of CoRoT-17. Dereddened
r′i′JHK s and IRAC infrared data are represented with filled red
and green dots, respectively. The model spectrum by Hauschildt et al. (1999) with the same temperature, radius, and metallicity as CoRoT-17 are plotted with a light-blue line.
standard deviations from the inferred effective temperature and mean stellar density, i.e., less than 1σ (green), 2σ (blue) and 3σ (yellow). These constraints are compared to planetary evo-lution models for a homogeneous solar-composition hydrogen-planet, with different hypotheses: (plain lines) using a ’standard model’, i.e., whithout additional sources of heat; (dotted lines) by adding a fraction (0.25%) of the incoming stellar energy and dissipating it at the centre. These two cases correspond to stan-dard recipes used to explain the inflated giant exoplanets (Guillot 2008). In this context, it is hard to constrain the mass of heavy el-ements needed to match the observed planetary radius. The core mass can range from 0 (pure H-He planet) to ∼380 earth-masses (∼ 48% of the total mass), depending on the hypothesis we con-sider. However, this diagram is not sensitive for the properties of CoRoT-17b, because - depending on the assumptions - we can easily construct models with 192 and 384 Mearth of heavy elements inside the planet, too, which are practically undistin-guishable at the age of the system, because at very late stages of planetary evolution these two evolutionary tracks are closer to each other than the uncertainty in the planetary radius.
Similarly to other known old planetary systems (e.g. HAT-P-21, 10.2 ± 2.5 Gyr, and HAT-P-22, 12.4 ± 2.6Gyr, see Bakos et al. (2010)), CoRoT-17 has an age that is inferred to be 10.7 ± 1.0 Gyr. Its present bolometric luminosity is about 2.47L⊙, implying
that as the star is evolving, the planet is receiving more energy. With an equilibrium temperature of ∼1600K, the planet still ap-pears to be safe in terms of evaporation, however, and any pos-sible increase of its radius should remain very limited.
A star with ∼ 1.0M⊙ spends approximately 10-11 Gyr on
the main sequence. Stellar evolution studies predict that a star similar to CoRoT-17 reaches its present radius at ∼ 90% of its main-sequence lifetime (Hurley et al. 2000), depending on its metallicity and on its exact mass. The present orbital radius of the planet is 9.95R⊙, whereas we expect the star in its giant phase
to reach well over 150R⊙. Even if the star looses mass owing to
winds, the engulfment of the planet seems inevitable (see e.g. Rasio et al. 1996).
Acknowledgements. The team at IAC acknowledges support by grant
ESP2007-65480-C02-02 of the Spanish Ministerio de Ciencia e Innovaci´on. This research has made use of the ExoDat database, operated at LAM-OAMP, Marseille, France, on behalf of the CoRoT/Exoplanet program. This publication makes use of data products from the Two Micron All Sky Survey, which is a joint project of the University of Massachusetts and the Infrared Processing and Analysis Center/California Institute of Technology, funded by the National Aeronautics
Fig. 9. Evolution of the size of CoRoT-17b (radius in Jupiter
units) as a function of age (in billion years), compared to con-straints inferred from CoRoT photometry, spectroscopy, radial velocimetry, and the PADOVA stellar isochrones. Green, blue, and yellow-green plain regions correspond to the planetary radii and ages that result from stellar evolution models that match the inferred ρstar - Te f f uncertainty ellipse within 1, 2, and 3σ, re-spectively. Planetary evolution models for a planet with a solar-composition envelope and no dissipation are shown as plain lines and labelled according to the value of the core mass (in earth masses); models in which 0.25% of the incoming flux is de-posited at the planet’s centre are shown as dotted lines. Models with no core are shown in black, and with a core in red. These models assume a total mass of 2.43MJupand an equilibrium tem-perature of 1626 K.
and Space Administration and the National Science Foundation. This research has made use of NASA’s Astrophysics Data System. TRAPPIST is a project funded by the Belgian Fund for Scientific Research (Fond National de la Recherche Scientifique, FNRS) under the grant FRFC 2.5.594.09.F, with the par-ticipation of the Swiss National Science Fundation (SNF). M. Gillon and E. Jehin are FNRS Research Associates. M. Endl, W.D. Cochran and P.J. MacQueen were supported by NASA Origins of Solar Systems grant NNX09AB30G. The German CoRoT Team (TLS and the University of Cologne) acknowledges DLR grants 50 OW 204, 50 OW 0603 and 50QP07011.
References
Auvergne, M., Bodin, P., Boisnard, L., et al. 2009, A&A 506, 411
Bakos, G. ´A., Hartman, J., Torres, G., Latham, D. W., Kov´acs, G. et al. arXiv:1008.3388
Baglin, A., Auvergne, M., Barge, P., et al. 2007, in American Institute of Physics Conference Series, 895, ed. C. Dumitrache, N. A. Popescu, M. D. Suran, & V. Mioc, 201
Baranne, A., Queloz, D., Mayor, M., et al. 1996, A&AS 119, 373 Batten, A. H. 2005, Ap&SS 296, 3
Baudin, F., Jorda, L., Samadi, R., Michel, E. 2008, ”N2 data: description”, avail-able at: http://idoc-corotn2-public.ias.u-psud.fr/jsp/CorotHelp.jsp
Bertelli, G., Girardi, L., Marigo, P. Nasi, E. A&A484, 815
Boisnard, L., Baglin, A., Auvergne, M., Deleuil, M., Catala, C. 2006, in ESA SP, 1306, 465
Bord´e, P., Bouchy, F., Deleuil, M., Cabrera, J., Jorda, L. et al. 2010, A&A 520, A66
Bouchy, F., Moutou, C., Queloz, D. and the CoRoT Exoplanet Science Team 2009, IAUS 253, 129
Brown, T. M., Charbonneau, D., Gilliland, R. L., Noyes, R. W., Burrows, A. 2001, ApJ 552, 699
Bruntt, H., Bikmaev, I. F., Catala, C., et al. 2004, A&A, 425, 683 Bruntt, H., De Cat, P. & Aerts, C. 2008, A&A, 478, 487 Bruntt, H., Deleuil, M., Fridlund M. et al. 2010, A&A519, 51 Castelli, F. & Kurucz, R.L. 2004, eprint arXiv:astro-ph/0405087 Coelho, P., Barbuy, B., Mel´endez, J., et al. 2005, A&A443, 735 Deeg, H. J., Gillon, M., Shporer, A. et al. 2009, A&A506, 343
Deleuil, M., Deeg, H. J., Alonso, R., Bouchy, F., Rouan, D. et al. 2008, A&A 491, 889
Deleuil, M., Meunier, J. C., Moutou, C., et al. 2009, AJ, 138, 649 Erikson et al. 2011, in prep.
Fridlund, M., H´ebrard, G., Alonso, R., Deleuil, M., Gandolfi, D. et al. 2010, A&A 512, A14
Gandolfi, D. et al. 2008, ApJ687, 1303
Gandolfi, D., H´ebrard, G., Alonso, R., Deleuil, M., Guenther, E. W. et al. 2010, A&A524, A55
Geem, Z. W., Kim, J. H., Lonatathan, G. V. 2001, Simulation, 76, 60
Gillon, M., Jehin, E., Magain. P., Chantry, V., Hutsemkers, D., Manfroid, J., Queloz, D., Udry, S. 2011, ’TRAPPIST: a robotic telescope dedicated to the study of planetary systems’, in: Detection and Dynamics of Transiting Exoplanets, Proceedings of Haute-Provence Observatory Colloquium (23-27 August 2010), Edited by F. Bouchy, R.F. D´ıaz & C. Moutou
Guillot, T. 2008, PhST 130, 4023 Guillot, T., Morel, P. 1995, A&AS 109, 109 Guillot, T., Havel, M. 2011, A&A527, 20
Gustafsson, B., Edvardsson, B., Eriksson, K., et al. 2008, A&A, 486, 951 Hauschildt, P. H., Allard, F., Baron, E. 1999, ApJ512, 377
Hurley, J. R., Pols, O. R., Tout, Ch., A. 2000, MNRAS 315, 543 Mandel, K., Agol, E. 2002, ApJ 580, L171
Mayor, M., Pepe, F., Queloz, D., Bouchy, F., Rupprecht et al. 2003, Msngr 114, 20
Marigo, P., Girardi, L. Bressan, A., Groenewegen, M. A. T., Silva, L. Granato, G. L. A&A482, 883
Pepe, F., Rupprecht, G., Avila, G. et al. 2003, SPIE 4841, 1045
Quentin, C. G., Barge, P., Cautain, R., Meunier, J.-C., Moutou, C., Savalle, R., Surace, C. 2006, ESASP 1306, 409
Rasio, F. A., Tout, C. A., Lubow, S. H., Livio, M. 1996 ApJ470, 1187 Roberts, A. 1899, ApJ 10, 308
Russell, H. M. 1932, Annual report of the Smithonian Institute 1931 Sing, D. K. 2010, A&A510, 21
Southworth, J. 2010, MNRAS408, 1689
Surace, C., Alonso, R., Barge, P. et al. 2008, in SPIE Conf. Ser., 7019 Swift, D. Eggert, J., Hicks, D. Hamel, S. Caspersen, K., Schwegler, E., Collins,
G., Ackland G. 2010, arXiv:1001.4851
Valenti, J. A. & Piskunov, N., 1996, A&AS, 118, 595 Valenti, J. A. & Fischer, D. A., 2005, ApJS, 159, 141
Vogt, S. S., Allen, S. L., Bigelow, B. C. et al. 1994, SPIE 2198, 362 Winn, J. N. 2010, ’Transits and Occultations’, arXiv.org:1001.2010
1 Institute of Planetary Research, German Aerospace Center, Rutherfordstrasse 2, 12489 Berlin, Germany
2 Laboratoire d’Astrophysique de Marseille, 38 rue Fr´ed´eric Joliot-Curie, 13388 Marseille cedex 13, France
3 LUTH, Observatoire de Paris, UMR 8102 CNRS, Universit´e Paris Diderot; 5 place Jules Janssen, 92195 Meudon, France
4 Research and Scientific Support Department, ESTEC/ESA, PO Box 299, 2200 AG Noordwijk, The Netherlands
5 Department of Physics, Denys Wilkinson Building Keble Road, Oxford, OX1 3RH, UK
6 Observatoire de l’Universit´e de Gen`eve, 51 chemin des Maillettes, 1290 Sauverny, Switzerland
7 LESIA, UMR 8109 CNRS, Observatoire de Paris, UPMC,
Universit´e Paris-Diderot, 5 place J. Janssen, 92195 Meudon, France 8 Institut d’Astrophysique Spatiale, Universit´e Paris XI, F-91405
Orsay, France
9 McDonald Observatory, University of Texas at Austin, Austin, 78712 TX, USA
10 Instituto de Astrof´ısica de Canarias, E-38205 La Laguna, Tenerife, Spain
11 Universidad de La Laguna, Dept. de Astrof´ısica, 38200 La
Laguna,Tenerife, Spain
12 Observatoire de Haute Provence, 04670 Saint Michel
l’Observatoire, France
13 Institut d’Astrophysique de Paris, UMR 7095 CNRS, Universit´e Pierre & Marie Curie, 98bis boulevard Arago, 75014 Paris, France 14 Rheinisches Institut f¨ur Umweltforschung an der Universit¨at zu
K¨oln, Aachener Strasse 209, 50931, Germany
15 University of Vienna, Institute of Astronomy, T¨urkenschanzstr. 17, A-1180 Vienna, Austria
16 IAG-Universidade de Sao Paulo, Brasil
17 Universit´e de Nice-Sophia Antipolis, CNRS UMR 6202,
Observatoire de la Cˆote d’Azur, BP 4229, 06304 Nice Cedex 4, France
18 University of Li`ege, All´ee du 6 aoˆut 17, Sart Tilman, Li`ege 1, Belgium
19 Th¨uringer Landessternwarte, Sternwarte 5, Tautenburg 5, D-07778 Tautenburg, Germany
20 Space Research Institute, Austrian Academy of Science,
Schmiedlstr. 6, A-8042 Graz, Austria
21 School of Physics and Astronomy, Raymond and Beverly Sackler Faculty of Exact Sciences, Tel Aviv University, Tel Aviv, Israel 22 Center for Astronomy and Astrophysics, TU Berlin, Hardenbergstr.