1. Introduction
In our region carbon dioxide is the main solvent of calcium carbonate. Of course, it is in water that CO2 dissolves CaCO3. But as there is, according to Henry’s law, a trend to an equilibrium between the liquid phase and the gaseous one, we decided to investigate both phases. Eventually, this became of more general interest when the rise of CO2 in the air became of general concern. Carbon dioxide is much more abundant and more variable in caves than in open air, hence the interest of its study.
A question of prime importance is of course the origin of cave air carbon dioxide. Latte (2010) has recently computed the carbon weight (in metric megatons) of the forests of the whole Walloon Region. He showed that 41% of the carbon weight of the Walloon forests is in the wood (living and dead), whereas 59% is in the soil, including the humus.
This shows the primordial importance of soil in the carbon cycle.
2. Carbon dioxide in cave air
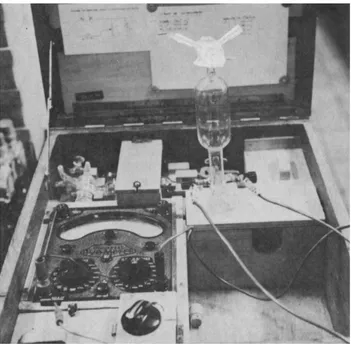
2.1. Technical proceduresOur investigations span more than forty years, and our methods and techniques necessarily evolved. Our first technique of analysis was an electrolytic titration of a known volume of air absorbed in a NaCl solution, colored beforehand by phenolphtalein. The electrolysis of the solution produced NaOH, which neutralized the absorbed CO2. The current was kept constant and one measured the time necessary to neutralize the CO2 and turn the phenolphtalein red. The carbon dioxide content of the sample was computed from the air-sample volume (ml), the current intensity (mA) and the time (s). The apparatus, weighing 15 kg, was a little cumbersome in caves (Fig. 1) (Koepf, 1952; Ek et al., 1968; Delecour et al., 1968).
In the eighties, we also began using the Scantec pump, lighter and quicker (Fig. 2). The air is inhaled by the pump through a graduated cell containing hydrazine; after two minutes, a simple and direct reading of the graduation indicates the carbon dioxide
content of the aspired air. This method is slightly less accurate than the first one; the error on low contents (below 600 ppm) can be as high as 20%. The relative error decreases as values increase.
In 2008, we started using a Draeger X-am 7000 infrared CO2 meter. This device is more practical; it provides an instantaneous reading on a LCD screen (Fig. 3). We used it intensively in Ramioul cave, where CO2 fluctuations are particularly erratic (Godissart & Ek, 2011). With this device, there is no gain in accuracy, but in speed. The error can be 100 ppm at all points on the scale.
Every time we had a new instrument at our disposal, we checked the new and old devices in several caves and under GEOLOGICA BELGICA (2014) 17/1: 102-106
Carbon dioxide in cave air and soil air in some karstic areas of Belgium.
A prospective view
Camille eK1 & Jean GODiSSaRT2
1Université de Liège, Département de Géologie, E-mail: camille.ek@ulg.ac.be 2Union belge de Spéléologie, E-mail: jean.godissart@skynet.be
ABSTRACT. Caves are privileged observatories of underground air and its carbon dioxide content. The carbon dioxide partial pressure
in Belgian caves displays seasonal fluctuations with strong summer maxima. Besides, CO2 concentration has risen very significantly in Belgian caves since our first measurements in the nineteen sixties. To understand the cause of this rise, we have been measuring the air in the soil above the Comblain-au-Pont cave since 2008, with a device developed by Jean Godissart. These measurements show clear seasonal variations, the maximum occurring in early summer, well before the maximum in the caves. This confirms the influence of vegetation as a source of carbon dioxide in the caves. It is well known that atmospheric CO2 concentration and temperature are two factors influencing the growth of vegetation. And the stock of vegetation is indeed increasing in Belgium, where the volume of wood in tree trunks in the Walloon Region forests rose about 30% in the thirty years from 1984 to 2005. The increase in vegetation is of course correlative with the soil biological activity. We firmly believe that this explains a large part of the CO2 rise in cave air.
KEYWORDS. Karst, carbon dioxide, cave, soil, Belgium
RÉSUMÉ. Les grottes sont un observatoire privilégié de l’air souterrain et de son dioxyde de carbone. Ce gaz présente sous terre de
fortes fluctuations saisonnières de pression partielle, avec un maximum estival marqué. La pression partielle d’été a fortement augmenté depuis le début de nos mesures (1966). Pour comprendre l’origine de cette augmentation, nous mesurons, depuis 2008, l’air du sol au-dessus de la grotte de Comblain-au-Pont, avec un appareil mis au point par Jean Godissart. Les variations saisonnières se présentent aussi dans le sol. Il semble que du CO2 soit aussi produit sous les horizons pédologiques, et non seulement dedans. L’augmentation du dioxyde de carbone et la hausse des températures moyennes sont évidemment favorables à la végétation. Par ailleurs, on notera aussi qu’en Belgique, le volume de bois, dans les forêts, est en augmentation constante : plus de 30% en trente ans. Le développement de la végétation est évidemment corrélatif de l’activité biologique. Nous pensons que ces faits contribuent de façon importante à expliquer l’augmentation de la teneur en CO2 de l’air des grottes.
MOTS-CLÉS. Karst, dioxyde de carbone, grotte, sol, Belgique
Figure 1. Electrolytic field device for measuring CO2 concentrations in air, by Koepf (Ek et al., 1968). We began using it in 1966.
different conditions, so we can ascertain that the change of material is not the cause of a systematic error.
2.2. Results and discussion
We have shown in previous papers that there is generally more carbon dioxide in the fissures than in the galleries or halls, that there is frequently a difference between the bottom and the upper part of large chambers (Ek et al., 1968). The fact that concentrations are higher in fissures than in the centre of passages was recently confirmed by Baldini et al. (2006). We observed seasonal fluctuations in Belgium (Ek & Gewelt, 1985; Ek, 1990; Ek & Godissart, 2007) (Fig. 4). We noted much lower values under very cold conditions (Ek et al., 1969). The summer maximum in the caves appears later in the deepest passages than in shallow conduits, as if carbon dioxide was slowly descending from the soil to the deep (Fig 5).
After about forty years of measurement, we noticed that values had strongly increased between 1966 and today (Ek & Godissart, 2009) (Figs 6 and 7). Between 1966 and 1968, we only took 75 samples, but found no value above 6000 ppm. Today, we commonly observe contents above 20,000 ppm in summer. Our first measurements certainly were too few in number because of the time needed for each analysis. But today, in the same caves and in the same season as before, we get much higher readings. Carbon dioxide content of cave air is much higher than in free atmosphere and very variable from place to place. Moreover, it varies according to the seasons. All that requires a study of its origin, and we decided thus to investigate the soils above the
caves. As the observed values had risen strongly since our first measurements, we need to know the CO2 dynamics in the soil and between the soil and the caves. It is at Comblain-au-Pont (province of Liège, Belgium) that we carry on these investigations. Figure 2. Scantec pump giving a direct reading of CO2 concentration (Ek
& Gewelt, 1985). Much easier procedure than the first one.
Figure 3. X-am 7000 by Draeger, infrared portable gas analyzer. Used in
our current surveys since 2008.
Figure 4. Air CO2 concentration (in ppm) of La Merveilleuse Cave at Dinant (Belgium) in winter (above) and in summer (below) showing high seasonal variation.
Figure 5. Seasonal evolution of the CO2 content of the air in three passages of Sainte-Anne Cave at Esneux (Belgium). Lower line (solid): 8 m below the surface; intermediate line (dash-dot): 16 m below the surface; two upper lines, 70 m below the surface: (solid line) in the bulk of the gallery; (dash-dot-dot) just above the underground river. The maximum appears in July in the shallow passages and in September in the deep cave underneath.
104 Camille eK & Jean GODiSSaRT
3. Carbon dioxide in soil air
3.1. Technical procedureTo know the carbon dioxide content of soil air, we use an empty perforated polythene tank buried in the soil close to the bedrock at a depth of about 50 cm. A rubber tube comes out of the box and emerges from the soil (Fig. 8). The tube is fitted with a tap. To measure the CO2 partial pressure in the tank, we replace the tap by a pump extracting the air and sending it to the CO2 analyser Draeger X-am 7000. This device has been working in the wood above Comblain-au-Pont cave since 2008.
3.2. Results and discussion
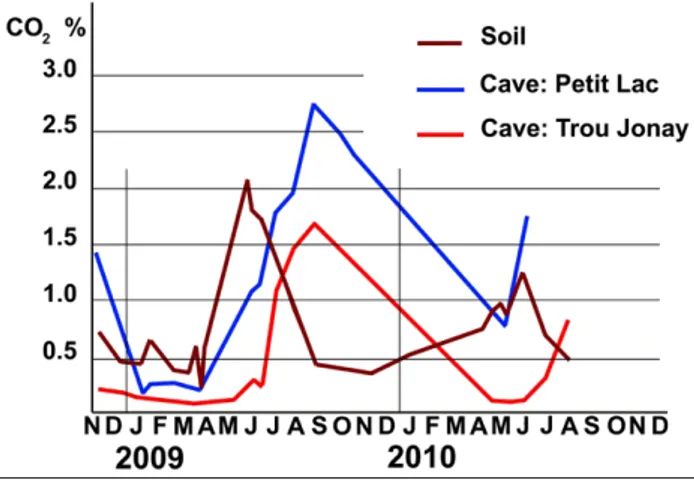
The graph (Fig. 9) displays the variations from November 2008 to August 2010 of the pCO2 in the forest soil above the caves (brown curve), at the far end of the Comblain-au-Pont cave (blue curve) and at the bottom of the Trou Jonay, a little cave close to the first one (red curve). The soil graph shows a sharp peak at the end of May and the maximum concentration of CO2 in both caves occurs at the end of August. This phase shift between CO2 waves occurred similarly in the year 2010 but the CO2 peak in the soil was fainter, probably due to different weather conditions. What is clear, however, is that the maximum CO2 content in the soil was in 2009, 2010 and 2011 lower than the maximum values in the main cave, at Petit Lac (Fig. 9). The same situation is found in all our measurements of CO2 content of the soil: the maximum value occurs in the soil before to appear in the caves, but the maximum partial pressure in the soil is often fainter than in large caves. As far back as 1977 Atkinson provided a clear hypothesis explaining this. Noting that pCO2 increases with depth and that ground air, i.e. the air of the voids underlying the soil horizons, is richer than soil air, he suggested that there is a source of carbon dioxide in the decay of organic matter in the joints of the
unsaturated zone. In these voids, air and water can favour the decay of small, often microscopic debris.
We also observed that the air of the fissures is generally richer in CO2 than in the bulk of the passageways and halls. This reinforces Atkinson’s hypothesis.
This idea was recently confirmed by Mattey et al. (2008; 2010). These authors (including Atkinson) consider that sources of CO2-rich ground air include “CO2 degassed from groundwater, CO2 from the soil zone that has penetrated the epikarst as a gas phase, CO2 from plants roots respiration and CO2 generated from decomposition of colloidal or dissolved organic matter in infiltrating water”. We think we must thus consider that this ground air is also a source of CO2 in the caves. This idea is also supported by Groves et al. (2012).
Figure 6. Fontaine de Rivîre
Cave, at Hamoir (Belgium). CO2 content of the air in 1970, 1992, 2000 and 2008 (Ek & Godissart, 2009). A steady, significant increase.
Figure 7. CO2 measurements at La Merveilleuse Cave at Dinant (Belgium), in 1990, 2003 and 2008 (Ek & Godissart, 2009). Cross-section of the cave, showing an overall increase of CO2 concentration in time. The abnormally high values above two shafts in 2003 is unexplained.
Figure 8. Device for soil air sampling, buried in the soil. A pitted
4. The increase of vegetation
Carbon dioxide reaches its maximum yearly value in the soil before the maximum in the caves. This indicates that cave air CO2 could come from the soil, and thus from the roots and the biomass. The temperature rise of the last decades induces an increase of the turn-over of organic matter. Hence a possible rise of the soil CO2. In the soil, our measurements are too few in number and too recent (only beginning in 2008), to show any increase. But agronomists and forest engineers have clear arguments to assert an important increase of the natural vegetation recently.
In Belgium, during the last decade, a considerable number of studies has been devoted to the current evolution of the forest, its surface, its volume of wood (Rondeux et al., 2005). We will not do an exhaustive review of that matter, but we must cite some benchmarks and their main results. Latte (2010) has computed the carbon weight of the forests of the whole Walloon Region. He shows that more than a half of the carbon in a forest is indeed in the soil and the litter, whereas a little bit less is in the trees and other plants (living and dead biomass). A further research, hitherto unpublished, submitted for publication by Latte et al., is bringing more precision in the figures, showing also that the carbon stock of the Walloon forests is clearly higher now than in 1960 (oral communication by Hébert, March 2012).
In Belgium, the volume of wood, in the forests, is increasing. The total volume of the tree trunks, in the Walloon Region, rose about 30 % since 1984 (Laurent & Lecomte, 2008). The rise of the productivity of many forests is noteworthy in many European regions. Heyninck & Jonard (2009) quote a growth acceleration of 25% in West France and 50 % in North-East France between 1900 and 2000. In Europe, Chmielewski & Rötzer (2001) have shown that, in thirty years, between 1969 and 1998, the spring warming up caused an eight day advance in the development of leaves. Menzel et al. (2006) reach the same conclusion for twenty-one European countries : using an enormous systematic data set of more than 125 000 series of 542 plants and 19 animal species, they observe an average spring advance of 2,5 days per decade. The advance of spring matches the measured warming in 19 European countries. There is thus an important strengthening of vegetation. As a consequence, the soil activity as well as the soil CO2 content due to the respiration and decomposition of plants both rise. This increase therefore is a plausible explanation for the observed CO2 rise in cave air. In pasture and cultivation areas, the replacement of animal manure by chemical fertilizers reduces the humus, releasing carbon.
5. Conclusions
Carbon dioxide shows important seasonal variations in caves, with important maximum values at the end of summer. There
are also considerable differences between underground sites: halls, pits, fissures, etc. The CO2 content of the underground air is very variable, but very generally much higher than in the open atmosphere.
We have shown (Ek & Godissart, 2009) that in most places carbon dioxide is rising in cave air. We think that it could be due to the slight rise of the air temperature in our temperate climate and to the slight increase of the carbon dioxide content of the open air : these two parameters favour vegetation activity, and thus the respiration of plants and of all the soil biomass. This enhances CO2 production in the soil.
Our first measurements in the soil show that the maximum is reached in the soil before the caves. This confirms that carbon dioxide diffuses from the soil to the underground cavities.
The contents observed in the soil - until now - are fainter than in the caves. There should be an additional source of CO2. We observe higher CO2 values in the fissures of the cave roofs than in the middle of halls and galleries (Ek et al, 1968; Ek, 1969). In agreement with Atkinson (1977) and Mattey et al (2010), we think that ground air is another carbon dioxide provider to the caves. However, underground streams can also be CO2-vectors when entering caves.
Prospects
Until now, we have measured the CO2 content of cave air when we were in situ. The figures were reached only when we were in the field. Thanks to a recent grant of the Walloon Public Service, we will now use two - and later on four - dataloggers. This will allow a much finer and accurate report of the fluctuations and will be a step to a better understanding of the question.
6. Acknowledgements
We are indebted to Jacques Rondeux, Jacques Hébert and Tim Atkinson for generously giving information and sending documentation. We are grateful also to Jean-Marie Bouquegneau who kindly supplied us with two X-am 7000 Draeger gas analyzers. Hearty thanks to Julien Goijen, Nicolas Klingler, Barnabé Ek and to the whole team of “Découverte de Comblain a.s.b.l.” for their assistance in field work. We are deeply grateful to Peter Blackie for his precious help in the improvement of the English text. Warm thanks also to Philippe Labarbe who helped us with the illustration : graphs and photographs and to Marie-Claire Cellier for typing our manuscript and preparing its layout. We gratefully thank Baudouin Lismonde and Sophie Verheyden for reviewing this paper. Study carried on under a convention between the Walloon Region and the University of Liège. Origin of data: Service public de Wallonie, D.G.A.R.N.E.
7. References
Atkinson, T.C., 1977. Carbon dioxide in the atmosphere of the unsaturated zone: An important control of groundwater hardness in limestones. Journal of Hydrology, 35 (1-2), 111-123.
Baldini, J., Baldini, L., McDermott; F. & Clipson, N., 2006. Carbon dioxide sources, sinks, and spatial variability in shallow temperate zone caves : Evidence from Ballynamintra Cave, Ireland. Journal of Cave and Karst Studies, 68 (1), 4-11.
Chmielewski, F. M. & Rötzer, T., 2001. Response of tree phenology to climate change across Europe. Agricultural and Forest Meteorology, 108, 101-112.
Delecour, F., Weissen, F. &. Ek C., 1968. An electrolytic field device for the titration of CO2 in air. National Speleological Society Bulletin, 30, 131-136.
Ek C., Delecour, F. & Weissen, F., 1968. Teneur en CO2, de l’air de quelques grottes belges, Technique employée et premiers résultats. Annales de Spéléologie, 23, 243-257.
Ek, C., 1969. Abondance du gaz carbonique dans des fissures de grottes. V. Internationaler Kongress für Speläologie, Stuttgart, 2 (14), 1-3. Ek, C., 1990. La Merveilleuse, nouvelle grotte de Dinant. Liège,
Imprimerie Lesire, 64p.
Ek C., Gilewska, S., Kaszowski, L., Kobylecki, A., Oleksynowa, K. &. Oleksynowna, B., 1969. Some analyses of the CO2 content of the air in five Polish caves. Zeitschrift für Geomorphologie, Neue Folge, 13, 267-286.
Figure 9. Air CO2 in the area of Comblain-au-Pont Cave (Belgium). Brown line: CO2 content of the soil air above the cave. Blue line: CO2 content of the cave air at the far end of the cave itself. Red line: CO2 content of the air in a small and shallow cave – Trou Jonay - between the soil and Comblain-au-Pont Cave. The maximum value in the soil is in May and in August in the caves, but is higher in the deepest cave than in the soil.
106 Camille eK & Jean GODiSSaRT Ek, C. & Gewelt, M., 1985. Carbon dioxide in cave atmospheres. New
results in Belgium and comparison with some other countries. Earth Surface Processes and Landforms, 10 : 173-187.
Ek, C. & Godissart, J., 2007. La grotte et l’abîme de Comblain-au-Pont. Découverte géologique de Comblain-au-Pont et environs, 88 p. Ek, C. & Godissart, J., 2009. Extreme increase of CO2 in Belgian caves.
In Proceedings of the 15th International Congress of Speleology, Kerrville, Texas, pp. 1467-1473.
Godissart, J. & Ek, C., 2011. L’atmosphère de la grotte de Ramioul, Bulletin des Chercheurs de la Wallonie, hors-série n° 3, 45-66. Groves, C., Vanderhoff, S., Polk, J., Miller, B., Lerch, R. & Bolster, C.,
2012. Agricultural Impacts on Karst Systems and Influence of the Epikarstic Zone, South Central Kentucky USA.
Heyninck C. & Jonard, M., 2009. Des hêtraies qui poussent plus vite. Forêt wallonne, 103, 7p.
Koepf, H., 1952., Laufende Messung der Bodenatmung im Freiland, Landwirtschaftliche Forschung, 4, 186-194.
Latte, N., 2010. Vers un bilan “carbone” de la forêt wallonne. Les inventaires forestiers nationaux. Journée d’études du 12 mai 2010. Gembloux, Agro-Bio Tech, pp. 13-14.
Laurent, C. & Lecomte, H., 2008. La composition, l’évolution et l’exploitation de la forêt. État de l’environnement wallon. Rapport analytique 2006-2007. Service public de Wallonie, pp. 184-195. Mattey, D., Lowvry, D., Duffet, J., Fischer, R., Hodge, E. & Erisia, S.,
2008. A 53 year seasonally resolved oxygen and carbon isotope record from a modern Gibraltar speleothem : Reconstructed drip water and relationship to local precipitation. Sciences Direct. Earth and Planetary Science Letters : 269, 80-95.
Mattey, D., Fairchild, I., Atkinson, T., Latin, J.-P., Ainsworth, M. & Durell, R., 2010. Seasonal microclimate control of calcite fabrics, stable Isotopes and trace elements in modern speleothem from St Michaels Cave, Gibraltar. Geological Society, London, Special Publications 2010; 336, 323-344.
Menzel, A., et al., 2006. European phenological response to climate change matches the warning pattern. Global Change Biology, 12, 1969-1976.
Rondeux, J., Hébert, J., Bourland, N., Puissant, T., Burnay, F. & Lecomte, H., 2005. Production ligneuse de la forêt wallonne, l’apport de l’inventaire permanent régional. Forêt wallonne, 79, 3-18. http://hdl. handle.net/2268/26097.
Manuscript received 03.07.2012, accepted in revised form 05/07/2013, available on line 20.12.2012.