Journal of Agricultural Science and Technology A 2 (2012) 1386-1399 Earlier title: Journal of Agricultural Science and Technology, ISSN 1939-1250
Typology of the Main Fungal Diseases Affecting Winter
Wheat in the Grand Duchy of Luxembourg
Moussa El Jarroudi1, Louis Kouadio1, Philippe Delfosse2, Frédéric Giraud3, Jürgen Junk2, Lucien Hoffmann2, Henri Maraite4 and Bernard Tychon1
1. Department of Environmental Sciences and Management, University of Liege, Arlon Campus Environnement, 185 Avenue de Longwy, Arlon 6700, Belgium
2. Environment and Agro-biotechnologies Department, Centre de Recherche Public-Gabriel Lippmann, 41 Rue du Brill, Belvaux 4422, Luxembourg
3. BIORIZON-STAPHYT, site Montesquieu, Rue Magendie, Bordeaux Martillac 33650, France
4. Earth and Life Institute, Université catholique de Louvain, Croix du Sud 2/3, Louvain-la-Neuve 1348, Belgium
Received: September 21, 2012 / Published: December 20, 2012.
Abstract: Over the 2003-2009 period, field campaigns were carried out in order to identify the main fungal diseases of winter wheat
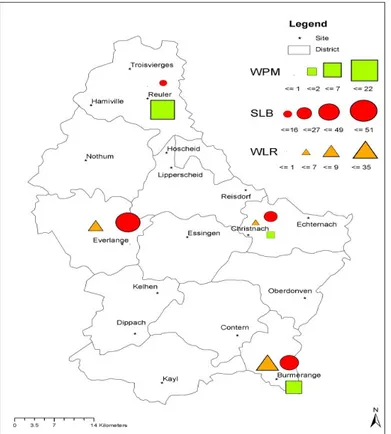
(Triticum aestivum) in the Grand-Duchy of Luxembourg. Four fungal diseases (septoria leaf blotch (SLB), wheat leaf rust (WLR), wheat powdery mildew (WPM) and fusarium head blight (FHB)) were observed and a regional-based typology was established according to their severity and prevalence. In the Gutland (South), SLB severity was strong (about 51% on average) and higher than the severity (about 16%) prevailing in the Oesling (North). Similar typology was observed with the WLR: high severity in the Gutland (66% and 57% for the years 2003 and 2007, respectively) and low severity (< 1%) in the Oesling. The FHB was also present in the Eastern part of the Gutland, with a prevalence and severity significantly higher (P = 0.049 and P = 0.012, respectively, Tukey’s test) compared with their values in the Oesling. On the other hand, the WPM severity was high in the Oesling (15% to 40%) while less than 1% in the Gutland. Such a study is important for the spatial mapping of wheat fungal diseases risk based on agroclimatic parameters and for defining optimal frequencies and dates of chemical treatments.
Key words: Winter wheat, septoria leaf blotch, wheat leaf rust, fusarium head blight, powdery mildew, disease severity mapping.
1. Introduction
In the Grand-Duchy of Luxembourg (GDL), winter wheat (Triticum aestivum) is the most important cereal crop (12,969 ha, 46% of total cereal cropped area) with an annual production of 86,040 tons in 2009 [1]. Despite the diversity of wheat cultivars, this cereal is prone to several fungal diseases. Yield losses caused by fungal diseases in wheat may be important: i.e., the impact of Septoria leaf blotch on yield was reported to range from 30% to 50% if left uncontrolled [2-4]. The amount of disease, generally referred to disease
Corresponding author: Moussa El Jarroudi, Ph.D., research
fields: environmental sciences, phytopathology, crop modeling. E-mail: meljarroudi@ulg.ac.be.
intensity [5], is commonly assessed either on the disease presence, as disease incidence or prevalence, or on symptoms occurrence, as disease severity, respectively. Disease severity implies that the host is infected and refers to the proportion of specific parts of plant area that is damaged [6]. Many diseases occur, at least initially, in discrete foci within a healthy crop. This is due to three factors either alone or in combination: uneven survival of founding disease propagules, uneven arrival of propagules from elsewhere, or the patchy distribution of favorable microclimates within the field [7]. Moreover, the effects of a given level of disease on plant growth and yield and the importance of that disease level in
D
relation to the progress of an epidemic will vary at different plant growth stages [8]. Good decisions in disease management at regional scale are more likely if their spatial patterns and relative importance can be identified. Crop protection often relies on preventive fungicide applications, and small grain cereals are systemically sprayed with two or three foliar treatments in the GDL. However, environmental concerns and changes in the cost/revenue ratio for winter wheat increase the demand for more accurate identification of spraying needs. Integrated pest management requires, therefore, that pesticides only are applied at particular infection stages, and when the pathogen has been correctly identified.
Considering the importance of winter wheat as a cereal in the Luxembourgish agricultural productions systems and the many fungal diseases that can affect its yield, systematic annual surveys of diseases in winter wheat fields were conducted during the years 2003-2009. Four main fungal diseases, causing considerable yield and quality losses, were recorded at different sites covering a wide range of topoclimatological areas in the GDL: septoria leaf blotch (SLB) caused by Septoria tritici Rob. ex Desm. (teleomorph: Mycosphaerella graminicola (Fuckel) Schroeter), wheat leaf rust (WLR) caused by Puccinia
triticina Eriks, wheat powdery mildew (WPM) caused
by Blumeria graminis DC. f. sp. tritici Em. Marchal, and fusarium head blight (FHB) mainly caused by
Fusarium graminearum. FHB has received much
attention in recent years as Fusarium infection leads to mycotoxin contamination of the grain and therefore the entire cereal food and feed chain result in grains unusable for further production into bakery products, breakfast cereals, pasta [9-11].
The aims of this paper are: (1) to describe and compare patterns of these four main fungal diseases affecting the winter wheat crops between the North and the South of the GDL during this 7-year period, and (2) to explain their distribution in relation to the microclimate of each region.
2. Materials and Methods
2.1 Crop Agronomy
The monitoring of SLB, WLR and WPM was carried out in field experiments in four sites of the GDL, selected to be representative of four major cereal growing areas of the two topoclimatological zones (North and South) during seven growing seasons from 2003 to 2009 (Fig. 1). Crop management data for these experiments are given in Table 1. Experimental fields were typically sown around mid-October. Sowing and harvest methods, as well as crop practices, were representative of usual wheat production in the GDL. In each location and for each growing season, the wheat cultivars were sown according to randomized block design with four replicates. They include cultivars with high, medium or low susceptibility to wheat fungal foliar diseases in these regions (Table 1).
All plots received 40 to 70 kg N/ha, in the form of ammonium nitrate, at the growing stage (GS) 25 [12], followed by 60 to 70 kg N/ha at GS 32, and a final application of 65 to 95 kg N/ha at GS 59.
Weeds were controlled by one application of a pre-emergence herbicide (IP Flo, 1.0 L/ha, containing isoproturon at 500 g/L, Cheminova Agro, Senlis, France) and one post-emergence herbicide (Javelin, 2.0 L/ha, containing diflufenican at 62.5 g/L and isoproturon at 500 g/L; Bayer Crop Science, Monheim am Rhein, Germany).
FHB was not obvious over the 2003-2006 period. But, it become conspicuous in 2007 and 2008 [9]. It was therefore monitored over these two seasons in 17 and 16 sites in 2007 and 2008, respectively, including the four sites mentioned above (Table 2).
All disease assessment data used in the present study originate from fungicide untreated control plots.
2.2 Meteorological Data
Daily meteorological data were provided by the official agricultural meteorological service operated
Fig. 1 Location of the experimental sites (filled circles) and meteorological stations (triangles)
CRP: Centre de Recherches Publiques Gabriel Lippmann. ASTA: Administration des Services Techniques de l’Agriculture.
Table 1 Agronomic details for winter wheat plots used at the experimental sites in the GDL for the seven growing seasons from 2003 to 2009.
Location Regions Year Sowing date Cultivars Susceptibility Previous crops
Nitrogen
fertilization Harvest date WPM SLB WLR FHB
Everlange Gutland 2003 4/10/2002 Achat 5 5 5 n.a. oilseed rape 165 N/ha 19/07/2003 2004 14/10/2003 Achat 5 5 5 n.a. oilseed rape 195 N/ha 6/08/2004 2005 22/10/2004 Achat 5 5 5 n.a. oilseed rape 190 N/ha 2/08/2005 2005 22/10/2004 Akteur 3 6 4 4 oilseed rape 190 N/ha 2/08/2005 2005 22/10/2004 Parador n.a n.a n.a n.a oilseed rape 190 N/ha 2/08/2005
2006 10/10/2005 Akteur 3 6 4 4 fallow 225 N/ha 7/08/2006
2006 10/10/2005 Achat 5 5 5 n.a. fallow 225 N/ha 7/08/2006
2006 10/10/2005 Flair 4 4 6 4 fallow 140 N/ha 7/08/2006
2007 10/10/2006 Akteur 3 6 4 4 pea 195 N/ha 26/07/2007
2007 10/10/2006 Achat 5 5 5 n.a. pea 195 N/ha 26/07/2007
2007 10/10/2006 Flair 4 4 6 4 pea 195 N/ha 26/07/2007
2008 8/10/2007 Achat 5 5 5 n.a. wheat 195 N/ha 5/08/2008
2008 8/10/2007 Rosario 3 5 3 6 fallow 195 N/ha 5/08/2008
2008 8/10/2007 Tommi 2 4 6 5 fallow 195 N/ha 5/08/2008
2009 13/10/2008 Achat 5 5 5 n.a. oilseed rape 195 N/ha 6/08/2009 2009 13/10/2008 Privilege 3 4 4 4 oilseed rape 195 N/ha 6/08/2009 Burmerange Gutland 2003 4/10/2002 Dekan 1 4 8 4 oilseed rape 185 N/ha 11/07/2003
2004 1/10/2003 Cubus 2 6 7 4 oilseed rape 185 N/ha 2/08/2004 2005 13/10/2004 Cubus 2 6 7 4 oilseed rape 185 N/ha 4/08/2005 2006 30/09/2005 Cubus 2 6 7 4 oilseed rape 192 N/ha 19/07/2006 2007 11/10/2006 Cubus 2 6 7 4 oilseed rape 192 N/ha 26/07/2007 2008 6/10/2007 Cubus 2 6 7 4 oilseed rape 228 N/ha 5/08/2008 2009 6/10/2008 Cubus 2 6 7 4 oilseed rape 228 N/ha 29/07/2009
(Table 1 continued)
Location Regions Year Sowing date Cultivars Susceptibility Previous crops
Nitrogen
fertilization Harvest date WPM SLB WLR FHB
Christnach Gutland 2003 2/10/2002 Flair 4 4 6 4 oilseed rape 200 N/ha 23/07/2003 2004 13/10/2003 Flair 4 4 6 4 oilseed rape 200 N/ha 12/08/2004 2005 27/10/2004 Rosario 3 5 3 6 maize 200 N/ha 2/08/2005
2006 12/10/2005 Flair 4 4 6 4 maize 200 N/ha 25/07/2006
2007 12/10/2006 Tommi 2 4 6 5 maize 200 N/ha 26/07/2007
2008 23/10/2007 Flair 4 4 6 4 maize 200 N/ha 5/08/2008
2009 23/10/2008 Boomer 4 5 4 5 maize 200 N/ha 7/08/2009
Reuler Oesling 2003 6/11/2002 Bussard 4 6 7 3 oilseed rape 213 N/ha 5/08/2003 2004 16/10/2003 Bussard 4 6 7 3 oilseed rape 200 N/ha 16/08/2004 2005 5/10/2004 Flair 4 4 6 4 oilseed rape 200 N/ha 13/08/2005
2006 13/10/2005 Dekan 1 4 8 4 maize 200 N/ha 8/08/2006
2007 7/10/2006 Akteur 3 6 4 4 maize 200 N/ha 3/08/2007
2008 10/10/2007 Schamane 4 4 6 5 oilseed rape 200 N/ha 14/08/2008 2009 10/10/2008 Schamane 4 4 6 5 oilseed rape 200 N/ha 18/08/2009 SLB: septoria leaf blotch; WLR: wheat leaf rust; WPM: wheat powdery mildew; FHB: fusarium head blight. Scale of susceptibility: 1 (low susceptibility) to 9 (high susceptibility); an.a.: not available.
Table 2 Location of fields involved in the monitoring of Fusarium head blight in 2007 and 2008 growing seasons.
Year Site Location Region Cultivars Sucseptibility Previous crop
2007 1 Dondelange Southern Gutland Bussard 3 maize
2 Everlange Western Gutland Flair 4 pea
3 Nothum Western Oesling Achat n.a. n.a.
4 Hamiville North west Oesling Flair 4 oilseed rape
5 Reuler Eastern Oesling Akteur 4 maize
6 Lipperscheid Eastern Oesling n.a. n.a. maize
7 Reisdorf Eastern Oesling n.a. n.a. n.a.
8 Christnach Eastern Gutland Tommi 5 maize
9 Essingen Eastern Oesling Urban n.a. maize
10 Contern Southern Gutland Aron 5 wheat
11 Echternach Eastern Gutland Aron 5 maize
12 Oberdonven Southern Gutland Enorm 3 oilseed rape
13 Burmerange Southern Gutland Cubus 4 oilseed rape
14 Kayl Southern Gutland n.a. n.a. maize
15 Dippach Southern Gutland Exclusive n.a. triticale
16 Troisvierges Western Oesling n.a. n.a. n.a.
17 Hoscheid Western Oesling Rosario 6 oilseed rape
2008 1 Kelhen Southern Gutland n.a. n.a. maize
2 Everlange Western Gutland Rosario 6 fallow
3 Nothum North west Oesling Achat n.a. oats
4 Hamiville North west Oesling Rosario 6 maize
5 Reuler Eastern Oesling Schamane 5 oilseed rape
6 Lipperscheid Eastern Oesling n.a. n.a. n.a.
7 Reisdorf Eastern Oesling Rosario 6 barley
8 Christnach Eastern Gutland Flair 4 maize
9 Essingen Eastern Oesling n.a. n.a. n.a.
10 Contern Southern Gutland n.a. n.a. n.a.
11 Echternach Eastern Gutland Aron 5 maize
12 Oberdonven Southern Gutland n.a. n.a. n.a.
13 Burmerange Southern Gutland Cubus 4 oilseed rape
14 Kayl Southern Gutland n.a. n.a. wheat
15 Dippach Southern Gutland Astardo n.a. lucerne
16 Troisvierges Western Oesling n.a. n.a. barley
17 Hoscheid Western Oesling Rosario 6 oilseed rape
by the Administration des Services Techniques de l’Agriculture (ASTA) of GDL and the Centre de Recherche Public-Gabriel Lippmann (CRP-GL). Air temperature and relative humidity (RH) were measured at a height of 2 m above the soil surface and total precipitation was measured at 1 m above the soil surface and recorded once every 10 min. For air temperature, maximum, minimum and average were recorded for each 10 min time slot. For climatic map, kriging interpolation was used for temperature and rainfall. Uncorrected meteorological observations were subsequently pre-processed using an automatic data processing chain including error detection and correction as well as gap interpolation procedures [13]. These corrected data were provided by the CRP-GL.
In order to assess changes in weather conditions in the GDL, mainly for the spring temperature, daily air temperature data were analyzed during the 1971-2000, 2003-2005, 2006-2008 and 2007 periods.
2.3 Disease Monitoring
2.3.1 Foliar Diseases Assessment
Foliar disease assessment was based on visual disease symptoms. Disease severity on the five leaves (L5 to L1, L1 being the flag leaf) was monitored weekly for 10 stems per plot (size of 8.0 m by 1.5 m) in four plots, such that 40 plants in total per cultivar and per site were available for each observation date and year. Estimates were made weekly from April to July, with a final observation at GS 73 up to GS 77. Because the top two leaves L2 and L1 account for most of the wheat yield [14-16], the average disease severity on these leaves were then calculated.
2.3.2 Fusarium Head Blight Prevalence and Severity Assessment
FHB prevalence and severity were recorded for each site by carrying out visual evaluations of the disease at the anthesis half-way state (GS 67) to the late milk state (GS 77). FHB prevalence was calculated as the percentage of infected wheat spikes. It was determined by counting 1 m2 of field area
(approximately 150-250 ears per field). FHB severity was calculated as the percentage of kernels with visual symptoms per total kernels present on one ear and computing the average percentage per production field on the basis of 150-250 ears [9].
To achieve maximum accuracy, standard disease area diagrams for the cereal diseases were available to evaluators who assessed the percentage of infection in field [17], and training software programs for assessing disease severity, such as Distrain [18], were used to teach evaluators in disease assessment prior to the experiment.
2.4 Statistical Analyses
A principal component analysis (PCA) was used in order to analyze the distribution of the SLB, WLR and WPM between the sites localized in the North (Reuler) and those in the South (Everlange, Christnach and Burmerange). This PCA was performed on the average percentage of each disease severity on L2 and L1 observed in the study sites over 2003-2009 period. The PCA gives a subspace of reasonable dimension so that the projection onto this subspace retains “as much information as possible”, so that the projected cloud of points be as “dispersed” as possible. In other words, it reduces the dimension of the cloud of points and helps choosing a point of view to look at the cloud of points. To explain the distribution of the main fungal diseases between the Oesling and the Gutland, the average percentage of the disease severity was also compared. All statistical analyses (analyses of variance, correlation and regression analyses) were done using the SAS software (version 9.01, SAS Institute Inc., Cary, NC, USA).
3. Results
3.1 Weather Contrasts between the Oesling and the Gutland
The GDL is characterized by significant climatic contrast between the Gutland and the Oesling (P < 0.05) as well within these regions (Fig. 2).
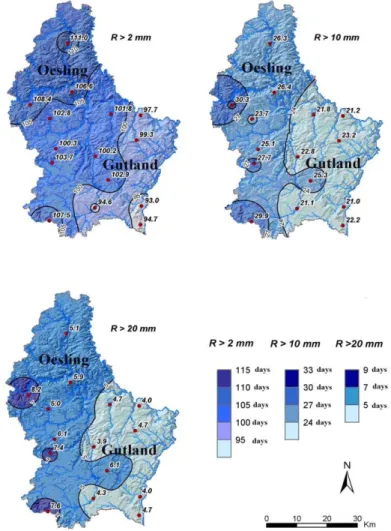
Fig. 2 Average number of rainy days > 2mm, > 10 mm and > 20 mm in the Grand-Duchy of Luxembourg (1971-2000).
The Oesling is characterized by high annual precipitations ranging between 850 and 1,000 mm and a high number of days with precipitations greater than 2 mm, 10 mm as well as 20 mm (Fig. 2). This region is also characterized by a low mean annual air temperature of 7.0-9.5 °C (Fig. 3). Compared with the Oesling, the Gutland’s climate is milder and drier, with annual precipitations ranging between 700 and 850 mm. This region is characterized by a lowest number of days with precipitations greater than 2 mm, 10 mm or 20 mm (Fig. 2). The mean annual air temperatures ranged between 9.0 and 11.5 °C (Fig. 3). In the Gutland, large climatic contrasts were observed between the different field observation sites (Fig. 2 and Fig. 3). The Western Gutland (Everlange) and Eastern Gutland (Christnach) presented the largest number of days with rain greater than 2 mm (>100 days)
Fig. 3 Geographical variation of the annual temperature in 2007 in the Grand-Duchy of Luxembourg.
and respectively 25 and 22 days for the rain greater than 10 mm (Fig. 3). The “Moselle valley” in the Southeast Gutland (Burmerange) was characterized by the lowest number of days (< 95) with precipitation
greater than 2 mm (Fig. 2). The annual average air temperature in Western Gutland and Eastern Gutland was close to 9.7 °C and 9.4 °C, respectively (Fig. 3). The highest annual temperature (close to 11 °C) was found in the Southeast Gutland.
Table 3 shows the average air temperature recorded by the official agricultural meteorological service of Luxembourg in different weather stations in the Gutland and the Oesling since 1971. The year 2007 was exceptional with 11 °C to 11.9 °C. The average air temperature was greater than those observed during the other years. The difference between the period 1971-2000 and other periods is highly significant (P < 0.01, Table 3).
3.2 Main Fungal Diseases in the GDL and Their Typology over the 2003-2009 Period
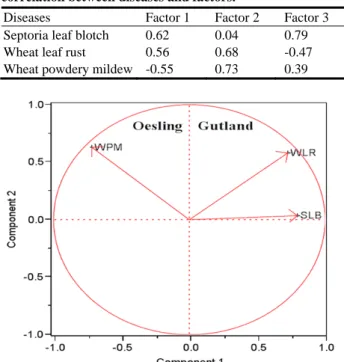
The distribution of the three fungal diseases (i.e., SLB, WLR and WPM) analyzed through the PCA was highly significant (P < 0.001) between the Gutland and the Oesling. The PCA revealed two factors explaining approximately 81% of the variance: factor 1 with 56% representing the Gutland and factor 2 with 25% representing the Oesling (Table 4). This analysis also reveals an opposite distribution among WPM, SLB and WLR. The correlation of SLB, WLR and WPM on factor 1 was 0.62, 0.56, and -0.55, respectively (Table 5). These results show that WPM was a disease prevalent in the Oesling and SLB and WLR specific to the Gutland (Tables 4 and 5, Fig. 4).
3.2.1 Septoria Leaf Blotch
The average SLB severity on L2 and L1 during the 2003-2009 period are summarized in Fig. 5. Field observations revealed highly significant differences (P < 0.001) between the Oesling and the Gutland. In the Oesling, the average disease severity was 16% whereas in the Gutland, it was 51% in the Western, 49% in the Southern and 27% in the Eastern (Fig. 6). The year 2007 showed the highest disease severity in the two regions. The disease reached 90% in the Gutland and 50% in the Oesling (Fig. 6). In this latter,
Table 3 Average spring temperatures (March, April and May) recorded by the ASTA in different spring weather stations in the Gutland and the Oesling since 1971.
Period Weather stations
Asselborna Echternachb Ettelbrückc Findeld Remiche
1971-2000 7.4 8.9 8.7 8.3 9.6 2003-2005 8.3 9.3 10.4 9.5 11.0 2006-2008 9.5 10.2 10.4 9.9 10.6 2007 10.2 11.0 11.6 11.9 11.3 Pf ** ** * ** ** a
Localised in the Northern Oesling, Diekirch district (50°36'45.59"N, 6°53'11.89"E);
b
Localised in the Eastern Gutland, Grevenmacher district (49°49'29.15"N, 6°26'20.37"E);
c
Localised in the Centre Gutland, Luxembourg district (49°51'00.00"N, 6°06'00.00"E);
dLocalised in the Southern Gutland, Luxembourg district
(49°37'26.44"N, 6°10'40.66"E);
e
Localised in the Southern Gutland, Luxembourg district (49°33'31.49"N, 6°20'14.30"E);
f
P value associated with F value. Significance levels: *P < 0.05;
**P < 0.01; ***P < 0.001; and NS, P > 0.05.
Table 4 Results of the principal component analysis: variance per factor.
Variance Percent Cumulative
Factor 1 1.67 55.77 55.77 Factor 2 0.74 24.55 80.32
Factor 3 0.59 19.68 100
Table 5 Results of the principal component analysis: correlation between diseases and factors.
Diseases Factor 1 Factor 2 Factor 3 Septoria leaf blotch 0.62 0.04 0.79 Wheat leaf rust 0.56 0.68 -0.47 Wheat powdery mildew -0.55 0.73 0.39
Fig. 4 Results of the principal component analysis highlighting the difference between the Gutland and the Oesling.
Fig. 5 Average disease severity (%) on the top two leaves (L2 and L1) during the 2003-2009 period for wheat powdery mildew (WPM), septoria leaf blotch (SLB), and wheat leaf rust (WLR).
Fig. 6 Septoria leaf blotch severity (%) on the top two leaves (L1 and L2) at GS 87 in the Grand Duchy of Luxembourg (2003-2009 period).
The average WPM, SLB and WLR severity were calculated between GS 65 and GS 77, at GS 87, and between GS 77 and GS 87, respectively [12].
2007 was the only year of high severity of SLB (52% on average at GS 87). For the other years, the disease severity in this region did not exceed 25% (Fig. 6).
3.2.2 Wheat Leaf Rust
During the 2003-2009 period, the highest and lowest WLR severities were observed in the Gutland and the Oesling, respectively (Fig. 5). A significant difference in severity was observed between these two regions (P < 0.01) and between the years (P < 0.05). In the Gutland, the disease appeared at GS 77 and GS 87 in the 2003-2005 cropping seasons, but at an earlier stage (GS 45) in 2006-2008 cropping seasons. Moreover, different patterns of the disease were observed throughout the Gutland. Thus, the highest disease severity was recorded in the Southern part (region with a highest average spring air temperatures, 13.6 °C and 14.0 °C) with 74% and 57%, in 2003 and 2007, respectively. The Eastern part of this region, located midway between the Northern and the Southern Gutland, showed an intermediate disease
severity with 7% and 22% in 2003 and 2007, respectively, (Fig. 7). Whereas the lowest severity of WLR (< 1%) was observed in the Oesling (region with the lowest average spring air temperatures, 12.0 °C and 12.4 °C).
3.2.3 Wheat Powdery Mildew
A significant difference (P < 0.05) in WPM severity was observed between the Gutland and the Oesling. Over the 2003-2009 period, the disease severity was very high in the Oesling (Fig. 5). The 2003 and 2009 cropping seasons, especially, showed the highest disease severity in this area (Fig. 8), whereas less than 1% of severity was recorded in the Gutland during these two years. In addition, the disease appeared much earlier in the Oesling (GS 30) than in the Gutland (GS 39). The major climatic factors that favored the 2003 and 2009 outbreaks of the WPM were mainly a daily average air temperature ranging between 15 °C and 22 °C and a RH of at least 80% during May and June.
Fig. 7 Average wheat leaf rust severity (%) on the top two leaves (L1 and L2) between GS 77 and GS 87 in the Grand Duchy of Luxembourg (2003-2009 period).
Fig. 8 Average wheat powdery mildew severity (%) on the top two leaves (L1 and L2) between GS 65 and GS 77 in the Grand-Duchy of Luxembourg (2003-2009 period).
3.2.4 Fusarium Head Blight
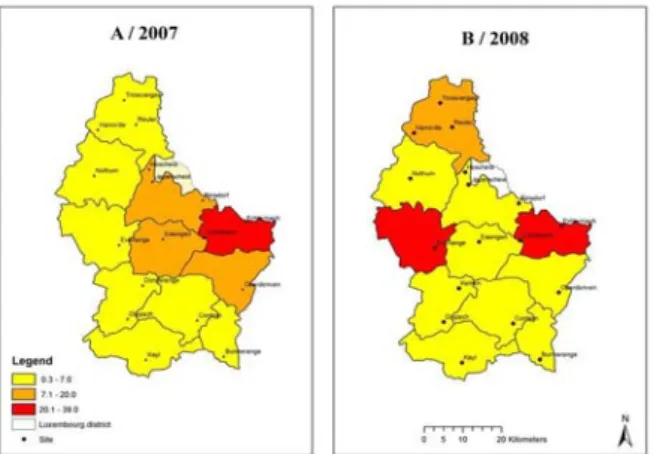
No significant difference was found for the prevalence (Figs. 9A and 9B) between the two years of observations for the Eastern Gutland (i.e., Echternach and Christnach). However, a trend for a lower severity in 2008 was observed, compared with 2007 (P = 0.053). The proportion of infected grains was high and significantly different (P < 0.01) in 2007 than that of 2008: on average, 21.0% ± 17.8% in 2007 versus 13.5% ± 16.2% in 2008. The location had a significant impact on both prevalence (Figs. 10A and 10B) and severity (P = 0.012 and P = 0.020, respectively, Fisher’s F-test). The Eastern part of the GDL showed the highest prevalence and severity during the two years, confirmed by a high level of
Fusarium contamination, especially in Echternach
(Eastern Gutland): prevalence and severity from the East were significantly higher compared with the North and the South (P < 0.05). The previous crop (Table 2) could have an influence on the prevalence of the disease. A significant higher prevalence of FHB
was observed in field with maize as previous crop as opposed to other crops (5.9% ± 1.6% vs. 3.3% ± 2.2%,
P = 0.02).
4. Discussion
This study aimed to describe and compare patterns of the main winter wheat fungal diseases, i.e., SLB, WPM, WLR and FHB in the GDL, based on their severity and the weather conditions. Generally, fungal diseases occur when three factors combine: a susceptible host, sufficient effective pathogen inoculum and suitable environmental conditions [19]. A weather analysis based on the Fourier transform highlighted a great difference in the intraday variation between the experimental sites in the GDL. This Fourier transform based method enables to take into account the RH and temperature variation related to topography levels in the warning system and to understand and explain the variation in disease expression between a plateau and a valley bottom or between North and South slopes [20].
Fig. 9 Average fusarium head blight prevalence (% infected wheat spikes), occurrence of grains infected by
Fusarium spp. in various geographical areas of Luxembourg (n = 17) in 2007 (A) and 2008 (B) between GS 77 and GS 87.
Fig. 10 Average Fusarium head blight severity (% infected grains/spike), occurrence of grains infected by
Fusarium spp. in various geographical areas of Luxembourg (n = 17) in 2007 (A) and 2008 (B) between GS 77 and GS 87.
4.1 Septoria Leaf Blotch
The occurrence and the distribution of the SLB correspond to those of neighboring countries. In Belgium, the tendency is that S. tritici dominates. In France, S. tritici dominates in the northwestern part, both species occur in the central and southeastern part, though in the latter S. tritici is replaced by S. nodorum in the course of the season [21, 22]. In Germany, the two pathogens coexist in the wheat management systems [23-25]. SLB is widespread in winter wheat in the GDL and is considered to cause one of the most serious foliar diseases that farmers need to take into
account when deciding fungicide application during stem elongation [26]. In the Oesling, the severity of SLB was low between 2003 and 2009, except in 2007. In the Gutland, this severity greatly varied among years and locations, suggesting a strong influence of environmental factors. Several studies [2, 25, 27] have shown that the epidemiological development of SLB pathogens is strongly dependent on the weather, which together with differences among cultural practices, leads to differences in the onset, course, and severity of the disease complex from one year to the next. Among these environmental factors, the amount of precipitation, the relative humidity (RH) and temperatures play important roles. In the GDL, SLB development and dispersion are favored on the one hand, by at least 0.1 mm of precipitation for the first hour to allow for the swelling pycnidia, followed by a second hour with at least 0.5 mm of precipitation, leading to the release and splash dispersal of the conidia [26]. On the other hand, RH should be higher than 60% during the following 16 h after the rainfall and air temperature should remain above 4 °C for 24 h for germination and infection [26, 28].
4.2 Wheat Leaf Rust
Several studies in the extensive cereal-producing areas have shown that WLR epidemics occur under favorable conditions for overwintering spores as a source of primary inoculum, rapid and abundant production of wind-dispersed urediniospores, and a complex interaction between environmental conditions and host resistance [29]. In the GDL, during the study period spanning from 2003 to 2009, an outburst of WLR was observed in the 2003, 2006, 2007 and 2009 growing seasons. An increase in disease incidence was also observed in trial plots at Burmerange in 2003, 2006 and 2009 and throughout the country during the 2007 growing season [30]. A strong correlation between the number of hours with particular weather conditions and the percentage leaf area covered by WLR lesions for the two upper leaves was reported. Such weather conditions included a
period of at least 12 consecutive hours with temperatures ranging between 8 °C and 16 °C and a RH greater than 60% (optimum air temperatures values between 12 and 16 °C and optimum RH greater than 80%). Moschini and Perez [31] found similar conditions for the development of WLR epidemics in Argentina, reporting optimum weather values of daily mean temperatures between 12 and 18 °C and RH greater than 49%. Incidence of WLR has been observed to increase in severity and in precocity over several growing seasons within the past decade in the Gutland. A reason for these early and unpredictable WLR occurrences in this region could be traced back to several factors, especially (1) the sensibility of the cultivar (Dekan and Cubus planted in the southern Gutland are very susceptible), (2) the geographical position of the region (on the border of Germany and French Lorraine from which the primary inoculums could arise), and (3) a recent increase in spring air temperature [30]. This latter point of view is supported by Daamen [32] and Wiik [33] who indicated that a high temperature in the earlier spring (i.e., March) probably facilitated sporulation and infection on young leaves.
4.3 Wheat Powdery Mildew
Although several cultivars were involved in these fungal diseases monitoring (from low to moderate sensitivity to WPM, Table 3), this survey shows clearly that differences in disease severity occur throughout regions in the GDL. It is well documented that high humidity favors the development of WPM infection [34, 35]. The high disease severity recorded in the Oesling could be explained by (1) environmental climatic conditions favorable to the disease (RH, daily air temperature) and (2) agricultural practices related to over-application of nitrogen fertilizers in the region. In 2003 and 2009, in the Gutland, the average mineral fertilizers rate application was 165 kg N/ha. In comparison with the Gutland, nitrogen application was very important in Oesling (213 kg N/ha) and the severity of disease was
also very important. However, between 2004 and 2008, when the severity of disease was low in the Oesling, the average nitrogen application was 160 kg N/ha. The main cultivation regions in the GDL are divided into 18 growing districts as spatial units characterized by their topography, soils, climate, natural vegetation, current forestation and forest site conditions [36]. The submontaneous Oesling comprises 32% of the territory and is situated on a high plateau of the greater Ardenne area (average altitude: 450 m), allowing the existence of a microclimate favorable to the development of the WPM.
4.4 Fusarium Head Blight
Numerous research and survey reports have shown that the main climatic factors influencing the development of FHB are temperature and humidity/wetness [37-41]. In the GDL, it is likely that the “relatively warm” spring temperature, combined with rain and high humidity during anthesis, promoted the disease development in the study sites. It can be speculated that the difference observed for FHB severity between 2007 and 2008 may, at least in part, be explained by the warmer temperature observed in 2007 (11.9 °C) than in 2008 (9.4 °C). Our study also highlights the relationship between the prevalence and severity of FHB and cereals as previous crops, namely maize crop. Maize residues have been reported as a crop hosting the inoculum of Fusarium species [42-45]. Many of the diseases affecting wheat survive from one season to another in plant residues. Selection of cultural practices aiming to reduce inoculum borne residues will assist in the control of the FHB. The regional effects on disease expression in the GDL are very interesting and can influence the control measure rational according to each region.
5. Conclusions
This study showed that one of the major environmental factors influencing the distribution of these main fungal diseases in the GDL was the climate.
The sensitivity of crop yield varies depending on the production environment. The damage threshold is therefore not the same at all crop-growth stages or in different cultivars. The use of foliar fungicides in winter wheat production provides large benefits to both growers and the marketplace in terms of business stability and enhanced security of supply. Environmental concerns and changes in the cost/revenue ratio for wheat, however, increase the demand for more accurate identification of spraying needs. Integrated pest management requires therefore that pesticides should only be applied at particular infection stages and when the pathogen has been correctly identified. This study is an important step towards spatializing the risk of fungal disease in GDL that could include the regional effect of each disease. This map of fungal diseases risk would here to be established on the basis of agroclimatic indices correlated with optimal frequencies and dates of chemical treatments. It could also be completed by the modulation of fungicide treatment per season according to the effective risk.
Acknowledgments
The authors would like to thank the Administration des Services Techniques de l’Agriculture (ASTA) in the G.D. Luxembourg for funding this research through the successive SINTAMA, MACRY and SENTINELLE projects. The authors are grateful to Guy Reiland, Marco Beyer, Abdeslam Mahtour, Christophe Mackels, Virginie Schyns, Bertrand Martin, Carine Vrancken, Farid Traoré, Michel Noel, Guy Mirgain, Marc Kails and Alexandre Nuttens for their technical support. The authors also thank Laurent Pfister for the meteorological data.
References
[1] M. El Jarroudi, F. Giraud, B. Tychon, L. Hoffmann, H. Maraite, P. Delfosse, Modeling septoria leaf blotch progress using the proculture model for a sustainable management of winter wheat in Luxembourg. Phytoma-La défense des végétaux 642 (2011) 43-46. (in French)
[2] Z. Eyal, Integrated control of septoria diseases of wheat, Plant Dis. 65 (1981) 763-768.
[3] Z. Eyal, I. Wahl, J.M. Prescott, Evaluation of germplasm response to septoria leaf blotch of wheat, Euphytica 32 (1983) 439-446.
[4] P. O'reilly, M.J. Downes, Form of survival of septoria nodorum on symptomless winter wheat, T. Brit. Mycol. Soc. 86 (1986) 381-385.
[5] P.S. Teng, Estimating and interpreting disease intensity and loss in commercial fields, Phytopathology 73 (1983) 1587-1590.
[6] R.E. Gaunt, The relationship between plant disease severity and yield, Annu. Rev. Phytopathol 33 (1995) 119-144.
[7] P.E. Waggoner, D.E. Aylor, Epidemiology: A science of patterns, Annu. Rev. Phytopathol. 38 (2000) 71-94. [8] S.R. Parker, M.W. Shaw, D.J. Royle, The reliability of
visual estimates of disease severity on cereal leaves, Plant Pathol. 44 (1995) 856-864.
[9] F. Giraud, M. Pasquali, M. El Jarroudi, C. Vrancken, C. Brochot, E. Cocco, et al., Fusarium head blight and associated mycotoxin occurrence on winter wheat in Luxembourg in 2007/2008, Food Addit. Contam. Part A 27 (2010) 825 - 835.
[10] T.E. Cleveland, P.F. Dowd, A.E. Desjardins, D. Bhatnagar, and P.J. Cotty, United states department of agriculture—agricultural research service research on pre-harvest prevention of mycotoxins and mycotoxigenic fungi in US crops, Pest Manag. Sci. 59 (2003) 629-642. [11] C.E. Windels, Economic and social impacts of fusarium
head blight: Changing farms and rural communities in the northern great plains, Phytopathology 90 (2000) 17-21. [12] J.C. Zadoks, T.T. Chang, C.F. Konzak, A decimal code
for the growth stages of cereals weeds, Weed Research 14 (1974) 415-421.
[13] A.S. Anatoly, S.M. Svetlana, A.P. Gennady, Modeling of the daily rainfall values using surface under tension and kriging, J. Geogr. Inf. Decis. Anal. 2 (1998) 52-64. [14] M.W. Shaw, D.J. Royle, Estimation and validation of
function describing the rate at which Mycosphaerella
graminicola causes yield loss in winter wheat, Ann. Appl.
Biol. 115 (1989) 425-442.
[15] M.R. Thomas, R.J. Cook, J.E. King, Factors affecting development of Septoria tritici in winter wheat and its affect on yield, Plant Pathol. 38 (1989) 246-257.
[16] D.J. Lovell, S.R. Parker, T. Hunter, D.J. Royle, R.R. Coker, Influence of crop growth and structure on the risk of epidemics by Mycosphaerella graminicola (Septoria
tritici) in winter wheat, Plant Pathol. 46 (1997) 126-138.
[17] C.A. James, Manual of assessment keys for plant diseases, Canada Department of Agriculture Publication No.1458, APS, St.Paul, MN, USA, 1971.
[18] J.R. Tomerlin, A. Howell, Distrain: A computer program for training people to estimate disease severity on cereal leaves, Plant Dis. 72 (1988) 455-459.
[19] J. West, J. Townsend, M. Stevens, B. Fitt, Comparative biology of different plant pathogens to estimate effects of climate change on crop diseases in Europe, Eur. J. Plant Pathol. 133 (2012) 315-331.
[20] M. El Jarroudi, F. Giraud, P. Delfosse, L. Kouadio, L. Hoffmann, H. Maraite, et al., New method for establishing a network of operational warning of septoria leaf blotch disease in winter wheat, Phytopathology 101 (2011) 47.
[21] P. Halama, The occurrence of Mycosphaerella
graminicola, teleomorphe of Septoria tritici in France,
Plant Pathol. 45 (1996) 135-138.
[22] B. De La Rocque, Importance and geographic distribution of cereal diseases in France during 1976-1985, Perpect. Agricoles 102 (1986) 27-38. (in French)
[23] R.A. Daamen, W. Stol, Surveys of cereal diseases and pests in the netherlands, occurrence of Septoria spp., in winter wheat. Neth. J. Plant Pathol. 98 (1992) 369-376. [24] Z. Eyal, The Septoria tritici and stagonospora nodorum
blotch diseases of wheat, Eur. J. Plant Pathol. 105 (1999) 629-641.
[25] J.A. Verreet, H. Klink, G.M. Hoffmann, Regional monitoring for disease prediction and optimization of plant protection measures: The IPM wheat model, Plant Dis. 84 (2000) 816-826.
[26] M. El Jarroudi, P. Delfosse, H. Maraite, L. Hoffmann, B. Tychon, Assessing the accuracy of simulation model for septoria leaf blotch disease progress on winter wheat, Plant Dis. 93 (2009) 983-992.
[27] M.W. Shaw, D.J. Royle, Factors determining the severity of epidemics of Mycosphaerella graminicola (Septoria
tritici) on winter wheat in the UK, Plant Pathol. 42 (1993)
882-899.
[28] A. Mahtour, M. El Jarroudi, L. Delobbe, L. Hoffmann, H. Maraite, B. Tychon, Site-specific septoria leaf blotch risk assessment in winter wheat using weather-radar rainfall estimates, Plant Dis. 95 (2011) 384-393.
[29] M.G. Eversmeyer, C.L. Kramer, Epidemiology of wheat leaf and stem rust in the central great plains of the USA, Annu. Rev. Phytopathol. 38 (2000) 491-513.
[30] M. El Jarroudi, F. Giraud, P. Delfosse, L. Hoffmann, H. Maraite, B. Tychon, Assessment of the night weather parameters and their use in forecasting model of wheat leaf rust, Phytopathology 100 (2010) 32.
[31] R.C. Moschini, B.A. Pérez, Predicting wheat leaf rust severity using planting date, genetic resistance, and weather variables, Plant Dis. 83 (1999) 381-384.
[32] R.A. Daamen, R.W. Stubbs, W. Stol, Surveys of cereal
diseases and pests in the Netherlands, occurrence of powdery mildew and rusts in winter wheat, Neth. J. Plant Pathol. 98 (1992) 301-312.
[33] L. Wiik, T. Ewaldz, Impact of temperature and precipitation on yield and plant diseases of winter wheat in southern sweden 1983-2007, Crop Prot. 28 (2009) 952-962.
[34] D.G. Jones, B.C. Clifford, Cereal diseases, their pathology and control, 2nd ed. John wiley & sons ltd., New York, NY, 1983, p. 309.
[35] D.E. Te Beest, N.D. Paveley, M.W. Shaw, F. Van Den Bosch, Disease-weather relationships for powdery mildew and yellow rust on winter wheat, Phytopathology 98 (2008) 609-617.
[36] M. Dietz, J.B. Pir, Distribution and habitat selection of
Myotis bechsteinii in luxembourg: Implications for forest
management and conservation, Folia Zool. 58 (2009) 327-340.
[37] M. Mcmullen, R. Jones, D. Gallenberg, Scab of wheat and barley: A re-emerging disease of devastating impact, Plant Dis. 81 (1997) 1340-1348.
[38] B. Qu, H.P. Li, J.B. Zhang, Y.B. Xu, T. Huang, A.B. Wu, et al., Geographic distribution and genetic diversity of fusarium graminearum and F. asiaticum on wheat spikes throughout China, Plant Pathol. 57 (2008) 15-24.
[39] C.M. Placinta, J.P.F. D'mello, A.M.C. Macdonald, A review of worldwide contamination of cereal grains and animal feed with fusarium mycotoxins, Anim. Feed Sci. Tech. 78 (1999) 21-37.
[40] F.M. Doohan, J. Brennan, B.M. Cooke, Influence of climatic factors on fusarium species pathogenic to cereals, Eur. J. Plant Pathol. 109 (2003) 755-768.
[41] C.H.A. Snijders, Fusarium head blight and mycotoxin contamination of wheat, a review, Eur. J. Plant Pathol. 96 (1990) 187-198.
[42] A.W. Schaafsma, L. Tamburic-Ilincic, D.C. Hooker, Effect of previous crop, tillage, field size, adjacent crop, and sampling direction on airborne propagules of gibberella zeae/fusarium graminearum, fusarium head blight severity, and deoxynivalenol accumulation in winter wheat, Can. J. Plant Pathol. 27 (2005) 217-224. [43] R. Dill-Macky, R.K. Jones, The effect of previous crop
residues and tillage on fusarium head blight of wheat, Plant Dis. 84 (2000) 71-76.
[44] S.G. Markell, L.J. Francl, Fusarium head blight inoculum: Species prevalence and Gibberella zeae spore type, Plant Dis. 87 (2003) 814-820.
[45] R. Dill-Macky, Cultural control practices for fusarium head blight: Problems and solutions, Cereal Res. Commun. 36 (2008) 653-657.