Accepted Manuscript
Title: A Study of Life Cycle Assessment in two Old Neighbourhoods in Belgium
Authors: Modeste Kameni Nematchoua, Somayeh Asadi, Sigrid Reiter PII: S2210-6707(18)32235-2 DOI: https://doi.org/10.1016/j.scs.2019.101744 Article Number: 101744 Reference: SCS 101744 To appear in:
Received date: 30 October 2018
Revised date: 22 June 2019
Accepted date: 29 July 2019
Please cite this article as: Nematchoua MK, Asadi S, Reiter S, A Study of Life Cycle Assessment in two Old Neighbourhoods in Belgium, Sustainable Cities and Society (2019), https://doi.org/10.1016/j.scs.2019.101744
This is a PDF file of an unedited manuscript that has been accepted for publication. As a service to our customers we are providing this early version of the manuscript. The manuscript will undergo copyediting, typesetting, and review of the resulting proof before it is published in its final form. Please note that during the production process errors may be discovered which could affect the content, and all legal disclaimers that apply to the journal pertain.
Journal Pre-proof
1
A Study of Life Cycle Assessment in two Old Neighbourhoods in Belgium
Modeste Kameni Nematchouaa,b,c* ,Somayeh Asadic, Sigrid Reiterb
aBeneficiary of an AXA Research Fund postdoctoral grant, Research Leaders Fellowships, AXA SA 25 avenue Matignon75008 Paris, France.
bLEMA ,ArGEnCo Department, University of Liège, Belgium.
cDepartment of Architectural Engineering,PennsylvaniaState University, United States of America.
Corresponding authors. Tel.:+32465178927, 00261322430984. Email addresses:kameni.modeste@yahoo.fr(M.K. Nematchoua).
GRAPHICAL ABSTRACT
Highlight
Energy consumption is 16% higher in urban than suburban neighbourhood.
Eutrophication concentration is higher in the suburban area than urban.
Journal Pre-proof
2
Abstract
The aim of this research is to determine the most important source of environmental change at the two old neighbourhood. The study of multiple scenarios allows us to determine their Life Cycle Assessment (LCA) impacts and identify the key variables. The impact of storm water management, density, mobility, management of unoccupied space, and the use of renewable energies on the environmental balance sheet of two old neighbourhoods located in Urban and Suburban zones was quantified. The environmental data comes from several interviews with occupants, ECOINVENT database, developed by different research institutes based in Switzerland, and the U.S. Department of Energy's Office of Energy Efficiency and Renewable Energy which provides weather data for more than 2,100 locations throughout the world. Three different software programs were used for studying the different environmental impacts. The results showed that the length of daily trips made by the residents, the presence of public transportation and bike path has no significant influence on the environment in the two old neighbourhoods. The variation of photochemical ozone is important in both
neighbourhoods. However, the presence of water retention and distribution systems reduces up to 10% the environmental impacts and in particular eutrophication, waste production, acidification and damage to health.
Keywords: Life-cycle assessment, old neighbourhoods, Belgium, study.
1. Introduction
During this decade, the magnitude of the energy and environmental crisis necessitated a radical change in the human race in terms of the ecological footprint [1]. The concept of sustainable development is not only focused on the protection of the environment, but also geared towards of satisfying basic social needs.The concept of sustainable design or sustainable architecture is a subsidiary of sustainable development which focuses on economic, environmental and socio-cultural factors. The notion of sustainability requires ensuring our current needs while ensuring that our decisions and actions do not hinder the opportunities of future generations. Sustainable design issues are made up of a broader area encompassing human, technical, scientific, financial and political potential [2].At the beginning of the twenty-first century, a leap is made in the international awareness of environmental problems.
Journal Pre-proof
3
The report(2007) of the United Nations Intergovernmental Panel on Climate Change (IPCC) is important to this [3]. They claim that humans are 90% responsible for the worsening of the greenhouse gas (GHG) effect and this could lead to a rise in water levels of more than 40 cm[4- 5]. They point to the economic, environmental and social risks that global warming could create [6].Nowadays, with the strong pressure of climate change, professionals and architects are constantly worrying about the sustainability of buildings. Studies based on the bioclimatic approach have adopted passive strategies to reduce energy consumption while increasing the energy performance of the building.New building design methods take into account the external environment. Indeed, the energy performance of the building takes into account only energy in use phase of the building. In 2006, the United Nations Environment Program stipulated that the building sector is key to instilling the concept of sustainable development. This sector consumed an average of 40% of total energy and produced 30% of solid waste [7].
LCA allows measuring the environmental impacts of a product (object, building,
neighbourhood, etc.) from the extraction of raw materials to the disposal of waste, in other words, from "birth" to "death" of the product [8-9].Indeed, LCA is the tool most used to assess environmental problems arising from the construction, use, demolition and recycling of productsbased on [10]. By associating LCA in the different stages of building design, it is easier for designers and architects to examine the Life Cycle Assessment, and select the components that reduce the negative environmental impacts of the buildings during their life span based on [11].The LCA was standardized in the ISO 14040[10] and ISO 14044[11] standards. This study takes into account different categories of environmental impacts such as fossil depletion, global warming, and human toxicity.LCA study enables sustainable decisions to be made to preserve the environment, such as establishing a balance sheet of energy inputs, selecting the most sustainable materials, identifying the environmental constraints and
analysing the results in order to make more mature and accurate decisions [11]. Commonly, there are two main types of LCA [10].The LCAs by allocation which determines the impacts arising from the production and use of a product at a specific time [11]. The other type is the consecutive LCAs which identify the environmental consequences of a proposed decision or change in a system under review (future-oriented), showing that the consequences of
economic and market decisions should be taken into consideration [10].
The other aspect of the LCA is the social impact which is designed and investigated in[12].Several studies have used LCA to investigate the impacts of the buildings on the environment which the results varied according to the function unit.Stephanet al. [13]
Journal Pre-proof
4
analysed the life cycle energy use in a passive building in Belgium. They showed that the implementation of thermal insulation on the roofs and walls, allows to improve the house energy efficiency. Cabeza et al. [14] showed the application of LCA and LCE (life cycle energy), investigate the environmental effects of traditional buildings. They found that, it is often difficult to compare the LCA studies because of the hypothesis which varied of a study to another. Some other studies focused on impacts of building construction materials.
Kellenberger and Althaus[15] showed that wooden constructions have a weak impact on the environment. Bribiánet al. [16] showed that the impact of material can be significantly reduced by applying the new methods of eco-innovation. Vilches et al. [17] explained that in several researches regarding LCA, the energy demand and greenhouse gas are two elements always studied. Ramesh et al. [18] found that a redundant use of passive characteristics in a habitat cannot be profitable, after analysing office and residential buildings from 73 cases applied in 13 countries. In 2001, Peuportier[19] explained that in buildings, the living area is regularly defined as functional unit which allows comparing several projects.
In a recent study carried out in a conventional and sustainable neighbourhoods, Nematchoua et al.[20] found that the CO2 emissions were up to 36.6% higher in an old neighbourhood than a sustainable one; while the energy demand was estimated at 62.6% and 37.4% in an old and a sustainable one, respectively.
Szalay[21] and García-Casals [22] stated in their studies that the energy requirements of buildings should normally be taken into account in the planning of environmental
management. Other studies were shown in [23-25].Currently, a new vision of researchers and specialists is to extend the application of LCA, to larger systems, at the occurrence of, urban islets or neighbourhoods. In the neighbourhoods, some studies have already been conducted nevertheless, the studies of such magnitude are regularly encouraged.
Loiseau et al. [26] showed that LCA provides an appropriate framework and is the only way to avoid transferring environmental loads from one phase of the life cycle to another.
Anderson et al. [27] showed that LCA is the dominant method for studying environmental impact at the urban scale. Olivier-Solà et al. [28] showed that it is highly likely that the environmental and energy issues we are currently dealing with at the building level will soon be transferred to the urban scale. In a study carried in 10 buildings, Nematchoua et al.
[29]found that the use phase of building consumes significant amount of life cycle energy (from 81.0 to 94.3%), but also, the largest contribution to the life cycle greenhouse gas
Journal Pre-proof
5
sustainable norms [30]. It was found that each of these tools allowed to have at least one important environmental impact found during the LCA.
A simpler method for estimating solar and heating energy demand in buildings during the neighbourhood planning phase was proposed by Trigaux et al. [31].The high-density
neighbourhoods have lower energy demand, with potential reductions of up to 40% compared to low-density neighbourhoods. In Belgium, all neighbourhoods have different characteristics and are independent of each other. Studies on life cycle analysis were regularly conducted in building scale, but, least at the neighbourhood scale [32]. Therefore, it is required to
investigate the LCA environmental impacts of old neighbourhood and understand their environmental impacts.
The main objective of this research is to show how to apply LCA on a neighbourhood scale and how to conduct our approach in the case of two neighbourhoods of different
characteristics.
This research explores a method for analysing the life cycle at the scale of a neighbourhood and compares the obtained results with those of other existing research. In addition, this research allows to observe the difference of an impact due to the localization of a district on the environment. Two sub-studies made it possible to observe the potential of water retention systems in these projects and the consequences of the daily journeys of the population. We considered several environmental indicators to identify the most important parameters that have the greatest impact on the environmental quality of a neighbourhood.
2.Methodology
This study is divided into four main parts including(a) investigation and analysis of some elements (Building materials, equipment, heating, construction area, roads, public spaces etc.) coming from two old neighbourhoods, (b) site modelling and dynamic thermal analysis; (c) life cycle assessment and adaptation of new scenarios; (d) habitat orientation impact
assessment, water management, renewable energy, and population mobility on urban and suburbanlife cycle.
2.1.Studied cities
Liege is a city located in the Wallonia region in Belgium. This city is characterized by a temperate climate, acceptable for outdoor activities throughout the year, even if the most favourable period for these includes the end of spring, all the summer and the beginning of autumn.
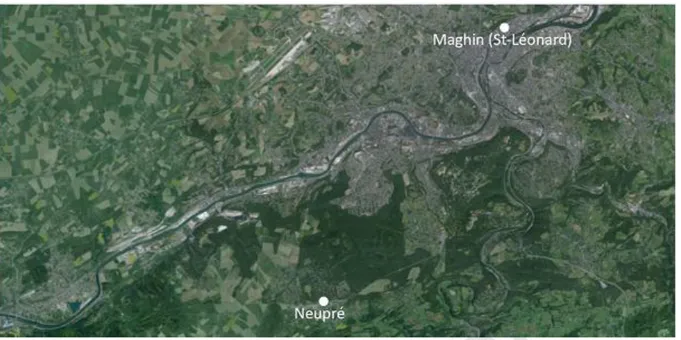
The two neighbourhood typologies selected for this study are an urban block and a suburban block. The first is located in Liege, in the Saint-Léonard district. It is located at the level of
Journal Pre-proof
6
Maghin Street, which will be called "Maghin neighbourhood" hereinafter. The second is located at Neupre, which will be called" Neupre neighbourhood" hereinafter. They are both in Wallonia, more precisely in the province of Liege.
2.1.1. Urban neighbourhood: Maghin
Maghin is located in the city centre of Liege, between the Maghin Street, the streets of Franchimon to is and Jonruelle. This islet is the only residential while being close to a wide variety of services such as shops and public transport. It was built in the 19th century during the period of rapid urbanization. It is well representative of the urban islets by its high density of buildings, the little free space in the centre of the islet but also by its predominantly
terraced dwellings.A view of this neighbourhood is shown in Figure 2a. 2.1.2. Suburban neighbourhood: Neupre
The Neupre district is located on the outskirts of Liege, 16 km from Liege-Guillemins train station and 18 km from the centre of Liege. Like the Maghin neighbourhood, the Neupre neighbourhood is only residential but the number of the homes has 3 times less. At the surface level, it is noted that the Neupre neighbourhood is almost 4.5 times higher than that of
Maghin Street. The buildings were built between the years 1860 and the 1990s. There is little public transportation in this area. The Figure 2a showed the location of this
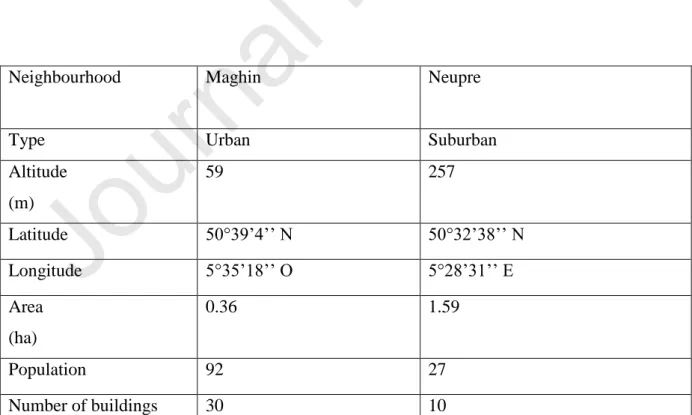
neighbourhood.The Table1 gives some characteristics of these two neighbourhoods. Table 1. Some characteristics of the neighbourhood.
Neighbourhood Maghin Neupre
Type Urban Suburban
Altitude (m) 59 257 Latitude 50°39’4’’ N 50°32’38’’ N Longitude 5°35’18’’ O 5°28’31’’ E Area (ha) 0.36 1.59 Population 92 27 Number of buildings 30 10
Journal Pre-proof
7
Building ages 120-169 29-159
Building types Residential
and commercial
Terraced and semi-detached houses, apartment buildings Density (log/ha) 81 06 Building area (%) 44 10
Each of the cases considered has some design characteristics that influence the ecosystem. 2.2.Designanalysis
In these two regions, most of the buildings were constructed about100 years ago which indicated that these studied places are classified as “Old neighbourhood". In Maghin neighbourhood, the total population was estimated around 92 living in 30 buildings which occupied 44% of the total area. While in Neupre neighbourhood, there is, at least 27 people distributed in 10 great buildings which only occupied 10% of the total area of the
neighbourhood. Some characteristics of these buildings are shown in Table2. Most of the studied buildings have window beats single glazed aluminium.
2.3. Data choice
Some environmental data which, we use come from the ECOINVENT database developed by different research institutes based in Switzerland. These data include, for each process and material, a life cycle inventory that contains all material and energy flows into and out of the system [19]:(i) resources consumed (water, energy,etc.);(ii) Emissions in the different natural environments: air, water or soils (ammonia in water, metals in the soil, CO2,etc.);(iii) Wastes created (inert, toxic or radioactive).
We used version 2.2 (2012) of the ECOINVENT database. This version was completed by the most recent version, ecoinvent 3.5 (2018), which constitutes all previous versions of the tool. The development of this database follows processes that have been certified several times as reliable and the contents of this database have been verified and validated by international experts. The ECOINVENT Centre is recognized as an international leader in environmental sustainability data and is recognized for the transparency of these methods [33]. Other data applied in the table 6, come from BELDAM report [34]. Indeed, BELDAM report gives somestudies on the mobility in Belgium.
Journal Pre-proof
8
In this study, we assessed twelve (12)impacts of the life cycle: the greenhouse effect(via the Global Warming Potential, GWP);acidification(via the Potential of Acidification,
PA);Primary Energy Demand; the water used; Waste produced; the depletion of abiotic resources (via the Abiotic Depletion Potential, ADP);eutrophication (via the Potential of Eutrophication, PE); the production of photochemical ozone(viathe Ozone Depletion Potential, ODP); damage to biodiversity; Radioactive waste; Damage to health(via the Disability Adjusted Life Year, DALYs); Odors(via the Odor Threshold Value, OTV). 2.5. Scenarios
To perform a dynamic thermal simulation of each modelled building, the following scenarios were defined:
(1)Occupancy scenario: between 7.00 am, and 6:00 pm, theaveragebuildingoccupancy rate was around 25%, and the night, between 7:00 pm and 6:00am, more than 100%. The unit of LCA was 6 inhabitants for 100m²,in Maghin islet (urban) and of2 inhabitants for 100m²,in Neupre islet (suburban).The Activity of all the occupants was sedentary (1met).
(2) In the implementation process of this modelling, we define the thermal zones and their scenarios of occupancy, in order to carry out our dynamic thermal simulation. Looking at the study scale, only three types of thermal zones were created, as it was very difficult to detail heat zones room by room for each apartment. We separated the apartments into two zones: a day zone and a night zone. In addition to that, we have created an area corresponding to the halls. The statistical analysis of the meteorological data showed that in the day zone, the heating set point temperature was 16°C between 22:00 hours and 07:00 hours and 19°C during the day, whereas, in the night zone, the temperature was about 18°C between 22:00 hours and 07:00 hours and 16°C during the day. We assumed the area that was occupied during the day and unoccupied at night and conversely for the night area. We judged a temperature of 18°C was sufficient for the rooms, in case of sleep. The dissipated power inside the building was mainly due to the use of electrical equipment generating heat. Their values were increased during the daytime, when the occupants' requirement of electrical appliances was assumed to be greater. The analysis of the data obtained showed that between 7:00 a.m. and 10:00 a.m. and between 6:00 p.m. and 9:00 p.m., it was around 5.7 W/m². (3) Lighting level scenario: less than 100Lux from 10pm to 5:00 am (hours of sleep), more than 300Lux from 6:00 am to 10 pm, corresponding to the rush hour of work.This choice was made with respect to the occupation scenario
(4) Other scenarios: We assume the day area occupied during the day and unoccupied at night and conversely for the night area. We judge assumed a temperature of 18 °C is acceptable for
Journal Pre-proof
9
the rooms in case of sleep. The dissipated power inside the building is mainly due to the use of electrical equipment generating heat. Their values are increase during the periods of the day in which occupants' activities requesting electrical appliances are assumed to be greater. The data analysis allows us to set the occupancy of the studied apartments at 0.033
inhabitants/m², which corresponds to one occupant per 30 m².
For each thermal zone, we defined the ventilation parameters. We considered good air-tightness, resulting in an infiltration of 0.25 vol/hour through the wall. The thermal standards limit air infiltration for new buildings to 0.6 vol/hour, however, here, in the case of passive buildings, we assumed the air tightness, which was the subject of particular attention during the study and its implementation. An annual standard ventilation scenario was chosen with a nominal flow rate of 0.3 vol /hour, a double flow controlled mechanical ventilation and a heat exchanger with a yield of 85%. This interchange was bypassed between mid-June and early September. The hot water generation for the heating system as for the domestic hot water (DHW) was provided by a standard condensing gas boiler, with 92% efficiency Lower heating value. The heat emitter consists of a heated floor on the ground floor and radiators on the first floor. Analysing the characteristics of these systems, we decided to use some data found in the software by default.
2.6. Life Cycle Assessment
No hypothesis were made at random, everything was defined using reliable sources and known to optimize the veracity of this research. Some data used in this study was obtained by performing several field surveys, interview of some building owners(occupant, activity ,area, buildings, equipment, etc.), but also by analysing the results of some researches in the
literature concerning this city[33-34]. 2.6.1. Building scale data
Some input data in the tools were: (i) The metrics of all building elements and their detailed characteristics; (ii) The required energy and water and consumptions resulting from the dynamic thermal simulation. Structural that is to say, 100 years). These lifetimes allowed to calculate the impacts of the renovation phase.
The transport distances of the materials that we have taken into account in the LCA are contextualized in the case of Belgium and are the following: 100 km between the production site and the construction site, and 50 km between the construction site and the discharge. The5% material surplus was considered. It corresponded to the average fall rate of the different construction products (standard value suggested by modelling software).
Journal Pre-proof
10
The energy data were evaluated under the Belgian energy mix in the software. It is 52% nuclear, 27% natural gas, 17% renewable and 4% coal (International Panel of Climate
Change, IPCC 2016). The production system was a natural gas condensing boiler with a 92% of the lower heating value (PCI) efficiency. Type of energy for heating: natural gas boiler; Type of energy used for domestic hot water: natural gas boiler.
Regarding water consumption: Performance of the drinking water network: 80%;Cold water consumption: 100 litres/person/day (Walloon average, [State of the Environment Unit, 2018]); Hot water consumption: 40 litres/person/day (Walloon average, [State of the Environment Cell, 2018]); No dry toilets.
Regarding the waste use, the policy of selective sorting of waste is also considered (Less of waste.wallonie.be). This sorting is considered equal to 90% for glass waste and 75% for paper and cardboard. Thus, this proportion of waste is considered recycled and not land filled. According to Belgian statistics, 40% of the 1500g of daily household waste per person is sent to incineration with a yield of 85%. The distances from the site to the garbage dump are 10km, 100km to the incinerator and 50km to the recycling site. We considerate the life time of frames and windows: 30 years; the lifetime of coatings: 15 years overall service life of equipment: 20 years.
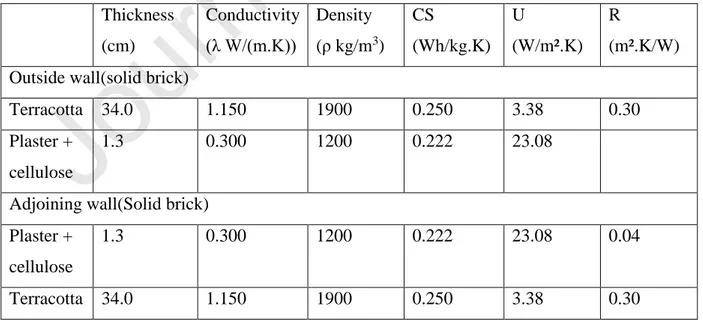
We also take into account in our study the mobility component. Thus, the environmental impact of the occupants' daily trips is calculated. We consider that 80% of occupants make a daily commute. For other occupants, an average distance of 20 km is indicated for commuting to work. They were carried out 5 days a week, 47 weeks a year. Some characteristics of buildings are shown in table2.The windows are in Glass wool (0.9mx0.7m).
Table 2. Characteristics of buildings. Thickness (cm) Conductivity (λ W/(m.K)) Density (ρ kg/m3) CS (Wh/kg.K) U (W/m².K) R (m².K/W) Outside wall(solid brick)
Terracotta 34.0 1.150 1900 0.250 3.38 0.30
Plaster + cellulose
1.3 0.300 1200 0.222 23.08
Adjoining wall(Solid brick) Plaster +
cellulose
1.3 0.300 1200 0.222 23.08 0.04
Journal Pre-proof
11 Plaster + cellulose 1.3 0.300 1200 0.222 23.08 0.04 Floor(Old floor) Light tree 2.5 0.150 500 0.333 6.00 0.17 Mortar 3.0 1.150 2000 0.233 38.33 0.03 Floor tile 2.0 1.700 2300 0.194 85.00 0.01 Roof(Attic) Glass wool 20.0 0.041 12 0.233 0.20 4.88 Plaster board BA 13 1.3 0.325 850 0.222 25.00 0.042.6.2. Neighbourhood scale data
Once the LCAs of the different buildings were completed, it was important to aggregate the results and add all the impacts emanating from the neighbourhood. We are moving here on a larger scale. In the same way, as we did for buildings, we provide some key data about the site. As, another study carried in the same city [29], we have assumed in this study that: (i) the transportation distances between the plant and the waste management site are also the same as those specified for the previous buildings, (ii) the rainfall is 1000 l/m².year. Some of this water was directed to the network and should be subject to specific treatment. Another part was directed to water retention systems; (iii) we consider, in the basic case, the absence of rainwater harvesting systems to measure the impact of their presence later, (iv) underground water and wastewater networks were considered; (v) After carrying out a rapid survey, we count 1200m of pipelines dedicated to drinking water and as much dedicated to wastewater. The drinking water system was 50% polyethylene and 50% ductile iron. The length of the network (Calculated by thinking of the network in the middle of the road and connection for each house), was estimated at 774 m (Neupre neighbourhood), and 530m (Maghin).It was also considered that the wastewater network had a lifetime of 75 years with the network losses estimated at 3%, while the periodicity of maintenance was fixed at 40 years. Open spaces are also taken into account and detailed in Table 3.
Journal Pre-proof
12
Road Street Driveway,
parking Garden, green area Impermeable (%) 95 90 85 40 Snow (day/year) 0 0 0 0 Shearing (per year) 0 0 0 5
Lighting level normal normal normal normal
Lighting type sodium sodium sodium sodium
Lighting load(kWh/m²/year) 4.8 4.8 4.8 - drinking water used (l/m²/year) 10 09 09 60 Waste(kg/m²/year) 25 25 25 3 Lifetime (year) 100 100 100 100 Gain (%) 10 10 10 10 3. Simulation tools
In this study, we have combined three software such as ALCYONE, COMFIE-PLEIADES and nova EQUER. It is important to notice that each of these software as a precise function. All these software programs are regularly used by numerous international research
laboratories and has been clearly validated by the scientific community [36- 42].The Analysis chain is as follows (see Figure3).
ALCYONE is a graphical input tool. It allows describing the geometry of a building to represent its solar masks and to define the composition of the walls [39]. In addition, using this software, we defined the zoning of the building where the thermal behaviour is
homogeneous [37].This software is essentially made up of five components: Generals (Construction Data, the Project Library, LCA Association, Weather and Horizon); Plan;STD,3D; Calculation.
Journal Pre-proof
13
COMFIE-PLEIADES allows us to perform the dynamic thermal simulation for buildings [39]. The geometry created via ALCYONE can be imported from the information entered concerning the materials, the occupation scenarios and the meteorological data. The software evaluates the heating and air conditioning needs. It is possible to disaggregate the results by thermal zone or by a period of time. The calculation engine is the COMFIE kernel and the graphical interface is PLEIADES [43-44].
Nova-EQUER is the environmental quality assessment tool. The requirements calculated in COMFIE are exported and additional inputs are provided to complete the LCA. It includes data such as the energy mix, the mobility of users, the constitution of outdoor spaces and networks. The software then performs the LCA of the buildings and presents the results in the form of radars compiling different impacts with the possibility of visualizing the part of each phase of the life cycle and comparing different variants of the same project [45-46].
4.Results
To facilitate the comparison of the study results, it is necessary to have an equivalent functional unit between the two neighbourhoods studied. To do this, it must just indicate in "unit of reference" nova-EQUER software that we have 30 buildings forthe Maghin islet and 10 dwellings in the Neupre neighbourhood. This option of novaEQUER makes it possible to reduce the results to the indicated unit of reference and thus to be able to exploit the results. 4.1. Analysis of dynamic thermal simulation
In urban areas (Maghin neighbourhood), the heating zone was estimated at 4246.98 m², with average heating requirements of 160.7 kWh/m²; while in the suburban area (Neupre),the heating area was 2,837.26 m² with an average heating requirement of 195.1 kWh/m². These results mean that, the heating energy demand per meter square depends on building characteristics and use.In the literature, previous researches showed that a Walloon house from the 19th century has a heating requirement between 190 and 200 kWh/m² [34, 48]. This confirms that there was no modelling error for the Neupre district. Concerning Maghin neighbourhood, it is normal that the need of heating buildings either lower than Neupre neighbourhood. It can be due to the presence of terraced houses. The terraced houses are contiguous with each other and therefore have at least one wall in common, which reduces heat losses and thus the need for heating the house. Globally, acidification, waste product, Eutrophication, photochemical ozone, biodiversity damage and health damage are more significant in Suburban than urban.
The table4 shows a comparison of LCA per unit in the two neighbourhoods. Table4. Some environmental impacts per unit.
Journal Pre-proof
14
Environmental impacts
Neighbourhood per inhabitant per m² dwelling unit
Greenhousegas (kgCO2/year) Urban 5083.5 295.2 15589.3 Suburban 17321.6 294.1 46768 Energy (GJ) Urban 96.7 5.6 296.7 Suburban 275.8 4.7 744.9 Acidification (kg SO2eq.) Urban 17.4 1.1 53.5 Suburban 50.76 0.9 137.1 health damage(DALYS) Urban 0.0036 0.0002 0.0112 Suburban 0.0145 0.0002 0.0394 Photochemical ozone product (kg ethylene eq.) Urban 0.68 0.04 2.11 Suburban 2.53 0.04 6.8 Odor (Mm3 air) Urban 105.7 6.14 324.3 Suburban 288.5 4.90 927.8 Waste product (t) Urban 2.87 0.17 8.81 Suburban 14.22 0.24 38.42
Regarding these two neighbourhoods, the greenhouse effect emission per inhabitant is higher in urban islet than suburban. However, the emission of greenhouse effect emission per square meter is higher in urban (295.2 kgCO2/year), than suburban (294.1 kgCO2/year).Energy consumption per square meter, is 16% higher in urban than suburban neighbourhood. Overall,by considering “dwelling unit”,it is seen that, all the different impacts are more important in suburban than urban. Large living area and also low density in suburban can be, one of origin. Some findings found in this study are similar at those showed by Trigaux et al. [56]. In 2013, Buyle et al.[49] showed that the behaviour of the inhabitants is a particularly difficult factor to predict which influences the energy consumptions and thus the results of an LCA, whatever the quality of this one.
4.2.Analysis of the influence of the indicators
We apply to this phase of the study the LCA of the two neighbourhoods was conducted and the influencing parameters were identified. This analysis focuses on 12 impact indicators representative of the sum of the four phases of a neighbourhood’s life cycle (construction, use, renovation, and demolition).The aim here is to determine which of these 12 indicators are
Journal Pre-proof
15
most affected by the geographical location of the different neighbourhoods (Urban or Suburban). The functional unit is always applied to these results. The LCA results of the studied neighbourhoods are shown in Figure4.
By analysing the Figure 4,compare to an eco-neighbourhood [32], it was noted that the two studied neighbourhoods had the most significant and different impacts on most of the criteria, mainly eutrophication, except for the greenhouse effect indicators and the production of photochemical ozone. Therefore, we particularly focused on the difference in eutrophication (its impact is the farthest between the two neighbourhoods). Eutrophication (kg PO4 eq) is the major release of nutrients (nitrates, phosphates, and organic matter) into an aquatic
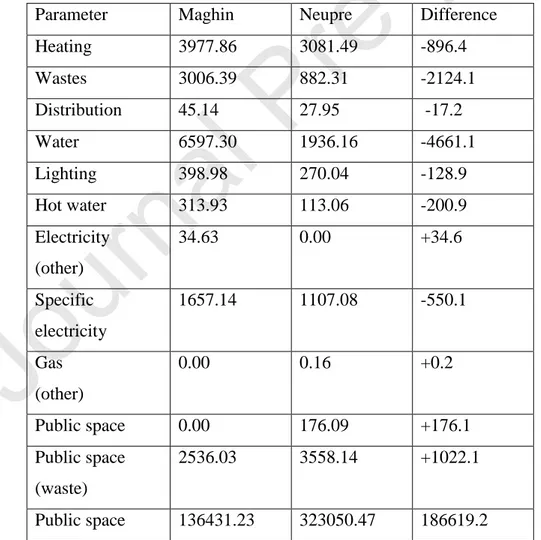
environment. This has the effect of accelerating the proliferation of algae and aquatic plants that will deplete the oxygen medium, and thus kill other living organisms (animals and plants). Figure 5 shows each phase of the eutrophication life cycle. Given the importance of the use phase, it is interesting to determine which assumptions lead to this difference.Table5 shows eutrophication in the use phase.
Table 5. Eutrophication in the utilization phase according to the configured parameters (kg PO4 eq).
Parameter Maghin Neupre Difference
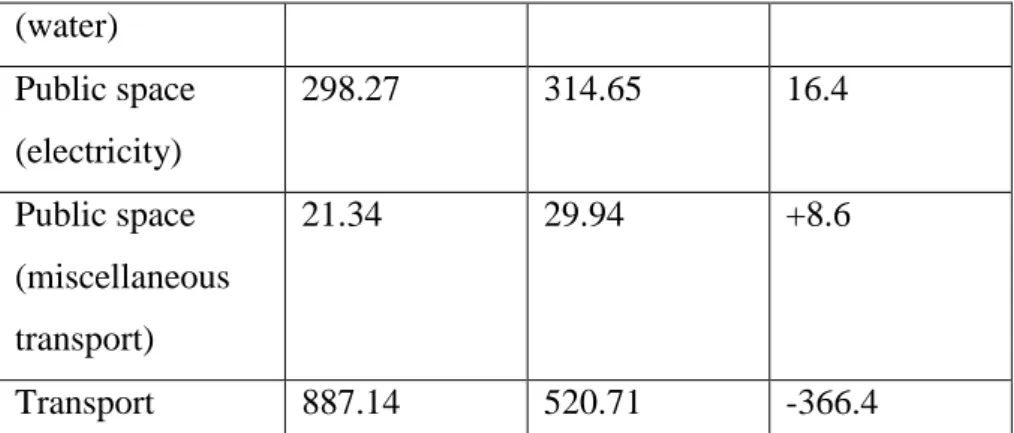
Heating 3977.86 3081.49 -896.4 Wastes 3006.39 882.31 -2124.1 Distribution 45.14 27.95 -17.2 Water 6597.30 1936.16 -4661.1 Lighting 398.98 270.04 -128.9 Hot water 313.93 113.06 -200.9 Electricity (other) 34.63 0.00 +34.6 Specific electricity 1657.14 1107.08 -550.1 Gas (other) 0.00 0.16 +0.2 Public space 0.00 176.09 +176.1 Public space (waste) 2536.03 3558.14 +1022.1 Public space 136431.23 323050.47 186619.2
Journal Pre-proof
16 (water) Public space (electricity) 298.27 314.65 16.4 Public space (miscellaneous transport) 21.34 29.94 +8.6 Transport 887.14 520.71 -366.4In order to determine which parameter has the greatest influence on eutrophication during the use phase, we calculated the eutrophication variation between neighbourhoods according to each parameter, as shown in table 4.Thus, we realized that eutrophication is due to the watering of public space. In addition, the Neupre neighbourhood has nearly four times more public space than the islet of Maghin and more than 70% of this public space is made up of green spaces. Indeed, by doing a deep statistical analysis of the data, it was found that in Maghin neighbourhood, the public area was estimated from 4479.43 m2 without planning ofgreen space, while in Neupre neighbourhood, the public area was estimated from
17721.20m2, with 12 995.90 m² of green space. It is therefore logical that eutrophication is more important for the suburban area than in the urban area. Table 6 givesmore details on the phases.
Table 6. Different phases of LCA.
Construction Operation Renovation Demolition
Urban 4.5% 85.8% 6.2% 3.4%
Suburban 2.2% 94.1% 2.3% 1.4%
Both 3.4% 89.9% 4.2% 2.4
As shown in table6, the operation or use phase is the most important (89.9%). This finding confirms the results found by Lotteau et al. [50] who showed that the utilization phase of building produces the most important environmental impacts quantity. It is interesting to notice that the maintenance and demolition rates are more significant in an urban
neighbourhood than Suburban. 4.3. Sensitivity analysis
The previous comparative study did not allow us to answer precisely to our first questions which were the influence of the journeys and the development of the public space on the
Journal Pre-proof
17
environmental impacts. As a result, we chose to conduct two sensitivity studies on these two areas.
4.3.1.Influence of daily paths
To determine the influence of transportation on environmental impacts, only the Neupre neighbourhood was analysed. Any input data in the nova-EQUER tool was shown in Table 7. Table7. Applied data to the different studied cases.
Base Case1 Case2 Case 3
Occupant doing the daily path (%)
100 100 100 50
Distance of the weekly path home-trade
(m)
1000 7000 7000 7000
Distance to the transit system (m)
500 2000 2000 2000
Distance of daily path home-work (m)
5000 12800 12800 12800
Presence of cycle path no no yes yes
The case of "Base" corresponds to the first modelling carried out on the Neupre neighbourhood for the comparison with the Maghin neighbourhood. The distances are therefore those applied by default by novaEQUER. In “case 1”the real distances between Home and Workplace(centre of Liege), Home-Trade (district Sart-Tilman) and Home-Bus of the district of Neupre was considered. For “Case 2”, only the bike path is added. And finally, for Case 3, we considered that only 50% of the population of the studied neighbourhood was on a daily path.Figure 5 showed a comparison diagram of environmental impacts.
This figure shows that the length of daily trips made by the population, but also the presence of public transportation and bike path have no real influence on the environmental impacts in general. The most important difference is in the production of photochemical ozone. This is easily explained because this is due to the decomposition of volatile organic compounds (produced by cars) under the effect of solar radiation, this causes "smog" (fine particles and ozone) that is bad for the respiratory tract. The paths for cases 1, 2 and 3 are longer, so the formation of photochemical ozone increases. For case 3, it decreases slightly because fewer people are moving around.
Journal Pre-proof
18
4.3.2. The influence of the water management
For this sensitivity study, we focused on the presence of water retention systems, andthe storage of rainwater. These systems make it possible to avoid increasing the volume of wastewater during heavy rains. Indeed, in this method:
(a) The tanks of rainwater recovery are modelled: Rainwater used for watering gardens, cleaning outdoor and indoor spaces flushing toilets, and washing machine. Rainwater
managed by a segregated network consisting of cisterns, bodies of water, valleys, ditches. The water of gardens, and alleys,taken by ditches and valleys, then directed to a body of water. The water recovered on the roofs is stored in tanks. All of the site's rainwater is managed by a sewerage system and no part of this water will be taken over by the wastewater network. Soils keep their initial permeability.
(b) Permeable floors: Alleys, squares and car parks are covered with unrepaired concrete pavements and, concrete-grass slabs. The totality of water not infiltrating directly into the soil, it is sent to the wastewater network. The total impermeability of the site decreases to 58%, once the permeable pavements are used.
To do this, it was enough to change on nova-Equer the parameter "Runoff of water bodies (%)". This parameter refers to the percentage of rainwater that will be redirected to water retention systems and not to the storm water system. We conducted this study in Maghin (urban district of Liege). Some of the results are shown in Figure 7.
It is important to note that the presence of water retention systems significantly reduces environmental impacts and in particular eutrophication, waste produced, acidification and damage to health. This reinforces the trend of importing this equipment into our current development projects to minimize the impact on the environment.
5. Discussion
It is often easy to quickly make comparative LCA of buildings. At the neighbourhood level, the comparative analysis between different studies becomes very difficult. Indeed, the working hypotheses vary from one place to another. All the cities are built with different plans and structures. A calculation hypothesis used in one study, may not be accepted in other research. In this study, the demolition phase represents the 2.4% of total environmental impacts.This result is almost similar to conclusion of Blengini[23] who showed that the demolition phase represent0.2–2.6% of total impact environmental emission;
Applied LCA at neighbourhood level requires lot of concentrations and works which lead most researchers to carry out their study at the building level. In Figure 4, it is important to note that the 12 indicators applied have a significant effect on the environmental impact in
Journal Pre-proof
19
both neighbourhoods. Indeed, it is noted that the production of “photochemical ozone", and "the greenhouse effect", affected the two neighbourhoods almost the same way, while the impact of "eutrophication", is very distant from each other, in both neighbourhoods. The Eutrophication concentration is higher in the suburban area than urban, because of the presence of an important area of green space. Generally, to conduct studies aimed at developing sustainable neighbourhoods, the impact of the built environment (presence of vegetation, urban morphology, and selection of design materials) on the demand for energy in habitats must be evaluated. The results obtained after the analysing of the twelve applied impacts showed that the use phase is the most important of the four studied stages
(Construction, Use, Renewal, and Demolition). This statement confirms the results found by several researchers [48-50].The sensitivity analysis showed that the impacts of different daily journeys and the management of public spaces can significantly affect the results of the analysis of the life cycle in a neighbourhood. It is possible to increase the energy performance of an old building by performing heavy renovation techniques [53-54].This is more important as LCA show that the use phase is very crucial in terms of energy consumption. This study also highlights the influence of the location and design of a neighbourhood on the
environment and requires the extreme urgency or the need for global energy analysis, taking into consideration both building and transportation, which are rarely highlighted. Despite this, it is noted that consumption due to travel between home and work, or between home and shopping centre, plays an important role in the LCA, especially when these trips are made regularly.Like all other research on LCA of a neighbourhood, this study has several limitations that should be solved in future researches[55-56]. Indeed, in the transportation sector, all the different types of the journey were not taken into account in the simulation tools. Simulation results are still slightly different from reality due to the software's design stage and changing weather conditions[57]. The simulation tools admit only a limited number of buildings.
6. Conclusion
This research aims to conduct a LCA in two old neighbourhoods located in urban and sub-urban areas over 100 years and located in the Liege region. LCA is a tool that can serve as a decision aid, but also allows to target the phases of the life cycle of a product that would need to be reworked with an eye to the environment. LCA allows performing different types of comparative studies. Despite the novelty of the LCA application at the neighbourhood level, it is considered the most reliable method. It is a challenge and a fascinating research topic to test the application of the LCA method applied to buildings at the neighbourhood scale. The
Journal Pre-proof
20
difference in environmental impact between an urban and suburban district is linked to transportation, or to the daily paths of the populations, but especially to the management of public space (water treatment, waste). The 90% of the environmental impact rate comes from operation phase of the life cycle. The typical problems of urban development are to be treated as a priority, given their considerable influence on the LCA of a neighbourhood.Thus, once these urban issues are taken into account, the parameters influencing the scale of the building become in significant.This study was focused on a theme that was urgent to study but, many other parameters remain to be studied in order to provide designers with complete lines of conduct. Thus, this work remains open and will be completed at the scale of a great metropolis and a country. A deepen comparison of the different environmental impacts coming from Old and New neighbourhood, is an important outlook for this study.
Acknowledgment
The authors acknowledge the AXA Company for their financial support in this work and the LEMA laboratory team of University of Liege, in which this research could take place.
Journal Pre-proof
21
Reference
[1] Liébard, A. & de Herde, A.,
(2006).Traitéd’architectureetd’urbanismebioclimatiques.Concevoir, édifieretaménager avec le développement durable.Baume-les-Dames. Book, 1-776.
[2]UIA, (1993). Final report of UIA World Congress. Chicago: UIA.
[3] IPCC (2007). Climate Change: The Physical Science Basis. Contribution of Working Group I to the Fourth Assessment Report of the Intergovernmental Panel on Climate Change, Cambridge University Press 1(21).
[4] IPCC (2014).Climate change: Impact, adaptation and vulnerability. Summary for Policymakers, working group ii contribution to the fifth assessment report of the climate, CambridgeUniversity Press, 1(34).
[5] Nematchoua MK.,Ricciardi P., José A. Orosa,Cinzia Buratti.(2018).A detailed studyofclimate change and some vulnerabilities in Indian Ocean ; a case of Madagascar island.Sustainable Cities and Society.Sustainable Cities and Society 41, 886–898. [6] European Commission. (2011). Roadmap to a Resource Efficient Europe.
[7] Sigrid Reiter. (2010)Life Cycle Assessment of Buildings – a review.Arcelor Mittal International Network in Steel Construction, Sustainability Workshop and Third Plenary Meeting, Bruxelles, Belgique,1(19).
[8] Huberman N., Pearlmutter D., 2008. A life-cycle energy analysis of building materials in the Negev desert, Energy and Buildings 40: 837–848.
[9]Hertwich EG., 2005. Life cycle approaches to sustainable consumption: a critical review. Environ SciTechnol 39(13):4673–84.
[10] ISO (international Standardization Organization), 2006. ISO 14040. Environmental management –Life cycle assessment – Principles and framework.
[11] ISO, (2006). ISO 14044. Environmental management – Life cycle assessment – Requirementsand guidelines.
[12] Benoit C andMazijn B,.(2009). Guidelines for social life cycle assessment of products: a social and socio-economic LCA code of practice complementing environmental LCA and Life Cycle Costing, contributing to the full assessment of goods and services within the context of sustainable development. Department of Conflict and Development Studies. ISBN 9789280730210, 1(104).
[13] Stephan A., Crawford R H., MyttenaereK,. (2013)A comprehensive assessment of the life cycle energy demand of passive houses. Applied Energy 11223–34.
Journal Pre-proof
22
[14] Luisa F.Cabeza,LídiaRincón,VirginiaVilariño,GabrielPérez,Albert Castell. (2014)Life cycle assessment (LCA) and life cycle energy analysis (LCEA) Of buildings and the building sector: A review.Renewable and Sustainable Energy Reviews 29, 394–416.
[15] Kellenberger D.,Althaus HJ. (2009) Relevance of simplifications in LCA of building components.Building and Environment 44 818–825.
[16]Bribián IZ, Capilla AV,Usón AA. (2011)Life cycle assessment of building materials: Comparative analysis of energy an environmental impacts and evaluation of the eco-efficiency improvement potential.Building and Environment 46,1133 1140.
[17] VilchesA., Martinez G., Montanes BS.
(2017).Lifecycleassessment(LCA)ofbuildingrefurbishment:Aliterature review.Energy and Buildings 135 286–301.
[18] Ramesha T.,RaviPrakasha,K.K.Shukla.Life cycle energy an alysis of buildings:Anoverview.Energy and Buildings 42 (2010)1592–1600.
[19] Peuportier, B., Popovici, E., &Troccmé, M. (2006). Analyse du cycle de vie à l’échelle du quartier, bilanet perspectives du projet ADEQUA. Build. Environ.2013.03.017.
[20] Modeste Kameni Nematchoua, José A. Orosa, Sigrid Reiter(2019). Life cycle assessment of two sustainable and old neighbourhoods affected by climate change in one city in Belgium: A review. Environmental Impact Assessment Review 78 (2019) 106282.
[21]Szalay, A.Z.-Z.(2007)WhatismissingfromtheconceptofthenewEuropeanBuilding Directive? Building and Environment 42 (4) 1761–1769.
[22]García-Casals, X. (2006). Analysisofbuildingenergyregulationandcertificationin Europe:theirrole,limitationsanddifferences,EnergyandBuildings38(5) 381–392.
[23]Blengini, G.-A. (2009a). Life cycle of buildings, demolition and recycling potential: a case study in Turin. Building and Environment, 44, 319–30.
[24] Blengini, G.-A., & Di Carlo, T. (2009b). The changing role of life cycle phases, subsystems and materials in the LCA of low energy buildings. Energy and Buildings, 42, 869–80.
[25]Börjesson, P., &Gustavsson, L. (2000). Greenhouse gas balances in building construction: wood versus concrete from life-cylce and forest land-use perspectives. Energ Policy, 28, 575-88.
[26] Loiseau, E., Junqua, G., Roux P.,&Bellon-Maurel, V. (2012). Environmental assessment of a territory: an overview of existing tools and methods. Environ. Manage 112, 213-225. http://dx.doi.org/10.1016/j.jenvman.2012.07.024.
Journal Pre-proof
23
[27]Anderson, J.E., Wulfhorst, G., & Lang, W. (2015). Energy analysis of the built environment - A review and outlook. Renew. Sustain Energy Rev., 44, 149-1581.
[28] Oliver-Sol, J., Josa, A., Arena, A.P., Gabarrell, X., &Rieradevall, J. (2011). The GWP-Chart: an environmental tool for guiding urban planning processes. Application to concrete sidewalks, Cities 28, 245-250.
[29]Modeste Kameni Nematchoua, Jacques Teller, Sigrid Reiter. Statistical life cycle
assessment of residential buildings in a temperate climate of northern part of Europe. Journal of Cleaner Production 229 (2019) 621-631.
[30] Chau C.K., Leung,W.Y.Ng. (2015)A review on Life Cycle Assessment, Life Cycle Energy Assessment and Life Cycle Carbon Emissions Assessment on buildings.Applied Energy 143, 395–413.
[31] Trigaux D.,Oosterbosch B., Troyera F., Allacker K. (2017) Adesign tool to assess the heating energy demand and the associated financial and environmental impact in
neighbourhoods.Energy and Buildings 152 516–523.
[32]Nematchoua MK.,Reiter S..(2019)Life cycle assessment of an eco-neighborhood: influence of a sustainable urban mobility and photovoltaic panels.IAPE '19, Oxford, United Kingdom ISBN: 978-1-912532-05-6.DOI: http://dx.doi.org/10.17501.
[33]ecoinvent LCI database. https://simapro. com/databases/ ecoinvent/?gclid= CjwKCA jwsdfZBRAkEiwAh2z65sg-fOlOpNksILo.Web site consultedin 2017.
[34] HUBERT M., HUYNEN P., LEBRUN K.,PATRIARCHE G., WITTE A., CREEMERS L., DECLERCQ K., JANSSENS D.,CASTAIGNE M.,HOLLAERT L., WALLE F. La MobilitéenBelgique (2010), resultants de l’enqueteBELDAM.Book, 1(352).
[35]Brouwers J.,Peeters B.,Van Steertegem M, MIRA Unit, VMM Nicole van Lipzig, Hendrik Wouters, JochemBeullens, Matthias Demuzere. about observed and future climate changes in Flanders and Belgium.MIRAClimate Report 2015.1(152).
[36] Salomon, T., Mikolasek, R., &Peuportier, B. (2005). Outil de simulation thermique du bâtiment, COMFIE, from Journée SFT-IBPSA, Outils de simulation thermo-aéraulique du
bâtiment, La Rochelle, 8 p.
[37] Colombert, M., De Chastenet, C., Diab, Y., Gobin, C., Herfray, G., Jarrin, T., &Trocmé, M. (2011). Analyse de cycle de vie à l’échelle du quartier: unoutild’aide à la décision? Le cas de la ZAC Claude Bernard à Paris (France). EnvironnementUrbain/Urban Environment, 5, c1–c21.
Journal Pre-proof
24
[38] Stella T.( 2015 ). Optimizing indoor climate conditions ina sports building located in Continental Europe. 6th International Building Physics Conference, IBPC 2015.Energy Procedia 78, 2802 – 2807.
[39] Salomon T, Mikolasek R, Peuportier B. 2005, Outil de simulation thermique du bâtiment, COMFIE. Journée SFT-IBPSA. Outils de simulation thermo-aéraulique du bâtiment:8
[40] OliverKinnan,DerekSinnott,WilliamJ.N.Turner. (2016). Evaluation of passive ventilation provision in domestichousingretrofit.Building and Environment 106 205 218.
[41]Jolliet o., Saadé M.,Grettaz P.,Shaked S. 2010. Analyse du cycle de
vie:comprendreetréaliser un écobilan. 2e éditionmise à jour etaugmentée.Lausanne:
PressesPolytechniques et universitaire, Collection gérerl'environnement,. ISBN: 978-2-88074-886-9.
[42] Roux C., Schalbart P., PeuportierB.Analyse de cycle de vie conséquentielleappliquée à l’étuded’unemaisonindividuelle.Conférence IBPSA 2016, May 2016, Champs-sur-Marne, France. 〈http://www.ibpsa.fr/index.php?option=com_content&view=article&id=136:ibpsa-france-2016-23-a-24-mai-champs-sur-marne&catid=1:conferences&Itemid=55
[43] Kemajou A., Mba L. (2011)Matériaux de construction et confortthermiqueen zone chaude Application au cas des régionsclimatiquescamerounaises.Revue des Energies Renouvelables Vol. 14 N°2 239 – 248.
[44]Bacot P.,Neuveu A., Sicard J., 1984. Analyse modale des
phenomenesthermiquesenrégime variable dans le batiment, Revue Génerale de Thermique, n267, Paris,.
[45]Blay D., 1984Comportement et performance thermiqued’un habitat bioclimatique à serreaccolée, BatimentEnergie n45, 1984.
[46] Scientific assessmentworking group of IPCC, Radiative forcing of climate change, world meteorologicalorganizationand United nation environment programme,,28.
[47]Stevanovic M.,Allacker K.,Vermeulen S.(2019)Development of an Approach to Assess the Life Cycle Environmental Impacts and Costs of General Hospitals through the Analysis of a Belgian Case.Sustainability, 11, 856; doi:10.3390/su11030856
[48]MariqueAF.,Reiter S. 1994. Asimplifiedframeworktoassessthe feasibility of zero-energyattheneighbourhood/communityscale.Energy and Buildings 82 (2014) 114–122. [49] Buyle, M., Braet, J., &Audenaert, A. (2013). Life cycle assessment in the construction sector: a review. Renewable and Sustainable Energy Re-views, 26, 379-388. doi:
Journal Pre-proof
25
[50] Lotteau, M., Loubet, P., Pousse, M., Dufrasnes, E., &Sonnemann, G. (2015a). Critical review of life cycle assessment (LCA) for the built environment at the neighborhood scale.
Building and Environment, 93, 165–178. https://doi.org/10.1016/j.buildenv.2015.06.029
[51] Peuportier, B., Popovici, E., &Troccmé, M. (2006). Analyse du cycle de vie à l’échelle du quartier, bilanet perspectives du projet ADEQUA. Build. Environ.2013.03.017.
[52] Reap, J., Roman, F., Duncan, S., & Bras, B. (2008). A survey of unresolved problems in life cycle assessment: Part 2: impact assessment and interpretation. The International Journal of Life Cycle Assessment, 13(5), 374-388. https://doi.org/10.1007/s11367-008-0009-9 [53] Sartori I., Napolitano A., Voss K., (2012) Net zero energy buildings: a consistent definition framework, Energy and Buildings 48 220–232.
[54]Mohamed A.,Hasan A.,Sirén K.,
(2014)Fulfillmentofnet-zeroenergybuilding(NZEB)withfourmetricsinasinglefamilyhousewithdifferentheatingalternati ves, AppliedEnergy114385–399
[55] Trigaux D., Allackera, K., F. De Troyera De, ( 2017 ) Life Cycle Assessment of Land Use in Neighborhoods.Procedia Environmental Sciences 38,595 – 602.
[56] Trigaux, D. K. Allacker K., De Troyer. F.2014. Model for the environmental impact assessment of neighbourhoods. WIT Transactions on Ecology and The Environment, Vol 181,© WIT Press www.witpress.com, ISSN 1743-3541 doi:10.2495/EID140091, 103-113. [56] Modeste Kameni Nematchoua, Paola Ricciardi, Cinzia Buratti. Statistical analysis of indoor parameters an subjective responses of building Occupants in a hot region of Indian ocean; a case of Madagascar island. Applied Energy 208 (2017) 1562–1575.
Journal Pre-proof
26
List of figures
Figure1.Location of the two studied neighbourhood in the Province of Liege.
Journal Pre-proof
27
Figure2b. Suburban neighbourhood of Neupre(Belgium)
Journal Pre-proof
28
Figure4.Comparative diagram of the environmental impacts of the two studied neighbourhoods .
Figure5.Eutrophication for each phase of the life cycle for both studied neighbourhoods.
-50,000.00 0.00 50,000.00 100,000.00 150,000.00 200,000.00 250,000.00 300,000.00 350,000.00
Construction Utilization Renovation Demolition
Eu tro p h icatio n (kg p o 4 eq .) Maghin Neupré
Journal Pre-proof
29
Figure 6. Comparative diagram of environmental impacts based on daily trips made.
Figure7.Comparative diagram of environmental impacts based on the presence of water retention systems.
Journal Pre-proof
30
Appendix
Appendix1. Global result
Impact Maghin Nepreu
Greenhouse gas(100year) (tCO2 eq.) 46767.99 46768.31 Acidification (kg SO2eq.) 103697.12 137066.84
Cumulative Energy Demand (GJ) 890057.00 744864.51 Waste water (m3) 853641.58 645104.70 Waste product (t) 26433.70 38420.74
Depletion abiotic resource (kg antimony eq.)
325657.06 280476.66
Eutrophication (kg PO4 eq)
160474.06 338115.54
Photochemical ozone product (kg ethylene eq.) 6344.67 6854.02 Biodiversity damage (PDF.m2.year) 3170051.89 4088092.63 Radioactive waste (dm3) 959.99 784.32 health damage (DALYS) 33.57 39.39 Odour (Mm3air) 972758.16 778960.61
Journal Pre-proof
31
Appendix 2. One example of the detailed result: Greenhousegas (100year) (tCO2 eq.)
Stage Use Maghin Nepreu
Construction 1660.31 995.99
Equipment 299.31 103.21
Window 37.50 16.05
Wall 992.49 504.01
Public space: coating 161.31 200.61 Public space: various transportation 26.03 31.07 Public space: wastes 2.25 2.69
Door 0.15 0.05 Floor 115.19 124.91 Transport 26.08 13.39 Utilisation 43581.60 45089.40 Heating 24414.26 18912.77 Wastes 1584.73 465.08 Distribution 54.95 34.03 ECS 2572.01 926.30 Water 401.28 117.77 Lighting 485.74 328.76 Specific electricity 2017.50 1347.82 Public space: Electricity 363.14 127.88 Public space: various transportations 15.32 383.07 Public space: Wastes 5652.14 21.49 Public space: Water 5418.45 12855.72
Transport 602.09 1638.54
Renovation 1431.16 602.55
Equipment 1197.24 412.84
Window 75.01 32.11
Wall 50.89 33.73
Public space: coating 71.54 83.81 Public space: various transport 21.89 25.64 Public space: wastes 11.35 13.30
Door 0.31 0.10
Transport 2.95 1.02
Demolition 94.91 80.38
Wall 25.68 14.04
Public space: various transport 21.69 25.89 Public space: wastes 22.51 26.86