arXiv:0708.3005v1 [astro-ph] 22 Aug 2007
February 1, 2008
The Struve-Sahade effect in the optical spectra of O-type binaries
⋆
I. Main-sequence systems
N. Linder
1, G. Rauw
1,⋆⋆, H. Sana
2, M. De Becker
1,⋆⋆⋆, and E. Gosset
1,⋆⋆1 Institut d’Astrophysique et de G´eophysique, Universit´e de Li`ege, Bˆat. B5c, All´ee du 6 Aoˆut 17, B-4000 Li`ege, Belgium
e-mail: linder@astro.ulg.ac.be
2 European Southern Observatory, Alonso de Cordova 3107, Vitacura, Santiago 19, Chile
ABSTRACT
Aims.We present a spectroscopic analysis of four massive binary systems that are known or are good candidates to display the Struve-Sahade effect (defined as the apparent strengthening of the secondary spectrum of the binary when the star is approaching, and the corresponding weakening of the lines when it is receding).
Methods.We use high resolution optical spectra to determine new orbital solutions and spectral types of HD 165 052, HD 100 213, HD 159 176 and DH Cep. As good knowledge of the fundamental parameters of the considered systems is necessary to examine the Struve-Sahade effect. We then study equivalent width variations in the lines of both components of these binaries during their orbital cycle.
Results.In the case of these four systems, variations appear in the equivalent widths of some lines during the orbital cycle, but the definition given above can any longer be valid, since it is now clear that the effect modifies the primary spectrum as much as the secondary spectrum. Furthermore, the lines affected, and the way in which they are affected, depend on the considered system. For at least two of them (HD 100 213 and HD 159 176) these variations probably reflect the ellipsoidal variable nature of the system. Key words.stars: individual: HD 100213, HD 159176, HD 165052, DH Cep – binaries: spectroscopic – stars: fundamental parameters
1. Introduction
Massive early-type stars of spectral type O, because of their high temperature (Teff ≥30000 K) and luminosity (∼ 105- 106L⊙), play a key role in the ecology of galaxies. Indeed, these objects are responsible for the ionisation of gaseous nebulae, and lose a huge quantity of matter in the form of stellar winds (∼ 10−7
-10−5 M
⊙yr−1). A large fraction of these stars are actually bi-nary or multiple systems. Whilst this fact allows us to determine some fundamental properties of these stars, it also introduces other unexpected effects. One of the possible signatures of the interactions between the system’s components is the so-called
Struve-Sahade effect (S-S effect, hereafter). This effect is defined
as the apparent strengthening of the secondary spectrum of the binary when it is approaching, and the corresponding weaken-ing of its lines when it is recedweaken-ing (Bagnuolo et al. 1999). First reported by Struve (1937), this effect casts some doubt on the accuracy of massive binary parameters, such as masses and lu-minosity ratios. The first tentative explanation, essentially quali-tative, came from Struve (1950), who associated this effect with gaseous streams sweeping the trailing side of the secondary and then obscuring the secondary star when the latter is receding (see also Sahade 1959). More recently, Gies et al. (1997) pro-posed a completely different scenario. They argued that the bow shock produced by the encounter of the two stellar winds is
de-Send offprint requests to: N. Linder
⋆ Based on observations made at the European Southern Observatory
(La Silla, Chile) and at the Observatoire de Haute Provence (France).
⋆⋆ Research Associate FNRS, Belgium ⋆⋆⋆ Postdoctoral Researcher FNRS, Belgium
flected by the Coriolis force to a position above the leading at-mosphere of the secondary star. Assuming that the wind of the secondary star is the weaker one, the secondary’s surface would be heated by the proximity to the shock region and this would increase its contribution to the composite spectrum when it is approaching (deeper lines). The studies of Stickland (1997) and Bagnuolo et al. (1999) on IUE data of three massive binaries (HD 47 129, AO Cas and 29 CMa) did not allow them to de-termine the cause of the effect, but they concluded that these stars tell ‘a different tale’, and that the Struve-Sahade effect may arise from several distinct mechanisms. More recently, the theo-retical developments of Gayley (2002) and Gayley et al. (2007) have suggested that the Struve-Sahade effect could be linked to surface flows driven away from one star which would tend to compensate the rotational broadening of the component moving towards the observer (yielding narrower and deeper lines) and enhance the rotational broadening when the component is re-ceding (broader and shallower lines). While preliminary results indicate that this new scenario can produce variations similar to those seen in the S-S effect, detailed comparison with observa-tional data is still needed.
In this paper, we discuss a set of spectroscopic observa-tions of four early-type binaries. Our sample consists of main-sequence O-type stars with orbital periods of a few days. We derive new orbital solutions for these systems and analyse the variability of the spectral lines considering the Struve-Sahade effect.
Secondary Primary
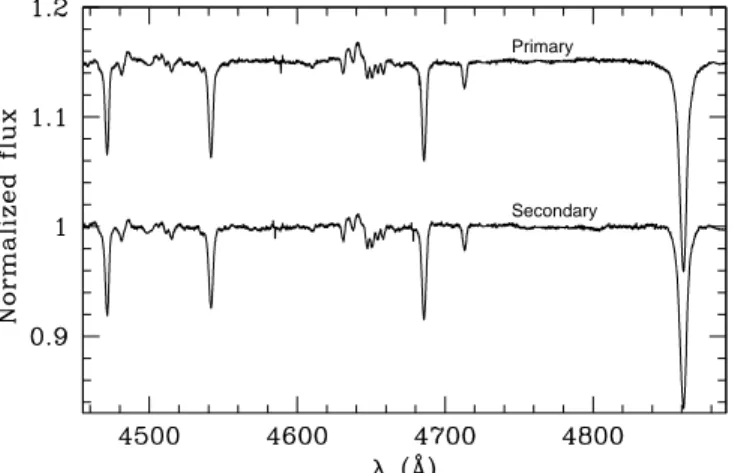
Fig. 1. Normalised disentangled spectra of HD 165 052, between 4455 and 4895 Å. The primary spectrum was vertically shifted by 0.15 units for clarity.
2. HD 165 052
HD 165 052 is a massive binary that probably belongs to the open cluster NGC 6530, in the Lagoon nebula (van Altena & Jones 1972). Its SB2 nature was first discov-ered by Conti (1974) and Morrison & Conti (1978) derived the first orbital solution from 20 optical spectra obtained with the Coud´e-feed telescope at Kitt Peak. They found a slight eccen-tricity (e = 0.06 ± 0.04), a period of 6.14 ± 0.002 days and similar spectral types (O6.5 V) for both components. Morrison (1975) observed this system without detecting any photomet-ric variation. Furthermore, Stickland et al. (1997) used IUE data to obtain a new orbital solution and the better quality of their data allowed them to find a period of 2.96 days. They as-sumed a zero eccentricity. Finally, Arias et al. (2002) analysed 73 spectra of HD 165 052, with different resolutions and spec-tral ranges (from 3900 to 7600 Å). They confirmed the period found by Stickland et al. (1997) but found an eccentricity equal to 0.09 ± 0.004. They used their new values of e and P to re-compute orbital solutions from older data and detected apsidal motion. In the X-ray domain, Corcoran (1996) detected a phase-locked variability in ROSAT archive data of HD 165 052, but this was based on the wrong value of the orbital period. This fact was however confirmed by Arias et al. (2002), who reanalysed the data using their new period. They observed phase-locked vari-ations of the X-ray flux with a rise of the emission near both quadratures and explained these modulations as a result of the presence of colliding winds in the system.
Observations of HD 165 052 were gathered at the European Southern Observatory (ESO), with the Fiber-fed Extended Range Optical Spectrograph (FEROS) mounted on the 1.5 m telescope at La Silla. Twenty one spectra were obtained be-tween 1999 and 2002, in the [3750, 8700] Å wavelength do-main. Typical exposure times range from 7.5 to 20 minutes and the mean signal to noise ratio (SNR) of the spectra is 340. The spectral resolving power of FEROS is 48000. The journal of ob-servations is presented in Table 1. The data were reduced us-ing an improved version of the FEROS pipeline (see Sana et al. 2003) working in the MIDAS environment. We mainly used the normalised automatically merged spectrum, and checked our re-sults on the individual orders in case of doubts.
Table 1. Journal of the observations of HD 165 052. The first column lists the heliocentric Julian date (HJD), the second pro-vides the phase as computed from our orbital solution (see Table 2) and the third and fourth ones give the radial velocities used to compute the orbital solution respectively for the primary and secondary stars. HJD Φ RV1 RV2 −2 450 000 (km s−1) (km s−1) 1299.7250 0.23 88.3 −100.8 1300.7319 0.57 −56.5 76.9 1300.9264 0.63 −86.7 96.6 1301.9281 0.97 31.2 −24.9 1304.7434 0.93 −80.1 103.7 1304.7507 0.93 96.3 −111.3 1304.9309 0.99 −87.7 106.8 1323.8361 0.39 −93.7 103.3 1327.6014 0.66 7.4 −1.7 1327.9127 0.77 15.0 −12.5 1670.7601 0.78 40.1 −39.5 1671.7225 0.11 17.9 −25.8 1672.7016 0.44 −15.9 28.7 2335.8879 0.86 −41.0 56.9 2336.8791 0.19 97.5 −118.5 2337.8880 0.53 −54.9 70.1 2338.8808 0.87 −46.1 47.8 2339.8848 0.21 96.9 −111.2 2381.8324 0.40 6.6 −5.7 2382.8569 0.75 −79.7 103.3 2383.8577 0.09 95.4 −103.1 2.1. Orbital solution
In order to calculate a new orbital solution, we applied a dis-entangling method to separate the two components of the sys-tem while simultaneously determining their radial velocities (Gonz´alez & Levato 2006). This consists of an iterative pro-cedure that alternatively uses the spectrum of one component (properly shifted according to its radial velocity) to subtract it from the observed spectra and to calculate an approximation of the spectrum of the other component. This technique is more powerful than the commonly used method of fitting a Gaussian profile to the studied lines, and allows us to determine the ra-dial velocities of both components at phases when the lines are heavily blended. The disentangled spectra of the components of HD 165 052 are shown in Fig. 1. Due to some residual uncertain-ties on the normalisation of the observed spectra, some artefacts appear in the disentangled spectra as low frequency modulations of the continuum level. The values of the radial velocities (RVs) found with this method are listed in the third and fourth columns of Table 1. The lines used for this calculation are He I λ 4471, Mg II λ 4481, He II λ 4542, He II λ 4686, He I λ 4713 and Hβ. The orbital solution itself was calculated with the program LOSP (Li`ege Orbital Solution Package) which is based on the method of Wolfe et al. (1967), subsequently modified to be applied to SB2 systems (Rauw et al. 2000; Sana et al. 2006). Table 2 gives the main orbital elements computed for HD 165 052, and the cor-responding uncertainties. As a first guess we adopted the period from Stickland et al. (1997) and allowed it to vary during the computation of the solution. The results obtained are close to the parameters of Arias et al. (2002), except for a slightly larger
K2and hence for somewhat larger masses. Fig. 2 shows the ra-dial velocity curve of HD 165 052 as a function of the orbital phase.
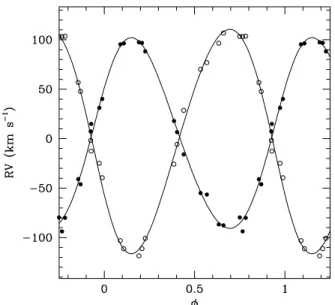
Fig. 2. Radial velocity curve of HD 165 052 calculated from the orbital solution of Table 2. Primary data are represented by filled symbols, while secondary data are represented by open symbols. The RVs have been determined through a disentan-gling of the primary and secondary spectra using the method of Gonz´alez & Levato (2006). Φ = 0 corresponds to the phase of the periastron passage (Φ = 0.93: secondary conjunction,
Φ = 0.15: primary’s ascending node, Φ = 0.41: primary
con-junction, Φ = 0.70: secondary ascending node).
Using the disentangled spectra, we determined the projected rotational velocities (v sin i) of the primary and secondary star applying the Fourier method (see Sim´on-D´ıaz & Herrero 2007; Gray 2005) to the profiles of the disentangled He I λ 4471, He II λ 4542 and Hβ line profiles. In this way, we determine values of 73 ± 7 and 80 ± 7 km s−1 for the primary and
sec-ondary component of HD 165 052 respectively. These values are similar, which suggests a synchronous rotation of the compo-nents since their spectral types, and hence radii, are very simi-lar. Furthermore, when we introduced the parameters of the sys-tem in the formula of Tassoul (1990), we found a circularisa-tion time of less than 33 500 years. However, we kept the eccen-tric solution as the best orbital solution for HD 165 052 (such as Arias et al. 2002), because of the better quality of the fit. Indeed, the rms of 9.0 km s−1is improved to 6.2 km s−1when we
con-sider an eccentricity equal to 0.08 instead of 0. Finally, if we suppose that the angular velocity of the system is equal to the in-dividual angular velocities of the stars (co-rotation), we find that the inclination of the orbit should be equal to 28◦
. This value is too large compared to the inclinations found by Stickland et al. (1997) and Arias et al. (2002) and leads to surprisingly small absolute masses. There is thus probably no synchronous co-rotation in HD 165 052.
2.2. Spectral type determination
A quantitative spectral classification for O-type stars has been developed by Conti (Conti & Alschuler 1971, and subsequent articles) and refined by Mathys (1988, 1989). This criterion is based on the ratio between the equivalent widths (EW) of He I λ 4471 and He II λ 4542. The equivalent widths were di-rectly measured on the spectra after a standard deblending of the lines, by fitting two Gaussian profiles to the data. This leads
Table 2. Orbital solution of HD165052. T0refers to the time of
periastron passage. γ, K and a sini are respectively the systemic velocity, the amplitude of the radial velocity curve, and the pro-jected separation between the centre of the star and the centre of mass of the binary system. Quoted uncertainties are the 1σ error bars.
Parameter Primary Secondary
P (days) 2.95515 ± 0.00004 e 0.081 ± 0.015 ω(◦ ) 298.0 ± 10.2 T0(HJD) 2451299.053 ± 0.081 γ(km s−1) 2.1 ± 1.2 1.4 ± 1.3 K (km s−1) 96.4 ± 1.6 113.5 ± 1.9 a sini (R⊙) 5.6 ± 0.1 6.6 ± 0.1 M sin3i (M ⊙) 1.5 ± 0.1 1.3 ± 0.1 Q (M1/M2) 1.18 ± 0.02 r.m.s. (km s−1) 6.2
to an O6 spectral type for the primary and O6.5 for the sec-ondary. The uncertainties on these numbers (at least partially due to the S-S effect, see Sect. 2.3) correspond to a range for the primary between O6 and O6.5, and for the secondary be-tween O6 and O7. As a second step, equivalent widths were mea-sured on the disentangled spectra and the corresponding spec-tral types are O6.5 + O7. In agreement with Mathys (1988), the fact that the He II λ 4686 line is seen in absorption, with-out any hint of an emission component, suggests that the lumi-nosity class of both stars is V. For spectral types O7 and ear-lier, Mathys (1988) proposed EWλ(4686) = 0.56 Å as a de-marcation between the giant and main-star luminosity classes. If we take the optical brightness ratio of the system into ac-count (L1L
2 = 1.55), our measurements of equivalent widths on
the HD 165 052 FEROS spectra indicate values of 0.79 and 1.0 Å for the primary and the secondary, respectively, thus confirm-ing the main-sequence luminosity class of the components. This optical brightness ratio has been determined by comparing the observed EW ratio between the primary and secondary star to the same ratio evaluated for a sample of stars with the same spec-tral type (Conti & Alschuler 1971; Conti 1973). The comparison was performed for the He II λλ 4200,4542 and 4686 lines, and
L1
L2 = 1.55 is thus valid in the optical domain. Finally, spectra in
Fig. 1 show the N III λλ 4634,4640,4641 lines in emission, wich leads to an O((f)) spectral type.
In order to check these results, we compared the dis-entangled spectra of Fig. 1 with the spectroscopic atlas of Walborn & Fitzpatrick (1990). For the primary star, the fact that the He I λ 4471 and the He II λ 4542 lines have almost the same intensity and that the He II λ 4686 line is more intense than He II λ 4542 indicates an O7 spectral type rather than O6.5. For the secondary star, it is clear that the He I λ 4471 line has a greater intensity than He II λ 4542, which indicates a later spec-tral type than O7, thus O7.5 or O8. The discrepancy between the spectral type found with the method of Mathys (1988) and the method of Walborn & Fitzpatrick (1990) seems to come from the fact that the first one is based on the equivalent width ratios, while the second one uses intensity ratios of the lines. It can be seen in Fig. 1 that the He I λ 4471 line is narrower than the He II λ 4542 line, which leads to smaller equivalent widths, even when the intensity is higher, and thus to earlier spectral types. Finally, the fact that the primary component of He II λ 4542 has an intensity larger than the secondary component in the
disen-S P P S (a) He I λ 4026 S P P S (b) He I λ 4471 S P P S (c) He I λ 4921
Fig. 3. Different spectral lines of HD 165 052, at opposite orbital phases: 0.19 (when the secondary is approaching) and 0.66 (when the secondary is receding). The Struve-Sahade effect is clearly visible in the He I λλ 4026 and 4471 lines but less in He I λ 4921.
Fig. 4. Equivalent width ratios (primary/secondary) of He I λ 4026 (filled squares), He I λ 4471 (open squares) and He I λ 4921 (crosses) in the HD 165 052 binary system, as a function of the orbital phase Φ.
tangled and all observed spectra confirms that the primary star has an earlier type than the secondary star.
2.3. Struve-Sahade effect
Arias et al. (2002) claimed the detection of a S-S effect in this system for the He I λλ 4471, 4921 lines but they did not pro-vide quantitative results. The presence of the Struve-Sahade ef-fect is confirmed for the He I λ 4471 line by our FEROS spectra. Indeed, we have measured the equivalent width of this line at different orbital phases, and its value is 21% larger when the star is approaching compared to phases when the same star is reced-ing, both for the secondary as well as for the primary star of the system. The same behavior appears, stronger, in He I λ 4026: the
equivalent width of the lines of either star is 85% larger when it is approaching than when it is receding. On the other hand, no significant effect could be detected in the He I λ 4921 line nor in any other line between 3900 and 7000 Å (see Fig. 3). To quan-tify the impact of normalisation errors, the same measurements have been made on a diffuse interstellar band (DIB, λ = 5780Å) and the level of the noise in the DIB equivalent widths is low compared to the variations detected in the He I lines (the stan-dard deviation of all measurements is about 2%). Furthermore, the variations of the ratio between the equivalent width of the primary and of the secondary component have the same behav-ior for the two He I lines, as can be seen in Fig. 4, which indi-cates that the variations detected in He I λ 4471 are probably real and are not due to noise or normalisation errors, even if they are somewhat weaker than the variations in He I λ 4026. This ratio is almost constant all over the orbital cycle for the He I λ 4921 line. Finally, we have checked that no DIB exists on the blue side of the He I λ 4026 line that could bias the equivalent width measurement of the approaching component.
3. HD 100 213
HD 100 213, also called TU Mus, is an eclipsing contact bi-nary with a very short period (P ∼ 1.39 days). It has been studied in the optical wavelength domain both spectroscopically and photometrically by Andersen & Gronbech (1975) who de-scribed it as a binary system containing unevolved stars of to-tal mass around 40 M⊙. These authors also computed an orbital solution, with radial velocity amplitudes equal to 251.3 ± 4.8 and 370.5 ± 4.3 km s−1, for the primary and the secondary,
re-spectively. On the other hand, Stickland et al. (1995) analysed IUE data and found a large discrepancy with the radial veloc-ities of Andersen & Gronbech (1975), obtaining smaller val-ues of K1 = 216.7 ± 2.7 and K2 = 345.4 ± 3.1 km s−1 and
thus lower masses. They attributed this fact to the rather small number of lines measured by Andersen & Gronbech (1975) and to their incomplete coverage of the orbital cycle. However, Terrell et al. (2003) calculated a new orbital solution using nine FEROS spectra and found results in good agreement with those
Table 3. Same as Table 1 but for HD 100 213. HJD Φ RV1 RV2 −2 450 000 (km s−1) (km s−1) 2335.5871 0.10 118.6 −276.4 2335.7079 0.19 207.3 −361.2 2337.5760 0.54 −31.6 −31.6 2337.7070 0.63 −193.2 239.1 2338.5718 0.25 235.7 −384.3 2338.7038 0.35 208.1 −324.6 2339.5706 0.97 −22.4 −22.4 2339.7030 0.07 3.0 3.0 2782.5876 0.31 226.0 −361.6 2783.6331 0.06 13.4 13.4 2784.6100 0.77 −260.8 347.9
Table 4. Amplitudes of the radial velocity curves (in km s−1) of
the He lines in the HD 100 213 spectra. Quoted uncertainties are the 1σ error bars.
Line K1 K2 He I λ 4026 246.5 ± 3.3 363.8 ± 4.8 He I λ 4471 244.5 ± 3.3 372.3 ± 5.1 He II λ 4686 251.3 ± 4.6 355.2 ± 6.5 He I λ 4921 245.9 ± 1.2 373.0 ± 1.9 He II λ 5412 239.8 ± 4.6 351.2 ± 6.8 He I λ 5876 269.7 ± 7.4 388.8 ± 10.7
of Andersen & Gronbech (1975). The discrepancy between UV and optical data either reflects a genuine physical effect or could result from the methods used to evaluate the radial velocities. Indeed, Stickland et al. (1995) used cross-correlations with a template star (19 Cep, O9.5 Ib) while Andersen & Gronbech (1975), as well as Terrell et al. (2003), performed direct mea-surements on the observed spectra.
We observed this system 11 times with the FEROS echelle spectrometer. In 2002 the instrument was mounted on the 1.5m telescope (with a mean SNR equal to 340), while in 2003 it was on the 2.2m telescope (mean SNR = 330). The journal of obser-vations is presented in Table 3. The data reduction is identical to the one of HD 165 052.
3.1. Orbital solution
The radial velocities were measured on the spectra by fitting two Gaussian line profiles on the data in order to separate the pri-mary and secondary components. It was not possible to apply the disentangling method for this system, because the method failed to produce consistent results. The reason for this failure is probably that different spectral lines yield different radial veloc-ities (see Table 4). The number of available spectra was too low to allow an improvement of the orbital period and we thus fixed the period to the value found by Terrell et al. (2003).
The lines used in the calculation of the orbital solution are: He I λ 4026, He I λ 4471, He II λ 4686, He I λ 4921, He II λ 5412 and He I λ 5876. Different lines yield different orbital solu-tions (see Table 4). This is especially the case when compar-ing the values of K2. Although we did not find a clear trend
with the excitation potential of the atomic levels of the lines, we see that He II lines yield lower variations of the radial ve-locity than the He I lines. Fig. 5 shows the radial veve-locity curve of HD 100 213 as a function of the orbital phase. Table 5 gives
Table 5. Same as Table 2 but for HD 100 213.
Parameter Primary Secondary
P (days) 1.3873 (fixed) e 0 (fixed) T0(HJD) 2452334.059 ± 0.005 γ(km s−1) −13.2 ± 5.9 −26.3 ± 6.9 K (km s−1) 249.7 ± 6.2 369.2 ± 9.1 a sini (R⊙) 6.84 ± 0.17 10.12 ± 0.25 M sin3i (M ⊙) 20.32 ± 1.07 13.74 ± 0.65 Q (M1/M2) 1.48 ± 0.06 r.m.s. (km s−1) 13.6
Fig. 5. Radial velocity curve of HD 100 213 determined from FEROS observations and computed with LOSP. The RVs have been determined by a standard two Gaussian fitting of the lines with MIDAS (see Table 3). Primary data are represented by filled symbols, while secondary data are represented by open symbols. Crosses represent phases for which no deblending was possible. They were not included in the fit. Φ = 0 corresponds to the phase of secondary eclipse.
the orbital solution based on the mean RVs of all lines computed with the LOSP program. This solution is close to the one found by Andersen & Gronbech (1975) and Terrell et al. (2003), with
K1and K2equal to 250 and 369 km s−1. It is therefore possible
that the UV lines also have different radial velocities because they form over different parts of the stellar surface (see below), hence explaining the difference between the IUE and optical or-bital solutions.
3.2. Spectral type determination
We have determined the spectral type of HD 100 213 follow-ing Conti’s criteria, as for HD 165 052, and found O7.5 and O9.5 for the primary and the secondary star, respectively. The He II λ 4686 line is also in absorption, for both stars. When the optical brightness ratio of the stars is taken into account (L1
L2 =
1.88, determined in the same way as for HD 165 052), measure-ments of the equivalent widths of this line give EWλ(4686) = 0.78 Å for the primary star, which indicates that it is a main sequence star. Furthermore, Mathys’ O8.5-O9.7 luminosity
cri-(a) He I λ 4026
(b) He I λ 4471
Fig. 6. Equivalent widths (in Å) of two helium lines in the spec-trum of HD 100 213, as a function of phase. Filled and open squares represent primary and secondary data, respectively. Φ = 0 corresponds to the phase of secondary eclipse. The error bars are formal errors of the Gaussian fits to the line profiles.
terium (log W′′′
λ = log EWλ(4388) + log EWλ(4686)) yields the same result for the secondary star, with log W”’ = 5.43 > 5.40 where the EWs are expressed in mÅ (Mathys 1988).
3.3. Photometry
We performed an analysis of the Hipparcos photometry of HD 100 213 with the Nightfall program 1.This code is based
on a generalised Wilson-Devinney method assuming a stan-dard Roche geometry. In the fit, we restricted the number of free parameters to a minimum. The orbital parameters were adopted from Table 5. For the spectral types found in Sect. 3.2, 1 For details see the Nightfall User Manual
by Wichmann (1998) available at the URL:
http://www.hs.uni-hamburg.de/DE/Ins/Per/Wichmann/Nightfall.html.
Martins et al. (2005) give values of the effective temperatures of 35100 and 31500 K for the primary and the secondary, re-spectively. These temperatures did not vary significantly during the fit. When taking into account the ‘third light’ due to a faint source to the south-east of the system (at a distance of 16 arc-seconds, this source has a visual magnitude equal to 13.27), our results are similar to those of Terrell et al. (2003). We find that HD 100 213 is an overcontact binary with an inclination equal to 77.8◦, which leads to a primary mass of 21.7 M
⊙and a secondary mass of 14.7 M⊙.
3.4. Struve-Sahade effect
In their study of OB stars from IUE spectroscopy, Howarth et al. (1997) listed HD 100 213 as a binary system displaying the S-S effect. Unfortunately, these authors did not provide quantitative results and did not discuss any line in particular.
Our data confirm the variability of the EWs of the absorption lines, but the situation looks more complicated than expected for the ”classical” Struve-Sahade effect. Fig. 6 shows the equiv-alent width of two different lines as a function of phase. Both He I λλ 4026 and 4471 display variations of their equivalent width that are phase-locked with the orbital motion. For both stars, the EWs are maximum when the star is in front and mini-mum half a period later. This trend is especially well marked for the He I λ 4471 line. Since HD 100 213 is an eclipsing binary, this could partially be due to the mutual occultation of the two components. We used Nightfall to evaluate the light variations due to the ellipticity of both stars. We have then used this result to calculate the theoretical variations in equivalent widths that are exclusively due to the eclipses. Comparing this curve with the observations, we can see that all observation points of Fig. 6 fall outside the eclipses and occultations thus cannot be the cause of the variations. The most probable scenario is that the He I lines are not formed homogeneously over the entire sur-face of the star but preferentially on the rear side situated on the opposite side of the companion. Such a scenario would provide variations similar to those seen in Fig. 6.
The other lines of this system, in the studied wavelength domain, do not show any clear-cut variations, except perhaps He I λ 5876. However, the large number of telluric lines that affect this line renders the measurement of its equivalent width too uncertain. It seems that at least the secondary star shows the same variations as the He I λλ 4026 and 4471 lines. Thus the He I λ 5876 line should also be formed preferentially over the back side of the stars, and this fact seems to be confirmed by the large radial velocity amplitude associated with it (see Table 4).
As for HD 165 052, the deep interstellar lines do not vary significantly, with a standard deviation of the EW values equal to 0.7% while σ is of the order of 3% for the two helium lines considered in Fig. 6. Furthermore, there are no DIBs blended with any of the measured lines.
4. HD 159 176
HD 159 176 is a double line spectroscopic, non eclipsing binary (Trumpler 1930) situated in the young open cluster NGC 6383 and embedded in a large H II region. Conti et al. (1975) derived an orbital solution from optical spectra. They adopted a null ec-centricity and found a period of 3.366 days and an inclination of 50◦ or less. Following the Conti & Alschuler (1971) system, they determined spectral types equal to O7 V + O7 V. Thomas (1975) obtained photometric data of this system and found el-lipsoidal variations but no eclipse. The photometric solution
Table 6. Same as Table 1 but for HD 159 176. HJD Φ RV1 RV2 −2 450 000 (km s−1) (km s−1) 1299.9035 0.41 138.8 −101.2 1300.9147 0.71 −189.7 211.7 1300.9191 0.71 −198.6 220.2 1301.9202 0.00 18.0 17.4 1302.9315 0.30 191.4 −198.5 1304.9234 0.90 −119.9 132.0 1327.7738 0.68 −179.6 208.7 2037.7203 0.55 −69.3 61.5 2335.8786 0.11 150.2 −131.0 2336.8672 0.41 138.2 −109.7 2337.8773 0.71 −190.1 219.4 2338.8678 0.00 9.4 0.6 2338.8932 0.01 39.0 −27.5 2339.8702 0.30 200.5 −199.9 2381.8554 0.77 −199.6 229.3 2382.8421 0.06 108.0 −60.8 2383.8469 0.36 160.6 −167.9 2782.7632 0.85 −151.4 198.1 2783.7571 0.15 188.2 −151.9 2784.7995 0.46 79.2 −50.0
Table 7. Same as Table 2 but for HD 159 176.
Parameter Primary Secondary
P (days) 3.36673 ± 0.00004 e 0 (fixed) T0(HJD) 2451298.539 ± 0.006 γ(km s−1) 12.1 ± 2.5 8.9 ± 2.5 K (km s−1) 210.3 ± 3.5 216.5 ± 3.6 a sini (R⊙) 14.0 ± 0.2 14.4 ± 0.2 M sin3i (M ⊙) 13.7 ± 0.5 13.3 ± 0.5 Q (M1/M2) 1.03 ± 0.03 r.m.s. (km s−1) 10.3
indicated a bolometric magnitude equal to −8.6 and effective temperatures equal to 38000 K. More recently, Stickland et al. (1993) derived an orbital solution from IUE data, also assuming a zero eccentricity. Their period, equal to 3.367 days, is almost the same as the period found by Conti et al. (1975). Their mass ratio is very close to 1, which means equal spectral types for both components. On the other hand, Pachoulakis (1996) stud-ied HD 159 176 with UV, optical and photometric data and found that the primary star is actually hotter than the secondary star and has thus an earlier type, suggesting an O6 V + O7 V binary. An XMM-Newton study of HD 159 176 revealed an excess of X-ray luminosity by a factor ∼7 compared to the expected value for a single O-star (De Becker et al. 2004), which indicates the presence of a wind-wind interaction in the system.
The observations of this system were taken between 1999 and 2003, with the FEROS spectrometer (20 spectra). The jour-nal of observations is presented in Table 6. As for HD 100 213, the instrument was mounted on the 1.5m telescope in 1999, 2001 and 2002 (mean SNR = 350), while in 2003 it was on the 2.2m (mean SNR = 430). The data reduction was the same as for HD 100 213 and HD 165 052.
Secondary Primary
Fig. 7. Normalised disentangled spectra of HD 159 176, between 4455 and 4895 Å. The primary spectrum was vertically shifted by 0.15 units for clarity.
Fig. 8. Radial velocity curve of HD 159 176 determined from FEROS observations and computed with LOSP. The RVs were determined through a disentangling of the primary and sec-ondary spectra. Primary data are represented by filled symbols, secondary data are represented by open symbols. Φ = 0 corre-sponds to the phase of conjunction with the secondary star be-hind.
4.1. Orbital solution
We have used the disentangling method to determine the RVs that yield the orbital solution of Table 7. The lines considered in the RV calculation are: Hγ, He I λ 4471, Mg II λ 4481, He II λ 4542, He II λ 4686, He I λ 4713 and Hβ. The pe-riod was allowed to vary from an initial value of 3.366767 days (Stickland et al. 1993). Fig. 7 shows the disentangled spectra of HD 159 176, and Fig. 8 the radial velocity curve as a function of the orbital phase.
Using the same approach as for HD 165 052, we have de-termined rotational velocities of 101 ± 5 and 98 ± 5 km s−1
for the primary and secondary component of HD 159 176 re-spectively, which indicate a synchronous rotation of the system. Furthermore, the comparison between the angular velocity of the
4010 4020 4030 4040 0.9 0.95 1 S P (a) He I λ 4026 4460 4470 4480 4490 0.9 0.95 1 S P (b) He I λ 4471 4910 4920 4930 4940 0.96 0.98 1 S P (c) He I λ 4921
Fig. 9. Comparison of three He I lines of HD 159 176 for two different orbital phases when the primary is receding.
Fig. 10. Equivalent widths ratio of He I λ 4026 (filled squares), He I λ 4921 (open squares), He I λ 4471 (filled circles), He I λ 4713 (open circles) and He I λ 5876 (crosses) in the HD 159 176 binary system, as a function of the orbital phase
Φ.
system and the angular velocity of each component yields equal values if the inclination is equal to 46◦. This value is compa-rable to the 48◦found by Stickland et al. (1993) and the 50◦of Pachoulakis (1996), which indicates that the system is probably in co-rotation. The fits of the radial velocity curve with the ec-centricity as a free parameter gave e = 0.02, with no improve-ment of the residuals, and the circularisation time calculated from Tassoul (1990) is shorter than 57 000 years. The orbit is thus considered circular.
4.2. Spectral type determination
The equivalent width measurements made on our individual FEROS spectra lead to spectral types of the components of HD 159 176 equal to O7 + O7.5 on average, but uncertainties on the EWs due to the Struve-Sahade effect (see below) allow us to have a primary between O6.5 and O7.5 and a secondary between O7 and O8. If instead we measure the EWs on the disentangled spectra, we obtain an O7 spectral type for both components. The components are main-sequence stars since the He II λ 4686 line is in absorption, and EWλ(4686)= 0.60 for the primary and 0.71 for the secondary star (accounting for L1
L2 = 1.18,
deter-mined in the same manner as for HD 165 052). The compari-son of Fig. 7 with the spectra of Walborn & Fitzpatrick (1990) confirms that both spectral types are very similar and should be very close to O7, even if the primary star seems slightly earlier. As for HD 165 052, it can be seen in Fig. 7 that the N III λλ 4634,4640,4641 lines are in emission, which means that both components have an O((f)) spectral type.
4.3. Struve-Sahade effect
The first report of the S-S effect for this system goes back to Trumpler (1930), who noted a change in the appearance of the optical spectral lines. This was confirmed by Conti et al. (1975) who specified that the approaching star usually appears to have deeper lines. HD 159 176 is also cited, for the same reason, by Stickland et al. (1993) and Howarth et al. (1997). Whilst these authors generally specify from which star and phase they have detected a strange behavior, they do not show any figures or quantitative results.
On the basis of our FEROS observations, we could observe that some variations in the line profiles appear when the sec-ondary star is approaching (from Φ = 0.0 to Φ = 0.5). For two He I lines measured in our wavelength domain (He I λ 4026
Table 8. Same as Table 1 but for DH Cep. HJD Φ RV1 RV2 −2 450 000 (km s−1) (km s−1) 2518.4440 0.70 −250.7 208.9 2520.4080 0.63 −210.1 157.8 2522.3963 0.57 −159.3 41.4 2524.3893 0.51 −69.7 −32.0 2528.3498 0.39 71.6 −228.7 2529.3596 0.87 −219.9 159.1 2532.3708 0.29 170.3 −300.1 2533.3813 0.77 −261.4 209.6 2922.4670 0.09 80.1 −180.1 2923.4440 0.55 −100.9 76.1 3980.5385 0.32 158.9 −270.9 3981.4924 0.78 −298.1 208.6 3982.3843 0.19 151.8 −291.8 3982.5795 0.29 161.3 −320.0 3983.5053 0.73 −290.3 201.3 3984.4928 0.19 159.7 −299.7 Secondary Primary
Fig. 11. Normalised disentangled spectra of DH Cep, between 4455 and 4895 Å. The primary spectrum was vertically shifted by 0.25 units for clarity.
and He I λ 4921), there is an increase of the equivalent width and depth of the secondary star’s lines at phase Φ = 0.41 com-pared to its value at phase Φ = 0.11 (see Figs. 9(a) and 9(c)). Furthermore, for the He I λλ 4471, 4713 and 5876 lines, an inver-sion of the relative intensity of the two component lines occurs between these two orbital phases (see Fig. 9(b)). These changes are both due to a modification of the line maximum intensities and of the full width at half minimum. These variations are well above the level of noise, measured from the variations of the dif-fuse interstellar band at 5780 Å (σ = 0.8%) and no DIB exists in any measured lines that could modify the measurements. Fig. 10 shows that the ratio of primary and secondary equivalent widths of all these considered lines also show the same behavior with a decrease of the ratio at phase 0.41. This decrease occurs in both available spectra at this phase, one in 1999 and the other one in 2002. When the primary star is approaching, the EW ra-tio increase is due to a progressive increase of the EW of the primary star, while the secondary equivalent width is decreas-ing. The general trend in Fig. 10 is thus that the EWs of the He I lines of a given component tend to be larger when this compo-nent is in front. While this effect cannot be due to occultations (HD 159 176 does not display eclipses), it could indicate that the He I lines preferentially form on the rear sides of the stars.
Table 9. Same as Table 2 but for DH Cep.
Parameter Primary Secondary
P (days) 2.11095 ± 0.00013 e 0 (fixed) T0(HJD) 2452516.976 ± 0.006 γ(km s−1) -52.7 ± 4.4 -45.9 ± 4.7 K (km s−1) 225.0 ± 4.8 265.1 ± 5.7 a sini (R⊙) 9.4 ± 0.2 11.1 ± 0.2 M sin3i (M ⊙) 13.9 ± 0.6 17.8 ± 0.5 Q (M1/M2) 1.18 ± 0.04 r.m.s. (km s−1) 14.2
Fig. 12. Radial velocity curve of DH Cep determined from Aur´elie observations and computed with LOSP. The RVs have been determined through a disentangling of the primary and sec-ondary spectra. Primary data are represented by filled symbols, while secondary data are represented by open symbols. Φ = 0 corresponds to the phase of the phase of conjunction with the secondary star behind.
5. DH Cep
DH Cep (HD 215835) is a double-lined O + O spectroscopic binary that belongs to the young open cluster NGC 7380, in the Perseus arm of our galaxy. Pearce (1948) obtained the first orbital solution from optical data. He found a large eccentric-ity (e = 0.127 ± 0.0083) and an orbital inclination of i = 62◦ for a period equal to 2.11104 ± 2 10−5 days, which leads to
very large masses. Hill et al. (1976) found small amplitude pho-tometric variations. Lines et al. (1986) conducted a more com-plete photometric campaign on DH Cep and confirmed that it is an ellipsoidal variable star. They also added that their light curves imply an eccentricity not larger than 0.05 and an inclina-tion of about 50◦. A new spectroscopic analysis was performed by Sturm & Simon (1994), using a disentangling method. They found a period very close to the period of Pearce (1948), but with an eccentricity below 0.04. They computed a new light curve from their own results, based on the Lines et al. (1986) obser-vations and revised the inclination downwards to a value of 47◦
. Penny et al. (1997) used their tomographic separation method on UV spectra to derive new spectral types for both components:
(a) He II λ 4542 (b) He II λ 4686 (c) Hβ
Fig. 13. Equivalent widths (in Å) of three helium lines in the spectrum of DH Cep, as a function of phase. Filled and open squares represent primary and secondary data, respectively. Φ = 0 corresponds to the phase of conjunction with the secondary star behind. The error bars are formal errors of the Gaussian fits to the line profiles.
O6 V and O7 V for the primary and the secondary star, respec-tively.
The early spectral type of DH Cep, its short period and the detection of wind material in the system (Corcoran 1991) make it a good candidate to display the Struve-Sahade effect, even if no detection has been reported yet.
Data were collected between 2002 and 2006 at the Observatoire de Haute-Provence (France) with the Aur´elie spec-trograph mounted on the 1.52m telescope. Aur´elie was equipped with a 2048 x 1024 CCD EEV 42-20#3, with a pixel size of 13.5
µm squared. All spectra were taken with a 600 l/mm grating with a reciprocal dispersion of 16 Å mm−1, allowing us to achieve a
spectral resolution of about 8000 in the blue range. A total of 16 spectra were obtained in the blue part of the visible wave-length domain (from 4450 Å to 4900 Å). The spectra have a mean SNR ratio equal to 430. The data reduction has been done with the MIDAS software and the whole procedure is described in Rauw & De Becker (2004). The journal of the observations is presented in Table 8.
5.1. Orbital solution
As for HD 165 052 and HD 159 176, we have used the disentan-gling method (see Fig. 11) to determine the RVs given in Table 8. These values yield the orbital solution of Table 9, for which the lines considered in the RV calculation are: He I λ 4471, Mg II λ 4481, He II λ 4542, He II λ 4686, He I λ 4713 and Hβ. The period was allowed to vary from an initial value of 2.110912 days (Sturm & Simon 1994). Fig. 12 shows the radial velocity curve as a function of the orbital phase. This solution is close to the solution given by Sturm & Simon (1994), who also used a disentangling method to determine their radial velocities. However, our radial velocities are ∼ 15 km s−1larger. Such a
dif-ference could come from the fact that the data of Sturm & Simon (1994) did not cover the whole orbital period, or from the dif-ferent lines considered (they used He I λ 4026, He II λ 4200, He I λ 4471, He II λ 4542 and He II λ 4686).
Using the same approach as for HD 165 052 and HD 159 176, we determined rotational velocities of 162 ± 10 and 166 ± 7 km s−1for the primary and secondary component of
DH Cep respectively. Furthermore, if we suppose that the
corre-sponding angular velocities are equal to the orbital angular ve-locity of the system, we find an inclination equal to 47◦, which is exactly the value found by Lines et al. (1986) and Hilditch et al. (1996) with photometric data. This indicates a synchronous co-rotation of the stars on a circular orbit (tcirc < 21 000 years,
Tassoul (1990)).
5.2. Spectral type determination
The measurements of equivalent widths made on the Aurelie spectra of DH Cep lead to spectral types O6 and O6.5 for the primary and the secondary star, respectively. However, uncer-tainties on these numbers (due to the lower resolution of these spectra compared to FEROS spectra, but also to some varia-tions in the He II λ 4542 line, see below) allow the spectral type of the primary to vary from O5.5 to O6.5, and the secondary spectral type from O6 to O6.5. A brightness ratio in our wave-length domain has also been calculated following the method as explained in Sect. 2.2. We obtain L1
L2 = 1.42 and when we
take this number into account, we derive equivalent widths of the He II λ 4686 line equal to 0.66 Å for the primary star and 0.82 Å for the secondary, which correspond to main sequence stars. When the measurements are performed on the disentan-gled spectra, the resulting classification is O6 + O7 system. On the other hand, the comparison of the spectra of Fig. 12 with the spectra of Walborn & Fitzpatrick (1990) shows that both com-ponents should be earlier than an O7 spectral type, with a hotter primary star, thus O6 V + O6.5 V. Both stars have an O((f)) spec-tral type, as can be seen in Fig. 11 (N III λλ 4634, 4640, 4641 lines are in emission).
5.3. Struve-Sahade effect
Because of the small wavelength domain of the Aur´elie spectra, only a few lines could be checked for the Struve-Sahade effect: He I λ 4471, He II λλ 4542, 4686 and Hβ. Among these lines, only the first one does not show any variations. Indeed, as can be seen in Fig. 13, the equivalent widths of the He II lines and of Hβvary with the orbital phase but in different ways. The equiv-alent width of the He II λ 4542 line seems to decrease when the star is receding, with a minimum during the conjunction
Table 10. Intensity variations as a function of phase detected or not (Y or N) for the primary (P) and the secondary (S) of the four systems. The hyphen stands for lines that could not be deblended, because of noise, strong telluric absorption lines, too close components or lines outside the available wavelength domain. (e) means that the line is in emission.
HD 165 052 HD 100 213 HD 159 176 DH Cep Line P S P S P S P S He I λ 4026 Y Y N N N Y - -He II λ 4200 N N - - N N - -He I λ 4471 Y Y N N Y Y N N He II λ 4542 N N N N N N Y Y He II λ 4686 N N N N N N Y Y He I λ 4713 N N N N Y Y - -Hβ - - - Y Y He I λ 4921 N N N N N Y - -He I λ 5016 N N N N N N - -He II λ 5412 N N N N N N -
-C III λ 5696 N (e) N (e) - - N (e) N (e) -
-C IV λλ 5801,5812 N N - - N N -
-He I λ 5876 N N - Y Y Y -
-when the star is behind its companion, and to increase during the other half cycle (Fig. 13(a)). This behavior is similar to the He I λλ 4026, 4471 lines of HD 100 213. Since DH Cep is also an ellipsoidal variable (Lines et al. 1986) this behavior indicates that He II λ 4542 is preferentially formed at the back side of the stars. For the two other lines, the details of the variation are less clear. However, we can say that globally, the equivalent width of the Hβ line is larger by 20% when the star is approaching, for both components. The same holds for the equivalent width of the primary component of the He II λ 4686 line when the primary star is approaching. For the secondary component of He II λ 4686, the variation is only 10%. In order to estimate errors due to noise or poor normalisation, we measured the stan-dard deviation of the equivalent width of a DIB (λ = 4762 Å) and found σ = 2%. Finally, no DIB exists in the vicinity of the measured lines that could bias the measurements.
6. Discussion and conclusions
We have presented a spectroscopic analysis of four very dif-ferent early-type binary systems, based on observations ob-tained with the ESO echelle spectrograph FEROS and the OHP Aur´elie instrument. We first used the data to determine new orbital solutions and spectral types. It was necessary to know as well as possible the fundamental parameters of the systems in order to study the Struve-Sahade effect. The conclusion of Bagnuolo et al. (1999) that the effect arises from different mech-anisms and that each star has its own ’tale’ seems to apply also to HD 165 052, HD 100 213, HD 159 176 and DH Cep. Table 10 shows a summary of the results obtained for each system. It indi-cates which lines present variations during the orbital cycle and if they appear in both stars.
In the first of these systems, HD 165 052, some variations were detected but only in two lines, He I λ 4026 and He I λ 4471. Indeed, the ratio between the primary and secondary equiv-alent width is lower than 1 when the secondary star is ap-proaching, and greater than 1 half an orbital cycle later. This can be compared to the behavior of HD 93 403, an O5.5 I + O7 V system that is also known to display the Struve-Sahade effect (Rauw et al. 2000, 2002). In this latter system the ratio
EWP/EWS of He I λ 4471, C IV λλ 5801, 5812 and C III λ 5696
is less than one when the secondary star is approaching, and greater or equal to one when it is receding. The difference
be-tween the two systems is that in the case of HD 93 403, only the secondary lines presented some variations, while in HD 165 052 both stars are affected.
In the case of HD 100 213, there does not seem to be a gen-uine Struve-Sahade effect. The variations observed in the He I lines are rather linked to the fact that the lines are formed over a limited part of the stellar surface that is not visible during the entire orbital cycle. In fact, the behavior of these lines, both in equivalent width and radial velocity, suggests that they are pref-erentially formed on the rear side of the stars, away from the radiations of the companion. Indeed, in this contact binary sys-tem, it seems likely that mutual heating is responsible for the non-uniform He I strength over the stellar surface.
In HD 159 176, almost all He I lines seem to vary. For two of them (He I λλ 4026, 4921) only the secondary lines are modified during the orbital cycle, while for the other ones (He I λλ 4471, 4713, 5876) both primary and secondary lines are affected. The ratio EWP/EWS increases just before the
sec-ondary eclipse, and decreases before the primary eclipse, as can be seen in the O7 III(f)+O7 III(f) system HD 152 248 (Sana et al. 2001) in the He I λλ 4713, 4921 lines. The situation is again sim-ilar to HD 100 213 and mutual heating would once more lead to an inhomogeneous distribution of the He I line intensity over the surface of the star.
DH Cep also shows equivalent width variations in three of the four examined spectral lines. This massive binary is an ellipsoidal variable system (Lines et al. 1986), and as for HD 100 213, the variations in He II λ 4542 are probably due to the fact that the line is formed preferentially over the rear side of the star. While it seems easy to explain a somewhat higher temperature and hence a weaker He I line on the front side of the stars by heating effects, explaining an enhanced He II line on the rear of the stars in DH Cep is harder. The behavior of He II λ 4686 and Hβis different. Indeed, the equivalent widths of these two lines are larger when the star is approaching, in agreement with the definition of the Struve-Sahade effect, ex-cept that it is not only the secondary star that is concerned by these variations.
In summary, the behavior of these four systems differs from what is expected for the ’standard’ Struve-Sahade effect. First, only several lines vary and they are not the same for each sys-tem. The line variations of at least two of the studied binaries (HD 100 213 and HD 159 176) can be explained by the fact that
the line formation is not homogeneous over the whole surface of the star. HD 165 052 follows more or less the definition of the S-S effect, but it is now clear that both spectra are affected and not the secondary star spectrum only. Line variations of DH Cep, in which no S-S had ever been detected, have both behaviors de-pending on the considered line.
The binaries in the present sample are composed of main sequence stars, and a similar study will be presented in a subsequent paper (paper II) for giant and supergiant objects (HD 47 129, 29 CMa, AO Cas). A comparison between these observed data and synthetic spectra is needed to understand the cause of these variations during the orbital cycle. This will be the subject of a forthcoming paper (paper III).
Acknowledgements. N. L. acknowledges the financial support of the Belgian
”Fonds pour la Formation `a la Recherche dans l’Industrie et dans l’Agriculture”. This research is supported in part through the XMM/INTEGRAL PRODEX con-tract.
References
Andersen, J. & Gronbech, B. 1975, A&A, 45, 107
Arias, J. I., Morrell, N. I., Barb´a, R. H., et al. 2002, MNRAS, 333, 202 Bagnuolo, W. G., Gies, D. R., Riddle, R., & Penny, L. R. 1999, ApJ, 527, 353 Conti, P. S. 1973, ApJ, 179, 161
Conti, P. S. 1974, ApJ, 187, 539
Conti, P. S. & Alschuler, W. R. 1971, ApJ, 170, 325
Conti, P. S., Cowley, A. P., & Johnson, G. B. 1975, PASP, 87, 327 Corcoran, M. F. 1991, ApJ, 366, 308
Corcoran, M. F. 1996, in Revista Mexicana de Astronomia y Astrofisica Conference Series, ed. V. Niemela & N. Morrell, 54
De Becker, M., Rauw, G., Pittard, J. M., et al. 2004, A&A, 416, 221
Gayley, K. G. 2002, in ASP Conf. Ser. 260: Interacting Winds from Massive Stars, ed. A. F. J. Moffat & N. St-Louis, 583
Gayley, K. G., Townsend, R., Parsons, J., & Owocki, S. 2007, in ASP Conference Series, in press
Gies, D. R., Bagnuolo, W. G., & Penny, L. R. 1997, ApJ, 479, 408 Gonz´alez, J. F. & Levato, H. 2006, A&A, 448, 283
Gray, D. F. 2005, The Observation and Analysis of Stellar Photospheres (Cambridge University Press)
Hilditch, R. W., Harries, T. J., & Bell, S. A. 1996, A&A, 314, 165
Hill, G., Hilditch, R. W., & Pfannenschmidt, F. L. 1976, Publications of the Dominion Astrophysical Observatory Victoria, 15, 1
Howarth, I. D., Siebert, K. W., Hussain, G. A. J., & Prinja, R. K. 1997, MNRAS, 284, 265
Lines, H. C., Lines, R. D., Guinan, E. F., & Robinson, C. R. 1986, Information Bulletin on Variable Stars, 2932, 1
Martins, F., Schaerer, D., & Hillier, D. J. 2005, A&A, 436, 1049 Mathys, G. 1988, A&AS, 76, 427
Mathys, G. 1989, A&AS, 81, 237 Morrison, N. D. 1975, ApJ, 200, 113
Morrison, N. D. & Conti, P. S. 1978, ApJ, 224, 558 Pachoulakis, I. 1996, MNRAS, 280, 153
Pearce, J. A. 1948, AJ, 54, 135
Penny, L. R., Gies, D. R., & Bagnuolo, Jr., W. G. 1997, ApJ, 483, 439 Rauw, G. & De Becker, M. 2004, A&A, 421, 693
Rauw, G., Sana, H., Gosset, E., et al. 2000, A&A, 360, 1003 Rauw, G., Vreux, J.-M., Stevens, I. R., et al. 2002, A&A, 388, 552 Sahade, J. 1959, PASP, 71, 151
Sana, H., Gosset, E., & Rauw, G. 2006, MNRAS, 371, 67
Sana, H., Hensberge, H., Rauw, G., & Gosset, E. 2003, A&A, 405, 1063 Sana, H., Rauw, G., & Gosset, E. 2001, A&A, 370, 121
Sim ´on-D´ıaz, S. & Herrero, A. 2007, ArXiv Astrophysics e-prints Stickland, D. J. 1997, The Observatory, 117, 37
Stickland, D. J., Koch, R. H., Pachoulakis, I., & Pfeiffer, R. J. 1993, The Observatory, 113, 204
Stickland, D. J., Lloyd, C., & Koch, R. H. 1997, The Observatory, 117, 295 Stickland, D. J., Lloyd, C., Koch, R. H., & Pachoulakis, I. 1995, The
Observatory, 115, 317 Struve, O. 1937, ApJ, 85, 41
Struve, O. 1950, Stellar evolution, an exploration from the observatory. (Princeton University Press)
Sturm, E. & Simon, K. P. 1994, A&A, 282, 93 Tassoul, J.-L. 1990, ApJ, 358, 196
Terrell, D., Munari, U., Zwitter, T., & Nelson, R. H. 2003, AJ, 126, 2988 Thomas, J. C. 1975, in Bulletin of the American Astronomical Society, 533 Trumpler, R. J. 1930, PASP, 42, 342
van Altena, W. F. & Jones, B. F. 1972, A&A, 20, 425 Walborn, N. R. & Fitzpatrick, E. L. 1990, PASP, 102, 379
Wolfe, Jr., R. H., Horak, H. G., & Storer, N. W. 1967 (Modern astrophysics. A memorial to Otto Struve), 251