AUTHOR COPY ONLY
DOI: 10.1530/ERC-16-0356
http://erc.endocrinology-journals.org © 2016 Society for Endocrinology
Printed in Great Britain Published by Bioscientifica Ltd.
Endocrine
-Related Cancer
23:11
Research
I Potorac et al. T2 weighted MRI in acromegalyT2-weighted MRI signal predicts
hormone and tumor responses to
somatostatin analogs in acromegaly
Iulia Potorac1, Patrick Petrossians1, Adrian F Daly1, Orsalia Alexopoulou2,Sophie Borot3, Mona Sahnoun-Fathallah4, Frederic Castinetti4, France Devuyst5, Marie-Lise Jaffrain-Rea6, Claire Briet7, Florina Luca8, Marion Lapoirie9,
Flavius Zoicas10, Isabelle Simoneau11, Alpha M Diallo12, Ammar Muhammad13, Fahrettin Kelestimur14, Elena Nazzari15, Rogelio Garcia Centeno16, Susan M Webb17, Marie-Laure Nunes18, Vaclav Hana19, Véronique Pascal-Vigneron20,
Irena Ilovayskaya21, Farida Nasybullina22, Samia Achir23, Diego Ferone15, Sebastian J C M M Neggers13, Brigitte Delemer12, Jean-Michel Petit11, Christof Schöfl24, Gerald Raverot9, Bernard Goichot8, Patrice Rodien7, Bernard Corvilain5, Thierry Brue4, Franck Schillo3, Luaba Tshibanda1, Dominique Maiter2, Jean-François Bonneville1 and Albert Beckers1
1CHU de Liège-University of Liège, Liège, Belgium 2Université Catholique de Louvain, Brussels, Belgium 3CHU Jean Minjoz, Besancon, France
4CHU Marseille, Marseille, France
5Université Libre de Bruxelles, Bruxelles, Belgium
6Department of Biotechnological and Applied Clinical Sciences, University of L’Aquila and Neuroendocrinology,
Neuromed IRCCS, Pozzilli, Italy
7CHU Angers, Angers, France 8CHU Strasbourg, Strasbourg, France 9CHU Lyon, Lyon, France
10Universitätsklinikum Erlangen, Erlangen, Germany 11CHU Bocage, Dijon, France
12CHU Reims, Reims, France
13Erasmus University Medical Center Rotterdam, Rotterdam, Netherlands 14Faculty of Medicine, Erciyes University, Kayseri, Turkey
15University of Genova, Genova, Italy
16Hospital Universitario Gregorio Marañon, Madrid, Spain
17Hospital Sant Pau, Centro de Investigación Biomédica en Red de Enfermedades Raras (CIBERER, Unidad 747),
IIB-Sant Pau, ISCIII and Universitat Autònoma de Barcelona (UAB), Barcelona, Spain
18CHU Bordeaux, Bordeaux, France 19Charles University, Prague, Czech Republic 20CHU Nancy, Nancy, France
21Moscow Regional Research and Clinical Institute, Russia 22Kazan State Medical Academy, Kazan, Russia
23Centre Pierre et Marie Curie, Algiers, Algeria
24Center of Endocrinology & Metabolism, Bamberg, Germany
Abstract
GH-secreting pituitary adenomas can be hypo-, iso- or hyper-intense on T2-weighted MRI sequences. We conducted the current multicenter study in a large population of patients with acromegaly to analyze the relationship between T2-weighted signal intensity on diagnostic MRI and hormonal and tumoral responses to somatostatin analogs (SSA) as primary monotherapy. Acromegaly patients receiving primary SSA for at least
2311 871–881 Correspondence should be addressed to A Beckers Email albert.beckers@chu.ulg.ac.be Key Words f acromegaly f somatostatin analogs f MRI f treatment response f predictor
AUTHOR COPY ONLY
Research I Potorac et al. T2 weighted MRI 872 in acromegalyEndocrine
-Related Cancer
23:11
3 months were included in the study. Hormonal, clinical and general MRI assessments were performed and assessed centrally. We included 120 patients with acromegaly. At diagnosis, 84, 17 and 19 tumors were T2-hypo-, iso- and hyper-intense, respectively. SSA treatment duration, cumulative and mean monthly doses were similar in the three groups. Patients with T2-hypo-intense adenomas had median SSA-induced decreases in GH and IGF-1 of 88% and 59% respectively, which were significantly greater than the
decreases observed in the T2-iso- and hyper-intense groups (P < 0.001). Tumor shrinkage
on SSA was also significantly greater in the T2-hypo-intense group (38%) compared
with the T2-iso- and hyper-intense groups (8% and 3%, respectively; P < 0.0001). The
response to SSA correlated with the calculated T2 intensity: the lower the T2-weighted intensity, the greater the decrease in random GH (P < 0.0001, r = 0.22), IGF-1 (P < 0.0001,
r = 0.14) and adenoma volume (P < 0.0001, r = 0.33). The T2-weighted signal intensity
of GH-secreting adenomas at diagnosis correlates with hormone reduction and tumor shrinkage in response to primary SSA treatment in acromegaly. This study supports its use as a generally available predictive tool at diagnosis that could help to guide subsequent treatment choices in acromegaly.
Introduction
Acromegaly is usually caused by a GH-secreting pituitary adenoma and has a prevalence of 8–12/100,000 people
(Daly et al. 2006, Fernandez et al. 2010). Neurosurgical
resection is the gold standard in acromegaly management (Katznelson et al. 2014), but remission after surgery alone is infrequent in macroadenomas, which constitute the majority of these tumors (Starke et al. 2013, Sarkar et al. 2014, Cuevas-Ramos et al. 2015). Consequently, medical treatment is often necessary and a variety of established and novel therapeutic options are available, including somatostatin analogues (SSA) (Melmed 2016). Responses to medical treatment are difficult to predict in advance of starting treatment and many current factors are based on histological characteristics of operated tumor tissue.
Pituitary MRI is routinely performed at diagnosis in patients with acromegaly. Apart from adenoma size and extension patterns, T2-weighted adenoma signal has recently been highlighted as a potential marker of disease behavior in acromegaly. In an international cohort of 297 patients with acromegaly, we showed that more than 50% of GH-secreting adenomas are T2-hypo-intense at diagnosis when compared to normal pituitary tissue (Potorac et al. 2015). These T2-hypo-intense adenomas are generally smaller, less frequently invade the cavernous sinus and are associated with higher levels of IGF-1. Interestingly, Puig-Domingo and coworkers previously noted that T2-hypo-intense post-operative adenoma residues (n = 62) were more sensitive to subsequent SSA therapy (Puig-Domingo et al. 2010). Similarly, Heck and
coworkers reported that T2-hypo-intense adenomas had a better hormonal response to pre-operatively administered SSA, suggesting that T2-hypo-intensity might be a useful pre-operative marker of SSA response (Heck et al. 2012, Heck et al. 2015). Recent guidelines for acromegaly management have also noted the potential utility of using T2 intensity to optimize patient management (Katznelson
et al. 2014).
To assess the validity of this approach, we performed a multicenter, international study of patients with acromegaly and studied the relationship between the T2-weighted signal intensity on MRI and the hormonal and the tumor size responses to primary SSA therapy.
Patients and methods
This was an international study of acromegaly patients diagnosed from 2006 onwards at the 23 participating tertiary referral centers in 10 countries (Belgium, France, Germany, Italy, Russia, Spain, Netherlands, Turkey, Czech Republic and Algeria). All patients were diagnosed, managed and treated according to clinical criteria at their individual centers. Only patients with a visible GH-secreting pituitary adenoma of over 5 mm in diameter on diagnostic MRI and who had received primary SSA therapy for acromegaly were included. To be eligible, hormonal assessments and a follow-up MRI had to have been performed between 3 and 12 months after the beginning of primary treatment with SSA therapy.
Endocrine-Related Cancer (2016) 23, 871–881
AUTHOR COPY ONLY
Research I Potorac et al. T2 weighted MRI 873 in acromegalyEndocrine
-Related Cancer
23:11
The diagnosis of acromegaly was established based on an elevated IGF-1 level compared with the age- and sex-adjusted laboratory limits at each center; most patients (74%) also had evidence of an unsuppressed GH following an oral glucose tolerance test (OGTT). In patients who did not have an OGTT performed at diagnosis, IGF-1 level was more than two-fold higher than the upper limit of normal.
The study, its conduct and all of the analyses undertaken were performed under central approval for all sites by the Ethics Committee of the Centre Hospitalier Universitaire de Liège; this included anonymous data collection regarding the study participants.
Patient characteristics
The following data regarding each patient were recorded: date of birth, gender, age at diagnosis, type, dose and duration of SSA treatment. Each study participant’s data were blinded with a study code in order to maintain anonymity.
Hormonal assays
Values at diagnosis for random GH, GH nadir during OGTT, IGF-1 (absolute value and age and sex-adjusted upper limit of normal (ULN) of each laboratory) and prolactin were recorded. After 3–12 months of primary SSA treatment, a second hormonal evaluation (random GH, IGF-1 (absolute value and ULN), and prolactin) was performed. In order to eliminate variations between different assay kits and the different age- and sex-adjusted normal ranges, IGF-1 levels were expressed as a percentage of the ULN, further referred to as IGF-1%. Hormonal response to SSA treatment was evaluated as percent change from baseline in random GH and IGF-1% after SSA treatment. Co-secretion of prolactin was considered to be present when prolactin values
exceeded 100 ng/mL at diagnosis, in accordance
with the current literature (Karavitaki et al. 2006, Melmed et al. 2011).
Imaging criteria
The MRI examinations (at diagnosis and after 3–12 months of SSA treatment) of each patient were collected for central reading. This was performed by two experienced neuroradiologists and by consensus in cases of discordant readings. The T2-weighted signal on the diagnostic MRI was visually assessed as compared with
normal pituitary tissue and when this was not visible, to the gray matter of the temporal lobe, as described previously (Potorac et al. 2015). Moreover, quantification of the T2-weighted signal by Region Of Interest (ROI) measurement of the adenoma, normal pituitary tissue and gray matter of the temporal lobe was performed and the calculated ROI-derived T2 intensity ratio of the adenoma vs gray matter was used for all further analyses.
We excluded adenomas that had a heterogeneous signal on diagnostic MRIs that made ROI measurement of T2-weighted signal intensity of the solid part of the adenoma unreliable. This allowed a uniform and unequivocal grading of the adenoma signal intensity and a consistent analysis based on this quantification. Very
small adenomas with a maximum diameter <5 mm were
also excluded as measurement of such small tumor sizes could have led to imprecise volumetric calculations.
For evaluation of adenoma size and tumor response to treatment, the tumor volume was calculated
according to the formula: height × width × length × π/6
(Lundin & Pedersen 1992). Response to treatment was calculated as the percentage change in tumor volume between the two MRI examinations before and after SSA treatment.
Statistical analysis
Statistical analyses were performed using the R statistical package (R Core Team 2014). Graphs were generated using R and the Lattice graphical package (Sarkar 2008). Data were plotted and assessed for normal distribution. Since none of the variables showed a normal distribution, population spread was described using median and interquartile ranges (25th and 75th percentiles). Count variables were tested with the Chi-square test. Continuous variables were compared using the Mann–Whitney and Kruskal–Wallis tests. Graphs of univariate data are plotted as boxplots, with the limits of the box showing the 25th and 75th percentiles, the central line representing the median and the whiskers 1.5 times the interquartile range of the data.
Results
Patient characteristics
A total of 144 patients met the inclusion criteria of the study. Of these, 24 were excluded because the heterogeneous character of the adenoma on T2-weighted sequences made ROI analyses unreliable. The analysis was
AUTHOR COPY ONLY
Research I Potorac et al. T2 weighted MRI 874 in acromegalyEndocrine
-Related Cancer
23:11
therefore performed on 120 cases. Gender distribution was balanced (62 females (51.6%)). The median age at diagnosis of acromegaly was 51.0 years, with males being significantly younger than females (47.0 vs 59.0 years, respectively; P = 0.0007).
At diagnosis, the median random GH level was 9.9 ng/mL and the median nadir GH after glucose suppression was 5.5 ng/mL. The median IGF-1% at diagnosis was 314.9%; males had a trend toward higher IGF-1% values than females (335.3% vs 298.2%, respectively; P = 0.06). Prolactin co-secretion was found in eight patients.
Regarding SSA treatment, 45 patients received lanreotide Autogel (among these, one was switched to octreotide LAR), 69 patients received octreotide LAR (among them, two were switched to lanreotide Autogel)
and three received pasireotide. For three patients, the SSA dose used was unknown. The duration of treatment between diagnostic and follow-up MRIs was similar between patients on lanreotide Autogel (5 months) and octreotide LAR (6 months). The median cumulative treatment doses were 540 mg for lanreotide Autogel and 150 mg for octreotide LAR.
Following SSA treatment, median random GH values were 2.3 ng/mL, and the median IGF-1% level was 146.8%. In total, 28 patients only (23%) had IGF-1 normalization after this short-term treatment period. Male patients had significantly higher IGF-1% levels on SSA treatment (197.4%) than females (120.1%; P = 0.001).
Tumor characteristics on imaging
There were 109 macroadenomas and 11 microadenomas. At the baseline MRI, the median adenoma volume was
1266 mm3 (Q1: 687 mm3, Q3: 2999 mm3). The visual
assessment of T2-weighted adenoma signal categorized 84 adenomas as hypo-intense, 17 as iso-intense and 19 as hyper-intense. Quantitative measurement of adenoma signal compared with normal pituitary tissue and gray matter confirmed the visual classification (Fig. 1). Using the ROI calculation, the adenomas could be clearly segregated into the three distinct groups with a clear demarcation among them that corresponded well with the visual classification. The ROI adenoma/ROI gray matter ratio for hypo-intense adenomas was 0.76 (Q1: 0.61, Q3: 0.86), while it was 1.05 (Q1: 1.02, Q3: 1.12) in iso-intense adenomas and 1.23 (Q1: 1.19, Q3: 1.38) in hyper-intense adenomas. Importantly, none of the adenomas that were hypo-intense on the visual classification had a
ROI adenoma/ROI gray matter ratio ≥1, and none of the
hyper-intense adenomas on the visual classification had a ratio ≤1.
Baseline hormonal parameters and adenoma volumes were significantly different between the groups. T2-hypo-intense adenomas had higher nadir GH values Visual vs ROI signal
Visual assessment
ROI measure (adenoma/pituitary or gray matter)
0.5 1.0 1.5
hypo iso hyper
Figure 1
Correlation between the visual assessment of T2-weighted signal intensity and the ROI measurement.
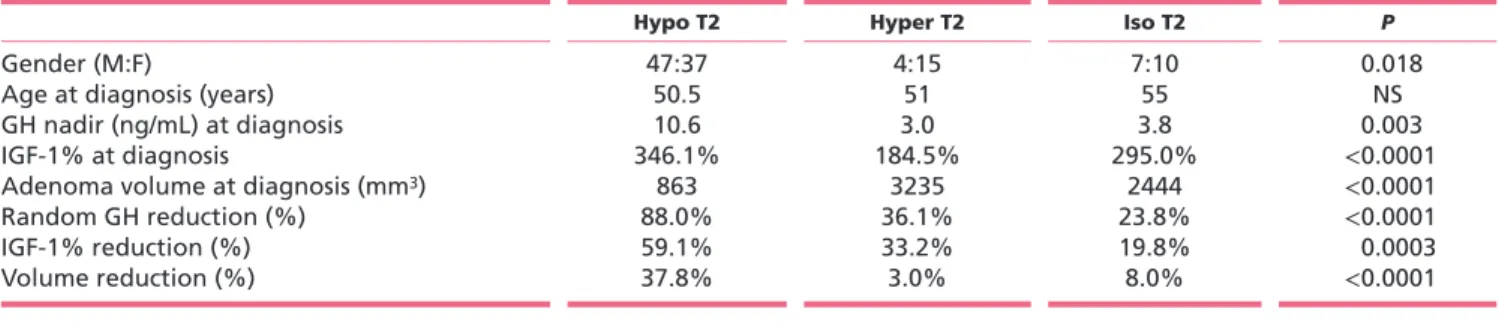
Table 1 Baseline and post-treatment characteristics of the different T2-weighted signal groups of adenomas.
Hypo T2 Hyper T2 Iso T2 P
Gender (M:F) 47:37 4:15 7:10 0.018
Age at diagnosis (years) 50.5 51 55 NS
GH nadir (ng/mL) at diagnosis 10.6 3.0 3.8 0.003
IGF-1% at diagnosis 346.1% 184.5% 295.0% <0.0001
Adenoma volume at diagnosis (mm3) 863 3235 2444 <0.0001
Random GH reduction (%) 88.0% 36.1% 23.8% <0.0001
IGF-1% reduction (%) 59.1% 33.2% 19.8% 0.0003
AUTHOR COPY ONLY
Research I Potorac et al. T2 weighted MRI 875 in acromegalyEndocrine
-Related Cancer
23:11
and higher IGF-1% compared with T2-iso- and hyper-intense adenomas (Table 1). T2-hyper- and T2-iso-hyper-intense adenomas had significantly greater tumor volumes at
diagnosis (3235 mm3 and 2444 mm3, respectively) as
compared with T2-hypo-intense adenomas (863 mm3;
P < 0.0001).
Response to treatment
Treatment with SSA was administered for a median duration of six months. There was no difference in median SSA treatment duration between the T2-hypo- (6 months), iso- (6 months) or hyper-intense (5 months) adenomas. Total cumulative and mean monthly doses of SSA were also similar between adenomas with T2-hypo-, iso- or hyper-intense signal intensities. No relationship was found between the decrease in GH or IGF-1% and the duration of treatment, total cumulative dose or mean monthly dose of either octreotide LAR or lanreotide
Autogel. However, tumor shrinkage was found to be greater with longer treatment duration (P = 0.0003, r = 0.11) and with higher cumulative and mean monthly doses of octreotide LAR (P = 0.001, r = 0.15 and P = 0.0003, r = 0.23, respectively) and lanreotide Autogel (P = 0.02, r = 0.13 and
P = 0.05, r = 0.12, respectively).
Hormonal response to SSA and T2-weighted signal Using the visual assessment of T2-weighted signal, the decrease in random GH with SSA treatment was significantly greater in the T2-hypo-intense group (88.0%, Q1: 76.2%, Q3: 94.2%) as compared with T2-iso-intense (23.8%, Q1: 10.3%, Q3: 51.8%) and T2-hyper-intense
(36.1%, Q1: 3.1%, Q3: 56.7%) groups (P < 0.0001) (Fig. 2A).
This decrease also correlated with the quantitative measurement of T2-weighted signal intensity (lower signal intensity adenomas had a greater GH decrease)
(P < 0.0001, r = 0.22; Fig. 3A). The decrease in IGF-1% with
Signal of the adenoma
Change in % −100 −50 0 50 100 150
hypo iso hyper
Signal of the adenoma
Change in % −80 −60 −40 −20 0 20
hypo iso hyper Change in % −50
0
Signal of the adenoma hypo iso hyper
Figure 2
Responses of random GH (A), IGF-1% (B) and volume (C) to SSA primary treatment depending on T2-weighted signal intensity.
Signal (adenoma/pit or GM) Change in GH (%) −100 −50 0 50 100 150 0.5 1.0 1.5 Signal (adenoma/pit or GM) Change in IGF−1 (%) −50 0 0.5 1.0 1.5 Signal (adenoma/pit or GM) Change in v olume (%) −80 −60 −40 −20 0 20 0.5 1.0 1.5 Figure 3
Correlation between quantitative T2-weighted signal intensity of adenomas and their response to SSA in terms of GH (A), IGF-1% (B) and volume (C). GM, grey matter.
AUTHOR COPY ONLY
Research I Potorac et al. T2 weighted MRI 876 in acromegalyEndocrine
-Related Cancer
23:11
SSA treatment also was significantly greater in the visually assessed T2-hypo-intense (59.1%, Q1: 29.7%, Q3: 68.6%) as compared with T2-iso-intense (19.8%, Q1: 4.0%, Q3: 38.1%) and T2-hyper-intense (33.2%, Q1:13.0%, Q3: 47.9%) groups (P = 0.0003) (Fig. 2B). As with GH, the quantitative measurement of T2-weighted signal intensity correlated with the decrease of IGF-1% (lower T2 intensity adenomas had a significantly greater IGF-1% decrease)
(P < 0.0001, r = 0.14; Fig. 3B).
After SSA treatment, IGF-1 levels were normalized in 21/84 (25.0%) T2-hypo-intense, 7/19 (36.8%) hyper-intense and 0/17 iso-hyper-intense adenomas. Using a stricter
criteria of IGF-1 control plus a random GH <1 ng/mL,
disease control was achieved in 14/84 T2-hypo-intense (16.6%), no iso-intense and 3/19 hyper-intense (15.7%) adenomas (Fig. 4). No differences were seen in the statistical outcomes when the pasireotide-treated patients were excluded.
Tumor shrinkage and T2-weighted signal
There was significantly greater tumor shrinkage with SSA therapy in the T2-hypo-intense adenoma group (volume decrease: 37.8%, Q1: 24.7%, Q3: 49.3%) as compared with T2-iso-intense (8.0%, Q1: 4.1%, Q3: 13.8%) and T2-hyper-intense (3.0%, Q1: 1.0%,
Q3: 13.3%) adenomas (P < 0.0001; Figs 2C and 5).
Quantitative measurement of adenoma signal intensity confirmed the visual findings and found a significant positive correlation between T2 intensity and volume reduction with lower intensity adenomas having a
significantly greater volume reduction (P < 0.0001,
r = 0.33; Fig. 3C). When considering the generally
0 20 40 60 80 100 120 0 200 400 600 800 1000
Decrease in IGF−1 based on signal
Subjects IGF−1 (% of U .L.N.) Hypo Iso Hyper Figure 4
IGF-1% reduction under treatment depending on T2-weighted signal at diagnosis. The dotted line corresponds to 100% of the ULN.
Figure 5
Examples of volume and IGF-1 (% ULN) responses to SSA treatment in GH-secreting pituitary adenomas with different T2-weighted signals.
AUTHOR COPY ONLY
Research I Potorac et al. T2 weighted MRI 877 in acromegalyEndocrine
-Related Cancer
23:11
accepted significant cut-off of >20% tumor shrinkage,
82.1% T2-hypo-intense adenomas, 15.8% T2-hyper-intense and 17.6% T2-iso-T2-hyper-intense ones had achieved a significant volume reduction. Significantly more T2-hypo-intense adenomas, therefore, had a >20% tumor shrinkage compared with the T2-hyper- and
iso-intense group (P < 0.0001).
Discussion
In this multicenter study, we show that GH-secreting T2-hypo-intense pituitary adenomas at diagnosis have a significantly better response to primary SSA treatment not only in terms of hormonal but also anti-tumoral effects. T2-hypo-intense adenomas had the greatest hormonal response to SSA, with median decreases in random GH and IGF-1% of 88% and 59%, respectively. Furthermore, the shrinkage of T2-hypo-intense adenomas was of the order of 38%, whereas T2-iso- and hyper-intense adenomas had a median
shrinkage <10%. These reductions in hormone
levels and tumor size in T2-hypo-intense adenomas were greater than those seen with T2-iso-intense or T2-hyper-intense adenomas.
These results confirm and build upon previous studies on T2-weighted MRI signal intensity in acromegaly. As shown previously, T2-hypo-intensity is more frequent in smaller adenomas that are less invasive (Hagiwara
et al. 2003, Heck et al. 2012, Potorac et al. 2015). Also, T2-hyper-intensity is more frequent in sparsely granulated pituitary adenomas (Hagiwara et al. 2003, Heck et al. 2012). As these characteristics are related to easier control of acromegaly, this has spurred interest in the relationship between T2 intensity and response to SSA therapy. Predictors of responses to therapy in acromegaly could be useful to match treatments to the needs and characteristics of the patient. As patients may undergo neurosurgery or medical therapy as a primary treatment, different predictors of remission and control are needed. Neurosurgical remission rates are related to lower preoperative GH levels, smaller tumor size, lack of invasion and the expertise of the surgeon
(Ahmed et al. 1999, Nomikos et al. 2005, Starke et al.
2013). Recently, some novel genetic factors have been identified that predict difficult disease management in acromegaly. These newer factors, taken together with the standard pathological measures of tumor aggression such as granulation pattern, Ki-67 and gsp mutations can help to predict tumor responses to SSAs used
post-operatively (Barlier et al. 1998, Bhayana et al. 2005,
Fusco et al. 2008). For instance, mutations in the aryl hydrocarbon receptor interacting protein (AIP) gene lead to a significantly more aggressive phenotype in acromegaly including younger age at onset, larger tumor size, higher hormonal levels, and a significantly poorer response to SSA in terms of hormonal reduction and tumor shrinkage (Daly et al. 2010). Indeed, low immunohistochemical staining intensity for AIP in somatotrope tumors from acromegaly patients without
AIP mutations is a predictor of a poor response to SSA
(Jaffrain-Rea et al. 2009, Kasuki et al. 2012). X-linked
acrogigantism (X-LAG) syndrome due to GPR101 duplication is also markedly SSA-resistant (Beckers et al. 2015, Rostomyan et al. 2015). Also, tumors with low levels of somatostatin receptor subtype 2 (SSTR2) tend to have a lower responsiveness to treatment with SSTR2-specific
SSA like octreotide (Ferone et al. 2008, Taboada et al.
2008). Responses to pasireotide, a multi-somatostatin receptor specific ligand, also appear to be related to somatostatin receptor subtype 5 (SSTR5) expression (Iacovazzo et al. 2016). However, for predicting responses to primary pre-operative SSA therapy, non-invasive characteristics are required, which has driven the recent interest in MRI characteristics at diagnosis, particularly the T2 image intensity. It remains to be determined what relationship T2 intensity has to the underlying biological and pathophysiological nature of the tumor tissue and whether T2 signal intensity at baseline relates to immunohistochemical or genetic markers of tumor behavior in acromegaly.
In this study, the decreases in GH and IGF-1 correlated significantly with T2 signal intensity and the decreases were greatest among the T2-hypo-intense patients. These results are in keeping with those of Heck and coworkers, who showed median IGF-1 reductions of 51% for T2-hypo-intense, 36% for T2-iso-intense and 13% for T2-hyper-intense adenomas, respectively, and a higher IGF-1 control rate in T2-hypo-intense patients (Heck et al. 2012). In terms of control, however, in our study T2-hypo-intense adenomas had IGF-1 normalization in a quarter (21/84) of patients, whereas composite GH/IGF-1 control was achieved in 14/84 patients (16.6%). Normalization of IGF-1 and composite GH/IGF-1 was not achieved in any of the T2-iso-intense group, and in 7/19 and 3/19 patients, respectively, in the T2-hyper-intense group. It has been previously shown that lower baseline GH and IGF1 levels are associated with better hormonal responses to SSA treatment, expressed in terms of IGF1 normalization and achievement of a GH threshold concentration
AUTHOR COPY ONLY
Research I Potorac et al. T2 weighted MRI 878 in acromegalyEndocrine
-Related Cancer
23:11
(Mercado et al. 2007, Melmed et al. 2010). Here and
previously we reported that T2-hypo-intense adenomas have higher baseline GH and IGF1 levels despite having smaller and less invasive tumors than non-T2 hypo-intense adenomas (Potorac et al. 2015). Here we show that these patients have greater percentage decreases from baseline in hormones and tumor size during primary SSA therapy. As they are starting from a higher hormonal baseline level, these patients frequently do not reach the threshold for strict control despite having greater percentage decreases from baseline IGF1. The control rate in T2 hypo-intense adenomas is, however, similar to that achieved in other ‘real world’ clinical treatment settings, in which less than 25% of patients achieve strict control with octreotide or lanreotide
(Mercado et al. 2007, Espinosa-de-los-Monteros et al.
2015). For those T2-hypo-intense macroadenomas that appear difficult to fully resect with primary surgery, it may be that surgical debulking of such tumors would lead to a better hormonal control rate with
post-operative SSA therapy (Petrossians et al. 2005, Jallad
et al. 2007, Karavitaki et al. 2008).
Tumor shrinkage is an important benefit of SSA treatment in acromegaly that can alleviate clinical effects due to impingement on local structures around the pituitary tumor. Bevan and coworkers reported that around 50% of patients receiving primary SSA treatment have a significant volume reduction (Bevan 2005), whereas more recent studies report significant reductions after six months of treatment in 63% of patients (Mercado et al. 2007). The definition of significant volume reduction, however, varies from study to study and ‘significant’ shrinkage can be modest, of the order of 10–25%; for some years shrinkage of >20% has been considered to be clinically significant in trials of SSAs. We found that T2-hypo-intense tumors have significantly greater tumor shrinkage with SSA than T2-iso-intense or T2-hyper-intense adenomas. This shrinkage was nearly four times greater than in the other groups together and amounted to nearly 40%, which is a clinically meaningful change. When
considering the >20% volume reduction criteria, more
than 80% of T2-hypo-intense adenomas achieved this during SSA therapy as compared with less than 18% of either T2-hyper- and iso-intense adenomas. Previous studies of T2 intensity have shown variable results, with some indicating a correlation between T2 signal intensity at baseline and tumor shrinkage with SSA (Heck et al. 2015), whereas others showed no significant relationship (Puig-Domingo et al.
2010). This variability may have been due to the relatively small sample sizes analyzed for shrinkage in
previous studies (n = 34–49 patients), or due to
methodological difficulties in measuring tumor shrinkage in previously operated tumor remnants (Puig-Domingo et al. 2010). The results of the current study indicate that T2-hypo-intensity is not only a predictor of hormonal responses but also of greater tumor shrinkage with SSA therapy in acromegaly.
A number of studies have assessed T2 signal intensity in acromegaly and its relationship to disease characteristics. While the results generally support the utility of T2 intensity as a predictor of therapeutic responses, some important methodological issues remain. In this and in our previous multicenter study we used a straightforward grading system for T2 intensity that is based primarily on the intensity of the adjacent normal anterior pituitary. We believe that this is the most relevant comparison, as it assesses the tumor tissue against unaffected normal tissue from the same gland. Only when such tissue cannot be visualized do we rely on the comparison with the temporal gray matter. In the vast majority of cases, however, normal pituitary tissue is readily visualized. This provides a single yardstick by which to judge hypo-, hyper- and iso-intensity. In this study we show that this simple visual classification correlates very closely with the precise but more time-consuming ROI analysis and allows for the three T2 intensity groups to be readily determined and with no inter-group overlap. This visual system, therefore, has the benefit of being reliable and easy to perform and provides an immediate assessment without further computerized analyses. Other classification systems rely on comparisons between the tumor characteristics and two non-pituitary signals, namely temporal white and gray matter. This raises problems when trying to compare the findings of different studies. For example, the response to SSA of T2-iso-intense adenomas differs between our study and the recent study of Heck and coworkers. For the reasons outlined above, we defined iso-intensity as a similar intensity to that of normal pituitary tissue or gray matter. In contrast, Heck and coworkers defined as iso-intense all adenomas that have T2 intensities intermediate between that of temporal white and gray (Heck et al. 2012). This leads to variability in the number of adenomas being assigned to the iso-intense group using the different classifications. Using our methodology, iso-intense adenomas accounted for only 14.2% of 120 acromegaly cases (70% were hypo-intense and 15.8% were hyper-intense), whereas all three groups
AUTHOR COPY ONLY
Research I Potorac et al. T2 weighted MRI 879 in acromegalyEndocrine
-Related Cancer
23:11
were of similar proportion (28% hypo-intense, 36% iso-intense and 36% hyper-iso-intense) in the Norwegian series. Moreover, depending on the technical characteristics of the MRI examination, contrast between gray and white matter can be adjusted, thereby modifying the range of intermediate intensities. In our study, T2-iso-intense adenomas are those adenomas with a very similar signal to that of gray matter and/or normal pituitary, as attested by the narrow corresponding range of ROI adenoma/ ROI gray matter ratio (Fig. 1). Using our method, iso-intense adenomas represent a smaller group of tumors than using other methods, and their characteristics and behavior appear to be similar to the T2-hyper-intense group. This method to assess T2-weighted signal classification as compared with gray matter alone seems to be gaining popularity (Heck et al. 2015). From a practical point of view, we suggest that T2-iso-intense adenomas might in future be grouped along with hyper-intense tumors into a single non-hypo-hyper-intense category that has lower percentage decreases from baseline in hormonal levels and tumor volume. In support of this we found no statistically significant differences between the hormonal (in percentage decrease from baseline) and anti-tumoral response to SSA treatment of the T2-iso- and the hyper-intense groups. However, as the hormonal responses of the iso- and hyper-intense groups did not separate completely from the T2-hypo-intense group in terms of IGF1 normalization, further work on this topic remains necessary.
A potential limitation of our study is the fact that it does not perfectly reflect the general population of acromegaly patients. Only adenomas treated pre-operatively with SSA were included. Therefore, the proportions of T2-hypo/iso/hyper-intense adenomas are not identical to those in large, unselected populations like in our previous study (Potorac et al. 2015). This point will require further studies to be performed on larger series of T2-iso- and hyper-intense adenomas, which could help to clarify the differences between T2 hypo-intense and non-hypo-intense tumors in acromegaly patients. Another potential issue is the difference in treatment timing and decision-making between centers. However, doses of SSA did not differ between adenomas with different types of T2-weighted signal, so treatments appear to be prescribed uniformly. In our view, having a heterogeneous international population of acromegaly patients from 23 centers may serve to reduce bias and indicates that the results could be applied to international acromegaly populations generally.
This large international study confirms that T2-weighted adenoma signal in acromegaly allows for the classification of adenomas into groups with different responses to SSA treatment. These differences are present in terms of both hormonal reduction and tumor shrinkage. The measured intensity of T2-weighted signal correlates with the magnitude of these responses; T2 hypo-intense adenomas constitute the largest group and have better hormonal and tumor shrinkage responses to SSA treatment. Visual assessment by comparison of adenoma signal to that of normal pituitary tissue or temporal lobe gray matter is reliable and easy to use in daily practice. These results from a diverse, international cohort support the utility of T2-weighted signal as a predictive factor of response to primary SSA treatment and may be a useful tool in future prospective studies of SSA in acromegaly.
Declaration of interest
The authors report no conflict of interest that could interfere with the performance, analysis or reporting of the study.
Funding
This study was supported in part by the Fonds d’Investissment pour la Recherche (FIRS) of the Centre Hospitalier Universitaire de Liege.
Acknowledgements
The authors would like to thank the following colleagues for contributing individual patient data and analyses to the study: Frederic Illouz, Vincent Rohmer, Veronique Lapras, Emmanuel Jouanneau, Michael Buchfelder, Laura Roffredo, Analia Emilce Ramos, Helene Bihan, Evgeniya Panteleeva and Gulnar Vagapova.
References
Ahmed S, Elsheikh M, Stratton IM, Page RC, Adams CB & Wass JA 1999 Outcome of transphenoidal surgery for acromegaly and its relationship to surgical experience. Clinical Endocrinology 50 561–567. (doi:10.1046/j.1365-2265.1999.00760.x)
Barlier A, Gunz G, Zamora AJ, Morange-Ramos I, Figarella-Branger D, Dufour H, Enjalbert A & Jaquet P 1998 Pronostic and therapeutic consequences of Gs alpha mutations in somatotroph adenomas. Journal of Clinical Endocrinology and Metabolism 83 1604–1610.
(doi:10.1210/jc.83.5.1604)
Beckers A, Lodish M, Trivellin G, Rostomyan L, Lee M, Faucz FR, Yuan B, Choong C, Caberg JH, Verrua E et al. 2015 X-linked acrogigantism (X-LAG) syndrome: clinical profile and therapeutic responses. Endocrine-Related Cancer 22 353–367. (doi:10.1530/ERC-15-0038)
Bevan JS 2005 Clinical review: the antitumoral effects of somatostatin analog therapy in acromegaly. Journal of Clinical Endocrinology and
Metabolism 90 1856–1863. (doi:10.1210/jc.2004-1093)
Bhayana S, Booth GL, Asa SL, Kovacs K & Ezzat S 2005 The implication of somatotroph adenoma phenotype to somatostatin analog
AUTHOR COPY ONLY
Research I Potorac et al. T2 weighted MRI 880 in acromegalyEndocrine
-Related Cancer
23:11
responsiveness in acromegaly. Journal of Clinical Endocrinology and
Metabolism 90 6290–6295. (doi:10.1210/jc.2005-0998)
Cuevas-Ramos D, Carmichael JD, Cooper O, Bonert VS, Gertych A, Mamelak AN & Melmed S 2015 A structural and functional acromegaly classification. Journal of Clinical Endocrinology and
Metabolism 100 122–131. (doi:10.1210/jc.2014-2468)
Daly AF, Rixhon M, Adam C, Dempegioti A, Tichomirowa MA & Beckers A 2006 High prevalence of pituitary adenomas: a cross-sectional study in the province of Liege, Belgium. Journal of Clinical Endocrinology and
Metabolism 91 4769–4775. (doi:10.1210/jc.2006-1668)
Daly AF, Tichomirowa MA, Petrossians P, Heliovaara E, Jaffrain-Rea ML, Barlier A, Naves LA, Ebeling T, Karhu A, Raappana A et al. 2010 Clinical characteristics and therapeutic responses in patients with germ-line AIP mutations and pituitary adenomas: an international collaborative study. Journal of Clinical Endocrinology and Metabolism
95 E373–E383. (doi:10.1210/jc.2009-2556)
Espinosa-de-los-Monteros AL, Gonzalez B, Vargas G, Sosa E & Mercado M 2015 Octreotide LAR treatment of acromegaly in ‘real life’: long-term outcome at a tertiary care center. Pituitary 18 290–296. (doi:10.1007/s11102-014-0570-0)
Fernandez A, Karavitaki N & Wass JA 2010 Prevalence of pituitary adenomas: a community-based, cross-sectional study in Banbury (Oxfordshire, UK). Clinical Endocrinology 72 377–382.
(doi:10.1111/j.1365-2265.2009.03667.x)
Ferone D, de Herder WW, Pivonello R, Kros JM, van Koetsveld PM, de Jong T, Minuto F, Colao A, Lamberts SW & Hofland LJ 2008 Correlation of in vitro and in vivo somatotropic adenoma responsiveness to somatostatin analogs and dopamine agonists with immunohistochemical evaluation of somatostatin and dopamine receptors and electron microscopy. Journal of Clinical Endocrinology
and Metabolism 93 1412–1417. (doi:10.1210/jc.2007-1358)
Fusco A, Zatelli MC, Bianchi A, Cimino V, Tilaro L, Veltri F, Angelini F, Lauriola L, Vellone V, Doglietto F et al. 2008 Prognostic significance of the Ki-67 labeling index in growth hormone-secreting pituitary adenomas. Journal of Clinical Endocrinology and Metabolism 93 2746–2750. (doi:10.1210/jc.2008-0126)
Hagiwara A, Inoue Y, Wakasa K, Haba T, Tashiro T & Miyamoto T 2003 Comparison of growth hormone-producing and non-growth hormone-producing pituitary adenomas: imaging characteristics and pathologic correlation. Radiology 228 533–538. (doi:10.1148/ radiol.2282020695)
Heck A, Emblem KE, Casar-Borota O, Bollerslev J & Ringstad G 2015 Quantitative analyses of T2-weighted MRI as a potential marker for response to somatostatin analogs in newly diagnosed acromegaly. Endocrine 52 333–343. (doi:10.1007/s12020-015- 0766-8)
Heck A, Ringstad G, Fougner SL, Casar-Borota O, Nome T, Ramm-Pettersen J & Bollerslev J 2012 Intensity of pituitary adenoma on T2-weighted magnetic resonance imaging predicts the response to octreotide treatment in newly diagnosed acromegaly.
Clinical Endocrinology 77 72–78. (doi:10.1111/j.1365-2265.
2011.04286.x)
Iacovazzo D, Carlsen E, Lugli F, Chiloiro S, Piacentini S, Bianchi A, Giampietro A, Mormando M, Clear AJ, Doglietto F et al. 2016 Factors predicting pasireotide responsiveness in somatotroph pituitary adenomas resistant to first-generation somatostatin analogues: an immunohistochemical study. European Journal of Endocrinology 174 241–250. (doi:10.1530/EJE-15-0832)
Jaffrain-Rea M-L, Angelini M, Gargano D, Tichomirowa MA, Daly AF, Vanbellinghen J-F, D’Innocenzo E, Barlier A, Giangaspero F, Esposito V et al. 2009 Expression of aryl hydrocarbon receptor (AHR) and AHR-interacting protein in pituitary adenomas: pathological and clinical implications. Endocrine-Related Cancer 16 1029–1043. (doi:10.1677/ERC-09-0094)
Jallad RS, Musolino NR, Kodaira S, Cescato VA & Bronstein MD 2007 Does partial surgical tumour removal influence the response to
octreotide-LAR in acromegalic patients previously resistant to the somatostatin analogue? Clinical Endocrinology 67 310–315. (doi:10.1111/j.1365-2265.2007.02885.x)
Karavitaki N, Thanabalasingham G, Shore HC, Trifanescu R, Ansorge O, Meston N, Turner HE & Wass JA 2006 Do the limits of serum prolactin in disconnection hyperprolactinaemia need re-definition? A study of 226 patients with histologically verified non-functioning pituitary macroadenoma. Clinical Endocrinology 65 524–529. (doi:10.1111/j.1365-2265.2006.02627.x)
Karavitaki N, Turner HE, Adams CB, Cudlip S, Byrne JV,
Fazal-Sanderson V, Rowlers S, Trainer PJ & Wass JA 2008 Surgical debulking of pituitary macroadenomas causing acromegaly improves control by lanreotide. Clinical Endocrinology 68 970–975.
(doi:10.1111/j.1365-2265.2007.03139.x)
Kasuki L, Vieira Neto L, Wildemberg LE, Colli LM, de Castro M, Takiya CM & Gadelha MR 2012 AIP expression in sporadic somatotropinomas is a predictor of the response to octreotide LAR therapy independent of SSTR2 expression. Endocrine-Related Cancer
19 L25–L29. (doi:10.1530/ERC-12-0020)
Katznelson L, Laws ER Jr, Melmed S, Molitch ME, Murad MH, Utz A & Wass JA 2014 Acromegaly: an endocrine society clinical practice guideline. Journal of Clinical Endocrinology and Metabolism 99 3933–3951. (doi:10.1210/jc.2014-2700)
Lundin P & Pedersen F 1992 Volume of pituitary macroadenomas: assessment by MRI. Journal of Computer Assisted Tomography 16 519–528. (doi:10.1097/00004728-199207000-00004)
Melmed S 2016 New therapeutic agents for acromegaly. Nature Reviews
Endocrinology 12 90–98. (doi:10.1038/nrendo.2015.196)
Melmed S, Casanueva FF, Hoffman AR, Kleinberg DL, Montori VM, Schlechte JA & Wass JA 2011 Diagnosis and treatment of
hyperprolactinemia: an Endocrine Society clinical practice guideline. Journal of Clinical Endocrinology and Metabolism 96 273–288.
(doi:10.1210/jc.2010-1692)
Melmed S, Cook D, Schopohl J, Goth MI, Lam KS & Marek J 2010 Rapid and sustained reduction of serum growth hormone and insulin-like growth factor-1 in patients with acromegaly receiving lanreotide Autogel therapy: a randomized, placebo-controlled, multicenter study with a 52 week open extension. Pituitary 13 18–28. (doi:10.1007/s11102-009-0191-1)
Mercado M, Borges F, Bouterfa H, Chang TC, Chervin A, Farrall AJ, Patocs A, Petersenn S, Podoba J, Safari M et al. 2007 A prospective, multicentre study to investigate the efficacy, safety and tolerability of octreotide LAR (long-acting repeatable octreotide) in the primary therapy of patients with acromegaly. Clinical Endocrinology 66 859–868. (doi:10.1111/j.1365-2265.2007.02825.x)
Nomikos P, Buchfelder M & Fahlbusch R 2005 The outcome of surgery in 668 patients with acromegaly using current criteria of
biochemical ‘cure’. European Journal of Endocrinology 152 379–387. (doi:10.1530/eje.1.01863)
Petrossians P, Borges-Martins L, Espinoza C, Daly A, Betea D, Valdes-Socin H, Stevenaert A, Chanson P & Beckers A 2005 Gross total resection or debulking of pituitary adenomas improves hormonal control of acromegaly by somatostatin analogs.
European Journal of Endocrinology 152 61–66. (doi:10.1530/
eje.1.01824)
Potorac I, Petrossians P, Daly AF, Schillo F, Ben Slama C, Nagi S, Sahnoun Fathallah M, Brue T, Girard N, Chanson P et al. 2015 Pituitary MRI characteristics in 297 acromegaly patients based on T2-weighted sequences. Endocrine-Related Cancer 22 169–177. (doi:10.1530/ERC-14-0305)
Puig-Domingo M, Resmini E, Gomez-Anson B, Nicolau J, Mora M, Palomera E, Marti C, Halperin I & Webb SM 2010 Magnetic resonance imaging as a predictor of response to somatostatin analogs in acromegaly after surgical failure. Journal of Clinical
Endocrinology and Metabolism 95 4973–4978. (doi:10.1210/
AUTHOR COPY ONLY
Research I Potorac et al. T2 weighted MRI 881 in acromegalyEndocrine
-Related Cancer
23:11
Received in final form 7 September 2016 Accepted 20 September 2016
Accepted Preprint published online 20 September 2016
R Core Team 2014 R: A Language and Environment for Statistical Computing. Vienna, Austria: R Core Team.
Rostomyan L, Daly AF, Petrossians P, Nachev E, Lila AR, Lecoq AL, Lecumberri B, Trivellin G, Salvatori R, Moraitis AG et al. 2015 Clinical and genetic characterization of pituitary gigantism: an international collaborative study in 208 patients. Endocrine-Related
Cancer 22 745–757. (doi:10.1530/ERC-15-0320)
Sarkar D 2008 Lattice: Multivariate Data Visualization with R. New York, NY, USA: Springer, ISBN 978-0-387-75968-5.
Sarkar S, Rajaratnam S, Chacko G & Chacko AG 2014
Endocrinological outcomes following endoscopic and microscopic transsphenoidal surgery in 113 patients with acromegaly.
Clinical Neurology and Neurosurgery 126 190–195. (doi:10.1016/
j.clineuro.2014.09.004)
Starke RM, Raper DM, Payne SC, Vance ML, Oldfield EH & Jane JA Jr 2013 Endoscopic vs microsurgical transsphenoidal surgery for acromegaly: outcomes in a concurrent series of patients using modern criteria for remission. Journal of Clinical
Endocrinology and Metabolism 98 3190–3198. (doi:10.1210/
jc.2013-1036)
Taboada GF, Luque RM, Neto LV, Machado Ede O, Sbaffi BC, Domingues RC, Marcondes JB, Chimelli LM, Fontes R, Niemeyer P et al. 2008 Quantitative analysis of somatostatin receptor subtypes (1–5) gene expression levels in
somatotropinomas and correlation to in vivo hormonal and tumor volume responses to treatment with octreotide LAR.
European Journal of Endocrinology 158 295–303.