UNIVERSITE DU QUEBEC
A THESIS SUBMITTED IN PARTIAL FULFILMENT OF
THE REQUIREMENTS FOR THE DEGREE
OF
DOCTOR OF PHYLOSOPHY
IN ELECTRICAL ENGINEERING
By
SHAHAB FAROKHI
MECHANISMS OF ARC PROPAGATION OVER AN
ICE SURFACE
UNIVERSITE DU QUEBEC
THESE PRESENTEE A
L'UNIVERSITÉ DU QUÉBEC À CHICOUTIMI
COMME EXIGENCE PARTIELLE
DU DOCTORAT EN INGÉNIERIE
PAR
SHAHAB FAROKHI
MECANISMES DE PROPAGATION DE L'ARC
ÉLECTRIQUE À LA SURFACE DE GLACE
MECHANISMS OF ARC PROPAGATION OVER
ANICE SURFACE
ABSTRACT
Outdoor insulation design with regard to pollution and icing performance is a
critical factor for reliability of overhead transmission lines. The majority of failures
occurring on transmission lines are caused by environmental conditions such as lightning,
pollution and/or ice. Accumulated ice on insulators may initiate corona discharge; these
partial arcs sometimes lead to flashover. This phenomenon is mainly caused by the
presence of a highly conductive water film on the surface of the ice and ice-free zones,
often called air gaps, along the insulators, and decreased insulator leakage distance caused
by ice bridging.
The general objective of this research is to investigate the physical mechanisms
involved in the propagation of electric arc on the surface of ice. In the present research
work, high-speed photography techniques was combined with synchronized electrical
measurements to study the various parameters of arc on an ice surface, such as channel
radius and propagation velocities. These results, together with studying the propagation
patterns and arc foot geometries, provide background information for understanding the
complete flashover phenomenon. Arc root structure, current profile, propagation pattern
and velocity were investigated under positive and negative polarities. Water film
conductivity and thickness, and relative air humidity were also analyzed as influencing
parameters of arc propagation. The effects of different mechanisms, e.g. collision and
thermal ionization, buoyancy force and electrostatic force, on different stages of arc
propagation are also discussed.
Repetitive patterns corresponding to arc decays were observed during arc
propagation. During arc re-ignitions, an anode-directed streamer was found to be dominant,
was branched; on the contrary, the negative arc root appeared as a diffused luminous
region. In the arc channel section, two distinct regions were distinguished. A linear
relationship between the initiation current and the inverse of residual resistance was
established, showing how important is the effect of water film thickness on the initiation of
discharge. It was found there is a direct relationship between the slope of current increase
and the applied water conductivity. Air humidity increases the voltage gradient along the
arc channel and reduces the discharge activities at the arc tip. However, it could influence
the arc formation and its propagation by changing the thickness of the water film. A change
in the dominant mechanism from thermal ionization to collision ionization in the enhanced
RESUME
La conception des isolateurs d'extérieur en relation avec leur performance dans des
conditions de pollution et de givrage est un facteur critique pour la fiabilité des lignes de
transmission aériennes. La majorité des pannes survenant sur les lignes de transmission
sont causées par les conditions environnementales comme la foudre, la pollution et/ou le
givrage atmosphérique. La présence de glace sur les isolateurs peut initier des décharges
couronnes et des arcs partiels, qui peuvent parfois conduire au contournement. Ce
phénomène est principalement dû à la présence d'un film dfeau très conducteur à la surface
de la glace et à celle de zones libres de glace, généralement nommées intervalles d'air, ainsi
qu'à la diminution de la distance de fixité de l'isolateur causée par le court-circuitage par la
glace de l'intervalle entre les jupes.
Uobjectif général de cette recherche est d'étudier les mécanismes physiques
impliqués dans la propagation de Tare électrique à la surface de la glace. Dans le présent
travail de recherche, en employant des techniques de photographie à haute vitesse
combinées à des mesures synchronisées, différents paramètres électriques de l'arc formé à
la surface de la glace, comme le rayon du canal et les vitesses de propagation, ont été
étudiés. Ces résultats, ainsi que la modélisation de la propagation et de l'arc et de la
géométrie du pied d'arc, fourniront des informations de base pour comprendre le
phénomène du contournement dans son ensemble. La structure de la racine d'arc, le profil
de courant, le modèle de propagation et la vitesse ont été étudiés en polarités positives et
négatives. La conductivité et l'épaisseur du film d'eau ainsi que l'humidité relative de l'air
ont également été analysés en tant que paramètres pouvant influencer la propagation de
force de flottabilité et la force électrostatique sur les différentes étapes de la propagation de
l'arc ont également été discutés.
Des séquences répétitives correspondant aux extinctions de l'arc ont été observées
pendant la propagation de l'arc. Durant les périodes de ré-allumage de l'arc, le phénomène
dominant était l'apparition d'un streamer positif dirigé vers Panode5 et ce, quelle que soit la
polarité de la tension appliquée. Le pied de l'arc sous tension continue positive est ramifié;
à l'opposé, celui de l'arc négatif apparaît comme une région diffuse lumineuse. Dans la
section du canal de l'arc5 deux régions distinctes ont été distinguées. Une relation linéaire
entre le courant d'initiation et l'inverse de la résistance résiduelle a été établie, montrant
l'importance de l'épaisseur du film d'eau sur l'initiation de la décharge. Une relation directe
entre la pente de l'accroissement du courant et la conductivité de l'eau de congélation a été
établie. L'humidité de l'air augmente le gradient de tension le long du canal de l'arc et
réduit les activités de décharge à la tête de l'arc. Toutefois, elle pourrait influencer le
développement et la propagation de l'arc en modifiant l'épaisseur du film d'eau. On a trouvé
qu'un changement dans le mécanisme dominant, à savoir le passage de l'ionisation
thermique à l'ionisation par collision sous le champ électrique intensifié, était responsable
ACKNOWLEDGMENTS
This work was carried out within the framework of the NSERC/Hydro-Quebec/UQAC Industrial Chair on Atmospheric Icing of Power Network Equipment (CIGELE) and the Canada Research Chair on Atmospheric Icing Engineering of Power Networks (INGIVRE) at Université du Québec à Chicoutimi (UQAÇ). I would like to thank the CIGELE partners (Hydro-Québec, Hydro One, Réseau Transport d'Électricité (RTE) and Électricité de France (EDF)9 Alcan Cable, K-Line
Insulators, Tyco Electronics, Dual-ADE, CQRDA, and FUQAC) whose financial support made this research possible.
This dissertation would not have been possible without the guidance and the help of several individuals who in one way or another contributed and extended their valuable assistance in the preparation and completion of this study.
I would like to express my deepest gratitude to my supervisor, Professor Masoud Farzaneh, for his supervision, encouragement, patience, and support during the entire project. His multidisciplinary knowledge and logical way of thinking have been of great value for me.
I want to express my gratitude and respect to my co-supervisor Prof. Issouf Fofana, for not only his guidance, but also human qualities. I am especially thankful to him for his sincere and good humour, which were essential in realizing this project.
I would like to express my thanks to the director of graduate studies Prof. Duygu Kocaeffe for her valuable comments during my evaluation seminars. I am very grateful to Prof. George G. Karady from Arizona state University, Prof. K.D. Sirvatsava from University of British Columbia and Dr. Ibrahima Ndiaye of CEGERTEC for accepting to be jury members and for their constructive criticism which contributed to improve the quality of this thesis.
I gratefully acknowledge Dr. William A. Chisholm for his valuable discussions and friendly help. Thanks for enduring my constant questions and offering valuable feedback through the phases of this project. I am very grateful to Prof. Christophe Volât for his constructive comments and suggestions during my evaluation seminars..
I would like to extend my thanks to Marc André Perron, Xavier Bouchard, Pierre Camirand, and Claude Damours at CIGELE Laboratory for their technical support and to Denis Masson and Désirée Lezou for their help with administrative tasks.
I am very grateful to Jean Talbot for his precious efforts and editorial help for making this thesis legible.
I would also like to thank my father and mother for the support they provided me through my entire life.
Azam, my beloved wife, was a very important contributor to the successful completion of this work. Thank you for helping me with arranging the experimental setup, debugging the technical problems and collabration in preparing papers and presentations. I want to thank her for all the support that she gave me during the years I have been working on this thesis, especially all the holidays that she arranged to give me time to write, to think and to talk to her about this subject. Words fail me to express my appreciation to her whose dedication, love and persistent confidence in me, has taken the load off my shoulder. Thanks to my cute daughter, Najin, who scarified a lot since she was one year old to help me complete my study.
TABLE OF CONTENTS
ABSTRACT... . i
RÉSUMÉ iil ACKNOWLEDGMENTS v TABLE OF CONTENTS vii LIST OF FIGURES ...x LIST OF TABLES... ....xii CHAPTER 1 1 INTRODUCTION... 1 1.1. Overview... .. 2 1.2. Problem description ...4 1.3. Research objectives , ...6 1.4. Methodology... ...8 1.5. Statement of originality and contribution to knowledge... 10 1.6. Thesis outline 11 CHAPTER 2 12 LITERATURE REVIEW.. .12 2.1. Introduction ...13 2.2. Mechanisms of discharge propagation over an electrolyte surface . 14 2.3. Discharge propagation on an ice surface 24 2.4. Effect of voltage polarity.... . 28 2.5. The effect of humidity 29 2.6. Conclusions 30 CHAPTER 3 31 FACILITIES AND PROCEDURES 31 3.1. Introduction.. 32 3.2. Test facilities .33 3.2.1. High-voltage equipment ...33 3.2.2. Current and voltage measurement devices 34 3.2.3. Climate chamber 34 3.2.4. High-speed camera ...35 3.2.5. Image intensifier 35 3.2.6. PMT... 36 3.2.7. Corona detection camera .. 36 3.2.8. Data acquisition system ....36 3.3. Procedure. 37 3.3.1V Physical test setup preparation... ....38 3.3.2. Setup alignments... ...40
'• 3.3.3. Voltage application. ...41 3.3.4. Effects of humidity on test procedure... 42 3.3.5. Water film thickness test procedure ,. 42 3.3.6. Water film thickness measurement procedure... ....44
3.3.7. Synchronization between electrical and optical measurements... 44
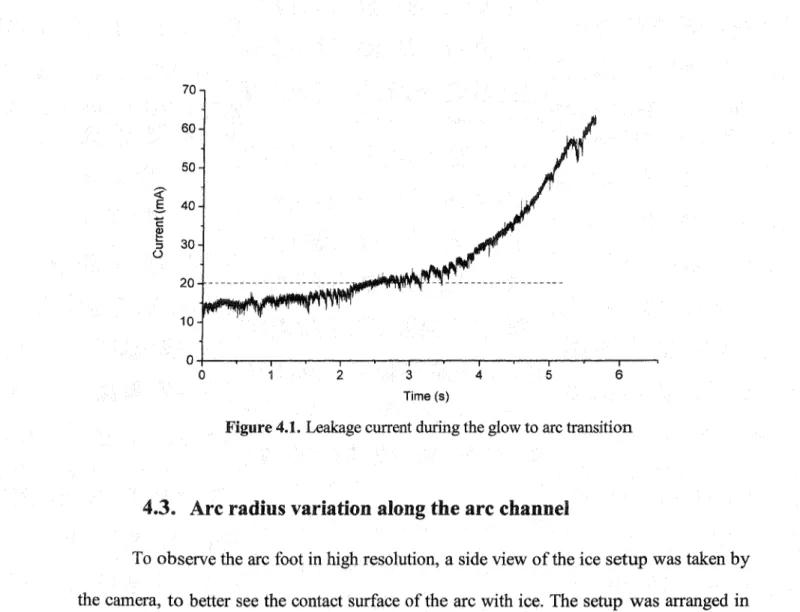
CHAPTER 4 .46 EXPERIMENTAL RESULTS ON ARC PROPAGATION FEATURES 46 4.1. Introduction... 47 4.2. Glow to arc transition threshold.... . . .48 4.3. Arc radius variation along the arc channel 49 4.4. Arc radius and leakage current... ..51 4.5. Arc propagation features 52 4.6. Major and minor collapses... 57 4.6.1. DC-positive... ..59 4.6.2. DC-negative 64 4.6.3. Physical appearance of the channel and contact surface ...68 4.6.4. Anode and cathode current jumps 72 4.7. Effect of propagation direction on velocity ...74 4.8. V-I characteristics of DC-positive arc on ice surfaces ...74 4.9. AC discharge propagation... 79 4.9.1. Subsidiary discharge along AC arcs. 80 4.9.2. Final jump ...81 4.9.3. Effect of applied water conductivity... .84 4.10. Conclusion .85 CHAPTERS ...86 EFFECT OF WATER FILM AND AIR HUMIDITY 86 5.1. Introduction 87 5.2. Effects of water film 88 5.2.1. Effect of residual resistance on discharge initiation... 90 5.2.2. The effect of water film thickness on leakage current variation 92 5.2.3. Effect of water conductivity ..94 5.3. Humidity effect... 95 5.3.1. Effect of humidity on visible discharge initiation ...95 5.3.2. Effect of humidity on discharge propagation ...98 5.4. Conclusion... 99 CHAPTER 6 ..100 INVOLVED MECHANISMS IN ARC PROPAGATION OVER AN ICE SURFACE... 100 6.1. Introduction ....101 6.2. General appearance of arc column 102 6.2.1. Glow-to-arc transition threshold 102 6.2.2. Arc radius and leakage current 102 6.2.3. Space charge distribution around the channel 102 6.2.4. Arc radius variation along the arc channel ...104 6.2.5. Arc channel luminosity 104
6.3. Arc propagation pattern and features 105 6.3.1. General pattern ....105 6.3.2. Major and minor collapses 106 6.4. Anode and cathode current jumps 109 6.5. Water film. 110 6.6. Effect of humidity I l l 6.7. General discussion on the mechanisms of arc development 114 6.8. Conclusion 117 CHAPTER 7.. 119 CONCLUSIONS AND RECOMMENDATIONS ..119 7.1. Conclusions and Contributions of the Thesis 120 7.2. Recommendations for future work... 125 REFERENCES 127
LIST OF FIGURES
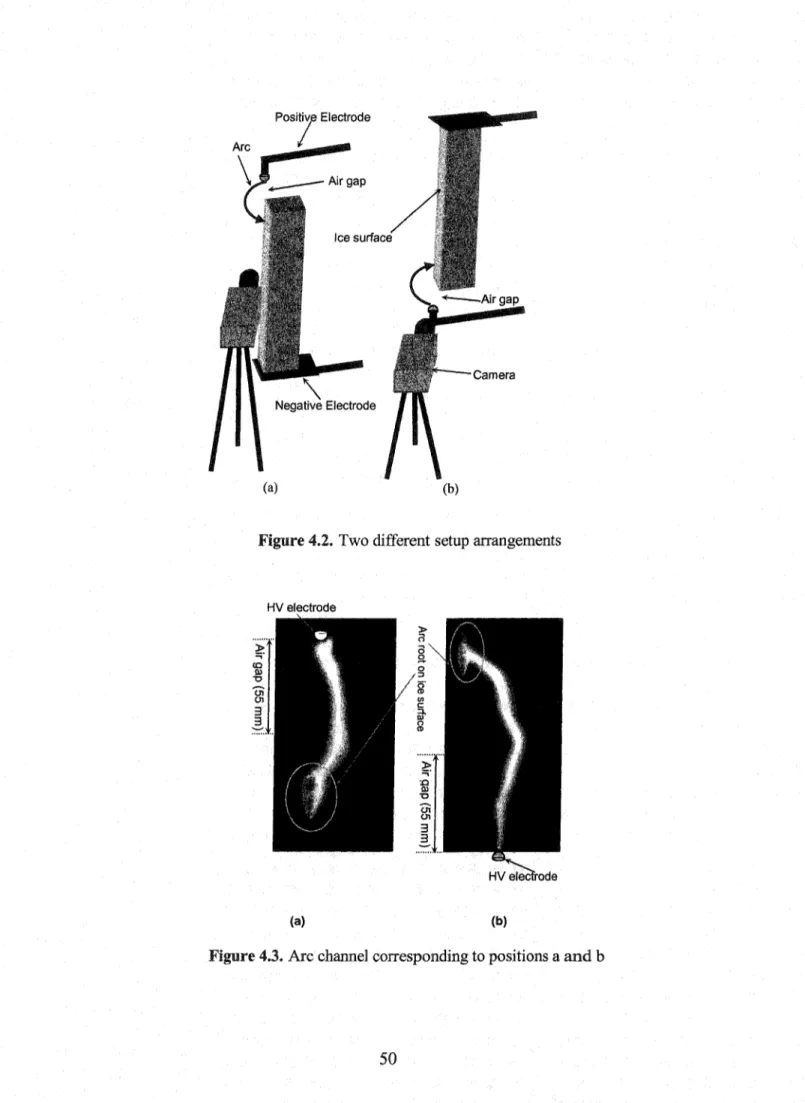
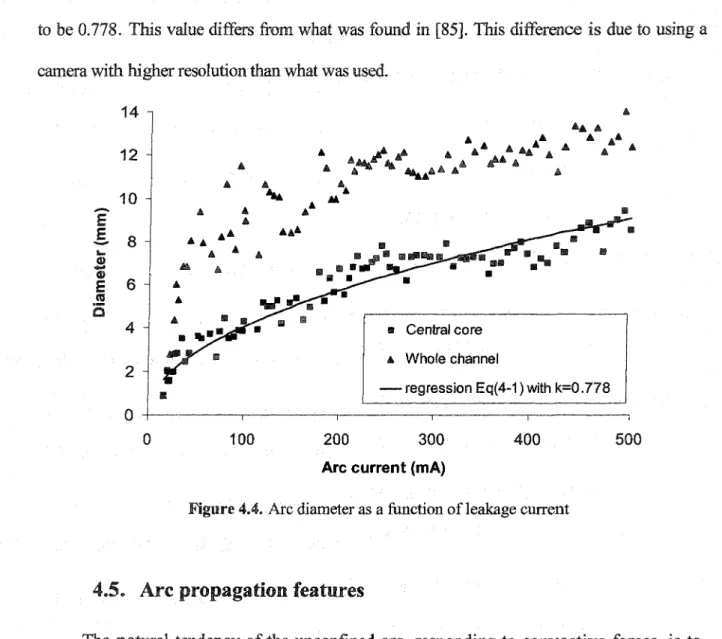
Figure 2.1. Proposed mechanism of elongation [37]: . 1 Figure 3.1» A schematic diagram of physical setup and equipment. ...38 Figure 3.2. Ice geometry (model a) ..39 Figure 3.3. Ice geometry (model b) ...40 Figure 3.4. Two different setup arrangements in vertical position ....41 Figure 3.5. Setup arrangement to study the effect of water film .43 Figure 3.6. Water film thickness measurement . .44 Figure 4.1. Leakage current during the glow to arc transition 49 Figure 4.2. Two different setup arrangements ...50 Figure 4.3. Arc channel corresponding to positions a and b .50 Figure 4.4. Arc diameter as a function of leakage current 52 Figure 4.5. Arc current saw-tooth-like shape ...53 Figure 4.6. Branched arc channel in contact with the ice surface 54 Figure 4.7. (a) Widespread branched arc channel (b) secondary arc foot 55 Figure 4.8. Arc channel side view: ..56 Figure 4.9. Arc propagation pattern at 4000 frames per second... ...56 Figure 4.10. Leakage current, (a) four major arc collapses associated with four current
jumps are indicated (b) minor arc collapses .59 Figure 4.11. Major collapse under DC+: ....62 Figure 4.12. Minor collapse under DC+: 63 Figure 4.13. Minor collapse in vertical position 64 Figure 4.14. Major arc collapse (Notice hot gas remnants along former arc path.) 64 Figure 4.15. Major collapse under DC-: 67 Figure 4.16. Discharge length during a major collapse under DC-negative, and estimated velocity of propagation ....68 Figure 4.17. Minor collapse under DC-: 70 Figure 4.18. Arc root under dc positive voltage ..71 Figure 4.19. Arc root under dc negative voltage (Reflections from the ice surface are
seen in the side view) 71 Figure 4.20. (a) Discharge activity beneath the negative arc column (b) high-voltage
electrode (c) arc core (d) arc sheath 72 Figure 4.21. Cathode current during a major collapse under DC-positive: ..73 Figure 4.22. Anode current during a major collapse under DC-negative: 73 Figure 4.23. V-I characteristics used for calculations 76 Figure 4.24. Static and dynamic arc characteristics [97] 78 Figure 4.25. Arc voltage gradient versus current [97] 78 Figure 4.26. UV photograph of main and subsidiary discharge zones ..81 Figure 4.27. Photographs of the flashover process 83 Figure 4.28. Simultaneous presentation of applied voltage, leakage current and arc root
location in the last half-cycle before flashover 83 Figure 4.29* Effect of applied water conductivity on arc velocity ...84
Figure 5.1. Variation of (a) leakage current and (b) resistance 89 Figure 5*2* Water film thickness versus exposure time to ambient temperature
(measured value and fitted curve). 91 Figure 5 3 . Measured initiation current versus different values of 1/R^s ...92 Figure 5.4* Leakage current variation for two different initial water film thicknesses .93 Figure 5,5* Shifted curves corresponding to Figure 5.4 93 Figure 5.6. Leakage current variation for different tests 94 Figure 5.7* Inception voltage for different air humidity levels ...97 Figure 5.8. Measured resistances for three humidity levels using two different
exposure times (A) 5 minutes (B) 60 minutes ....97 Figure 5.9* Calculated water film thickness for three humidity levels using two
different exposure times (A) 5 minutes (B) 60 minutes 98 Figure 6*1. Space charge distribution during a major collapse in DC-negative: ..109
LIST OF TABLES
CHAPTER 1
INTRODUCTION
CHAPTER 1
INTRODUCTION
1.1. Overview
Ice accretion normally occurs when rain falls from an elevated above-freezing air
layer into a colder, sub-freezing air layer near the ground. This causes the liquid
precipitation (or drizzle) to freeze on contact with surfaces whose temperature is at or
below 0°C. Prolonged or heavy freezing rain events could result in
several-centimeters-thick ice layers on vegetation, buildings, vehicles, power lines, towers, and other manmade
structures. Open structures that are not properly designed to withstand increased ice and
wind loads may fail. Excessive ice loads may lead to mechanical damage to power network
equipment, especially ground wires, phase conductor and towers. In many cold climate
regions, overhead transmission lines and substations are subjected to ice and snow
accumulation due to different events such as freezing rain and drizzle, in-cloud icing, icing
fog and wet snow [1 - 6 ] . In addition to mechanical issues, ice accretion may disrupt the
electrical performance of power networks. The electrical problems are mostly related to the
flashover of insulators under icing conditions, sometimes leading to power outages.
Insulator ilasho vers and consequent power outages under the influence of contaminated ice
Outdoor insulation design with regard to pollution and icing performance is a
critical factor for the reliability of power networks. The majority of transmission line
failures are caused by environmental conditions such as lightning, pollution and/or ice. This
is the reason why researchers around the world commenced serious field and laboratory
investigations when the consequences of these phenomena came to light. Reports and
observations have shown that the number of faults increases after ice accretion and during
the melting phase following a rise in ice surface temperature.
A good deal of laboratory research has been conducted in this respect [e.g. 3, 15 —
17]. As a general rule, these reports and studies indicate that the thickness and type of ice,
the level of contamination and the rise in air temperature have significant effects on the
withstand voltage of ice-covered insulators. Researchers do agree that ice surface flashover
is caused mainly by the combination of several phenomena, including [3, 185 19 and 30]:
Decrease in effective leakage distance caused by ice bridging;
Presence of a pollution layer at the surface of the ice;
Increase in surface conductivity caused by the presence of a water film
resulting from various factors, such as wet ice accretion process,
condensation, heating effect of leakage current, partial arcs, rise in air
temperature, or sunshine;
Formation of air gaps caused by the heating effect of partial arcs, a rise in air
temperature, or ice shedding.
Ice accretion along energized insulators may not be uniform [29]. The parts of the
presence of a water film on the ice surface is necessary for flashover to occur. The high
conductivity of the water film (caused by the rejection of impurities from the solid part
toward the liquid portion of drops or droplets during solidification, and b y pollution of the
water and ice surface from corona discharge by-products [45 19]) leads to voltage drops
essentially across the air gaps. The initiation of corona discharges leading to the
development of a partial discharge (violet arc) in these zones causes a substantial increase
in leakage current. Under sufficient electrical stress, an arc will propagate along the ice
surface, eventually forming a white arc. When the white arc reaches a certain length,
flashover occurs along the entire length of the insulator.
L2. Problem description
Up to now, research in this area has mainly focused on the experimental
determination of the critical flashover voltage [8, 14 - 18], establishment of standard test
methods [20] to evaluate the performance of insulator under icing conditions, and
development of mathematical models simulating this phenomenon [21- 2 4 ] . Understanding
the fundamental aspects of flashover on ice-covered insulators, that is, the mechanisms
involved in the propagation of electrical arc on an ice surface, are important for accurate
modeling and better design of insulators destined to cold climate regions.
Some work has been done on characterizing discharge over ice surfaces [19, 25],
but there is still no complete physical understanding of the mechanisms and nature of these
involved in the development of electric discharge along an ice-covered insulator surface
[19, 26, 27], understanding of the related physical processes is still deficient. This situation
is mostly related to the complexity arising from the presence of ice surface which interacts
with arc initiation and propagation, contrary to air gap discharges. In the case of
ice-covered insulators, the mechanisms are even more complex due to the presence of several
interfaces (resulting from water film formation) e.g. ice-water, water-air9 ice-insulator, and
other parameters such as water conductivity. When covered with a water film the ice
surface acts like an electrolyte. The resistance of the electrolyte around the arc root is
reduced due to the Wien effect, e.g. influence of electric field on ion mobility, and heating
[28]. The heating of the electrolyte is associated with the current flowing through it and the
arc voltage drop. The diffusion of heat through the electrolyte and the arc root propagation
velocity over its surface are further factors that render a rigorous analysis complicated.
Most of these studies were performed on small physical ice surface models under
conditions, which were sometimes different from those observed on ice-covered insulators
in the field [25, 26]. Furthermore, these studies focused on the formation and propagation
of the streamer only, in which there is no significant thermal ionization.
This study was motivated by the need to understand the physical processes involved
in the flashover of ice-covered insulator, and was carried out under a grant from
NSERC/Hydro-Quebec/UQAC Industrial Chair on Atmospheric Icing of Power Network
Equipment (CIGELE) and Canada Research Chair on Engineering of Power Network
1.3. Research objectives
The general objective of this research is to investigate the physical mechanisms
involved in the propagation of electric arcs on the surface of ice.
The specific objectives are:
a) Experimental observation of the characteristics of arcs propagating
. over an ice surface
Measuring different parameters of arcs over an ice surface, such as channel radius
and propagation velocities, and studying the propagation pattern and arc foot geometry are
the specific objectives of this part of the study. These investigations may provide
background information for understanding the entire flashover process phenomenon.
b) Describing the formation and propagation mechanisms of "violet arcs"
and "white arcs" on the surface of ice
The aim of this section is to describe the mechanisms and conditions governing the
formation of violet arcs, and the transition from violet arc to white arc. Another important
aspect would be identifying the dominant ionization process that could explain the velocity
of propagation and the temperature of arc at this stage.
c) The effect of polarity on the propagation of discharges
Significant differences in behavior between positive and negative arcs during
pattern and velocity should be studied with the aim of proposing mechanisms enabling
description of the differences between positive and negative polarities.
d) Investigating the effects of various macroscopic parameters (e*g. applied
water conductivity, water film thickness, and humidity) on the different stages of
flashover
Several factors may influence arc propagation. According to the previous researches
and initial observations, water film conductivity and thickness, and relative air humidity
were found to have the greatest influence, and hence were selected for study as
experimental parameters.
e) Describing the final jump (last stage in the flashover process) and
associated mechanisms
At a critical arc length the speed of arc propagation increases. This suggests a
change in the propagation mechanism at that stage. Measuring the speed of arc,
determining its critical length, and suggesting a theory that could describe the ionization
process and propagation speed are the specific objectives for this stage.
It should be stated that this research focuses on the propagation of dc arcs.
However, where possible, experiments using ac voltage were conducted to observe the
phenomenon. But, the effect of arc decays and re-ignitions as ac voltage goes through zero
voltages). Moreover, this study is limited to the propagation of a single arc in the presence
of only one air gap.
L4« Methodology
The present investigation was motivated by the need to understand the physical
processes involved in flashover of ice-covered insulators. One of the main causes for the
currently limited fundamental insight in the physics of this phenomenon is that only a few
diagnostics are applicable. This is due to the complex discharge geometry, fast-occurring
phenomena, and limitation of presence of high voltage. It became clear at the beginning
that, because of the complex nature of the problem, explaining the flashover process
physically is a demanding task. The best approach considered was building simplified
models so that the principal physical mechanisms could be determined and studied in a
controlled manner.
To be able to observe the phenomenon with optical recording devices, a flat ice
surface was selected. An air gap was created between the high voltage electrode and ice
surface. Optical parameters were observed using one or a combination of the following
equipment: ultra-high-speed video camera, image intensifier, and PMT. Voltage and
current measurements were also made and synchronized with optical recordings through a
data acquisition system (DAQ). Generally, the following analyses were carried out on
experimental results:
At different stages of propagation, discharge velocity was measured from the video
recording calibrated to give real dimensional values of distances.
B* Current profile analysis
Arc cuirent, either measured from a shunt resistance or cuirent monitoring probe,
were recorded through the DAQ. Analysis of this current consists in detecting current
jumps and variations in the slopes of current-time profiles.
C. Propagation pattern analysis
In this time-consuming part, the pattern of arc propagation was attentively tracked
from the video recording images. The presence of discharges, shape of arc foot and arc
channel radius were also observed.
D. Arc luminosity
The variations in discharge luminosity during propagation and at different locations
along the arc channel and foot were analyzed from the PMT output, or simply from the
comparison of brightness in the video images.
The above analyses were also accomplished by studying the effects of voltage
polarity, setup orientation, water film thickness and conductivity, and relative humidity.
The above-described experimental method was designed to obtain the required
information about the entire flashover phenomenon. This permits us to propose hypotheses
that could explain the observations and give fundamental insight into the mechanisms of
1.5. Statement of originality, and contribution to knowledge
To the best of our knowledge, no fundamental work has yet been done on the
process of arc propagation over a one-meter ice surface. Previous researches [19, 25, 26]
were conducted on small setups (a few centimeters) that are not representative of foil-scale
insulators and in which thermal ionization does not play a significant part. Those
investigations concentrated on the initiation and propagation of streamers. Moreover, the
flashover phenomenon has been observed with streak and framing cameras, which only
captures visible light. Employing a photomultiplier tube (PMT)5 which operates in the 185
nm to 900 nm range9 only produces an electrical output signal corresponding to the
intensity of light. It could not be used to observe the whole arc channel with spatial
resolution (as opposed to video cameras).
This study is the first to use an ultra-high-speed camera (above 20,000 fps and up to
675,000 ips) on a large-scale ice surface. Moreover, employing an image intensifier along
with an ultraviolet (UV) band-pass filter enabled us to observe UV activity during the
discharge propagation.
Besides the originality of employing high-technology equipment, this work is the
first research to emphasize close-up observations of arc root and channel, as well as the
propagation pattern of discharge. Based on the new findings, this fondamental work
proposes physical mechanisms contributing to arc propagation along an ice surface and
L6« Thesis outline
This dissertation is structured as follows:
Chapter one9 herein, provides general information about the problems resulting
from ice accretion on power network equipment. It defines general processes occurring
during the flashover of ice-covered insulators, and explains the necessity and motivation for
the present research. The general and specific objectives are clarified and the methodology
selected to achieve the objectives is explained.
In Chapter 2, a survey of related literature will be presented. Distinct results on the
mechanisms of discharge propagation over an electrolyte and ice surface will be reviewed.
Chapter 3 introduces the available equipments and describes the experimental
procedure for performing the experiments in details.
Chapters 4 and 5 present the experimental results. Chapter 4 describes the general
findings from analyzing the optical and electrical studies. Chapter 5 deals specifically with
the effects of water film thickness and conductivity, and relative humidity.
Chapter 6 discusses arc propagation mechanism based on the experimental results
presented in the two preceding chapters.
The general conclusions derived from the results and discussions covered in the
previous chapters will be presented in the seventh chapter of this thesis. It will also include
the areas of research that we recommend exploring for continuity and progress following
CHAPTER 2
CHAPTER 2
LITERATURE REVIEW
:-2.1. Introduction
At temperatures close to zero, when a thin water film forms on it, an ice surface acts
like an electrolyte [31, 32 and 33]. This fact is the motivation to firstly start with reviewing
the literature in the more studied subject of arc propagation along an electrolyte surface.
Most of these studies were aimed at understanding contamination flashover using simple
physical models. Through different approaches, several theories have been proposed to try
and explain the researcher's observations. The first part of this chapter reviews the most
important results obtained from these investigations. In the second section, research works
dealing with discharge propagation over an ice surface are presented. Due to the importance
of water molecules in discharge propagation, the last section of this chapter will focus on
2*2. Mechanisms of discharge propagation over an electrolyte
surface
The pioneering work of Hampton [34] can be considered as the first attempt to
describe flashover propagation, although his work was based on the quantitative theory
developed by Obenaus in 1958 [35], followed by Neumarker in 1959 [36]. Hampton [34]
showed that as surge current heats up the pollution layer, its resistance falls in the normal
manner of an electrolyte. Further heating boils off water in the layer, but the overall
resistance does not change markedly until a saturated electrolyte has been formed, since a
decrease in the thickness of electrolyte is offset by an increase in conductivity. When the
electrolyte is saturated, farther loss of water results in a rapid increase in resistance. He
noted that the growth of a discharge on a polluted surface usually took several voltage
cycles to build up into flashover, and that this growth was markedly affected by the current
going through zero at each half cycle. Hence, with the aim of reducing the number of
variables affecting discharge propagation, he used a direct-current supply for his work. He
also confined his investigation to the behavior of an arc discharge rooted on the surface of a
column of electrolyte having a constant resistance per unit length to overcome the
complexities induced by the varying resistance of a wet polluted layer. These requirements
were met by using as a resistance a jet of water flowing from a nozzle. A uniform flow of
water was ensured by a constant-head tank and the resistivity of the water was adjusted by
mixing in a small portion of saturated salt solution. The resistance of the water column was
maintained at the required value by injecting salt solution at a controlled rate into the water
falls below the gradient along the resistive column, flashover will occur. He. also
hypothesized that when an arc propagates along the surface of a water column, the arc
bums in an atmosphere of steam instead of air. This statement was based on the
measurement of the voltage gradient in the column of an arc burning in atmosphere of
steam as a function of current, compared to a similar arc burning in air.
Wilkins and Al-Baghdadi [37] suggested that the arc moves to a position where the
rate of energy expenditure is a maximum. Furthermore, a mechanism for arc propagation
entitled "discharge elongation by ionization and successive root formation" was proposed
[37]. The theory suggests that extension is produced by new ionization paths created at the
tip of the discharge (Figure 1). They also showed that the voltage gradient in a discharge
along a strip of electrolyte is close to the value for a static discharge in air at the same
current. They also verified their proposed mechanism of arc propagation by measuring the
transient voltage distribution along the electrolyte strip during flashover. They noticed that
even after the discharge tip is well beyond a particular probe, there exists a potential
difference between this probe and the first probe. This indicates that there is current
flowing in the pollution layer behind the discharge root, supporting the theory of elongation
by ionization and successive root formation. The current flows into the electrolyte ahead of
the discharge tip and also behind the tip, the latter current dying away after the tip has
passed a particular point. This was in contrast to what should be expected from the previous
Discharge Newionization
(a)
(b)
(c)
(d)
Figure.2.1. Proposed mechanism of elongation [37]: (a) lonization in front of discharge tip
(b) Possible current paths
(c) Current distribution after increasing the ionization (d) Elongation the discharge to die new location
Using high-speed photography, Claverie [43] stated that the progression of arc on
polluted insulators is surely due to thermal phenomena. In the meantime. Jolly [38]
published a paper in which the different possible forces, including electrostatic attraction,
electromagnetic force, thermal buoyancy force and steam pressure, which may be the cause
contamination flashover is essentially an electrical breakdown process caused by the field
concentration at the discharge tip. The current flow lines in the contaminant layer converge
at the discharge root, producing a high local electric field. If this local field is high enough,
the air in front of the discharge tip will be ionized, extending the discharge. Ionization by
electron impact may be aided by thermal and photoelectric ionization processes. His main
reason for this conclusion was the velocities of 3000-5000 m/s, which could be the result of
the drifts of the electrons in an electric field [38]; but he also mentioned that when
flashover occurs slowly, over several half cycles, thermal and electrostatic forces might
also be involved.
Rahal and Huraux [3.9] stated two requirements for propagation of a discharge at the
surface of an electrolyte. First, the electrical condition (applied voltage and discharge
current) should be satisfied to sustain the discharge, and second, a physical mechanism that
pulls the discharge and leads to flashover. They showed experimentally that, the physical
mechanism is electrostatic force acting on the discharge column.
Sudarshan and Dougal [40] suggested that the major difference between breakdown
near or at an insulator surface with breakdown in air must eventually be traced to a
modification in the rate coefficient, which describes the ionization growth. They also stated
that charge accumulation on an insulator surface modifies the electric field distribution in
the gap, which in turn influences the initiation and propagation of a discharge.
Li [41] showed that the electric field stress at the arc root is too low to cause air
in the arc column and completed by the migration of positive and negative ions under the
effects of the electric field.
Allen [42] demonstrated that the ionization close to the insulator is enhanced by
electron emission from the surface by photons from the avalanches in the gas. The
relatively high propagation velocity of streamers along an insulating surface rather than in
air supports his arguments. However, he stated that the dependence of the streamer
propagation velocity on the material suggests that this mechanism is a function of the
insulating material nature [42].
Matsuo et al [44] used an electrolyte solution to simulate the surface of wet polluted
insulators under impulse voltage. They found that the propagation velocity of discharge
increases with the of photoemission intensity from the tip of the local discharge. They
mentioned that the influence of air pressure and the applied voltage waveform on the
velocity is very small.
Boudjella et al [46] preformed experiments using a cell of two polluted water
channels. They observed that putting a metallic sphere in one channel influences the
discharge propagation direction. They deduced that in addition to the gradient of potential
and current in pollution, the electric field strength around the discharge tip has an effect on
the discharge development direction.
Bruggeman et al [45] studied experimentally electrical breakdown between.a metal
pin and a water-surface electrode. They observed a glow-to-spark transition when the pin is
Another interpretation for the propagation mechanism on an electrolyte surface was
proposed by Mercure et al [47]. They showed that current gradient (dJ/dt) in the arc is
much larger on the forward side of the arc root, in the direction of propagation of the arc,
than in the opposite direction. A large temperature gradient is associated with this large
gradient of current; therefore, as the heat flux depends on the temperature gradient, forward
heat conduction could be expected. It will results in an expansion in the forward direction
of the boundary of the electrically conducting plasma.
The electric field required for sustained positive corona streamer propagation shows
a strong linear dependence on the water vapor partial pressure [48]. Yamashita et al [49]
performed experiments using several photomultipliers to observe the propagation of local
discharge on an electrolyte surface. They showed that the velocity of the local discharge is
determined by the intensity of the photo-emission, and is independent of the length of the
water channel and applied voltage when the resistance per unit length of water channel is
the same.
Matsumoto et al [50] conducted streak photography and spectroscopic measurement
for a partial arc on a contaminated surface containing NaCl. They measured the arc
diameter as a function of current. It was also revealed that the light emitted from the arc
contains strong Na emissions.
Employing Schlieren photography, Boylett and Maclean [51] revealed a complex
discharge structure and the presence of a strong liquid wave disturbance accompanying
discharge propagation across the surface of an electrolyte. They also showed that the speed
this speed is influenced by resistive gradients in the electrolyte. They found that the shape
and speed of discharge are strongly polarity dependent. For a given starting condition, the
discharge is observed to propagate ten times faster under positive voltage.
In another work [52], Jolly and Poole studied experimentally contamination
flashover under dc applied voltage. They found that polarity influenced the flashover
voltage, with flashover occurring more readily for negative polarity. They stated that this
difference is attributed to cathode spot phenomena and electrochemical effects.
Rumeli [53] noticed differences in dc flashover of a water jet regarding polarity. He
mentioned that this difference could be explained by the dependency of the
discharge-voltage-gradient-current characteristic upon polarity.
Flazi et al [54] commented on Hampton's criterion and Wilkins9 criterion using
multidirectional and circular-sector setups. They proposed that flashover is possible if the
electric field distribution along the leakage distance is sufficient for discharge evolution by
progressive breakdown between the discharge and the electrolyte.
The effect of thermal forces on the propagation of the arc was proposed by [55].
They noted a difference in the propagation pattern in three cases of horizontal, vertical and
VEE string orientation.
Johnson et al [56] reported similar effects. Using a high-speed camera with 1000 fps
recording speed, they observed that the surge-to-flashover transition mechanism of the
horizontal strings was quite different from that of the vertical strings. As the skirt side arcs
reached the upper edge of the insulator, they did not immediately flash over to the caps, but
surface of the insulator at various points. In some cases these long arcs would withdraw to
their initial position for a few cycles and then develop into another arc terminating on the
top surface. With sufficient voltage the arcs eventually terminated on the caps, completing
the flashover circuit.
Deviations from Ohm's law in electrolytic conductors were discovered by Wien
[57]; for liquid electrolytes. He showed that the conductance increases with the intensity of
the field. This increase has been shown in general to arise from two different effects: e.g., a
destruction of the "ionic atmosphere" and a modification of the dissociation kinetics [58].
In weak electrolytes the latter effect is rather more important; a theory which has been
developed by Onsager. [59]
The effect of an external electric field on the electrolytic dissociation was computed
kinetically from the equations for Brownian motion in the combined Coulomb and external
fields [59]. The result was an increase of the dissociation constant, which is proportional to
the absolute value of the field intensity, and inversely proportional to the dielectric
constant.
Cserfalvi and Mezei [60] tried to measure the cathode drop potential originating
from metal salts in the electrolyte cathode as a function of different discharge parameters.
The observed dependence of the cathode drop on pH was explained only as being due to
the self-sustaining discharge processes taking place at the plasma-solution interface. In a
steady state of glow discharge, the bombardment of positive ions accelerated by the electric
field of the cathode dark space produces cathode sputtering and secondary electron
field, are able to excite and ionize the neutral atoms. During these ionization collisions5
positive ions and new electrons are generated and, finally, multiplication of charge carriers
occurs in the cathode dark space. Supposing that for each of the (K-l) electrons formed in
the plasma9 y electrons are released at the cathode by various mechanisms, for the discharge
to be self-sustaining the usual condition must be satisfied (if K » • 1 ):
Ky.= l
where K is the multiplication factor in the gas phase, and y is the secondary electron
emission coefficient of the cathode. Since in electrolyte-cathode discharge the acidification
of the solution changes the cathode material, the observed dependence of the cathode drop
on the pH can be attributed to a change in the value of y. If acidification causes an increase
of y, this can lead to a decrease of the cathode fall through a higher output of charge
multiplication. The cathode fall and y are interdependent. [60]
Emissions from an atmospheric pressure glow discharge, with alkali metal chloride
solution as the cathode, were studied by Maksimov et al [61]. The relation between the
discharge emission and the cathode sputtering process leading to the transfer of solution
components to the plasma zone was also analyzed. They concluded that plasma radiation
from an electrolyte cathode glow discharge is closely related to cathode sputtering, the
process of transferring solution components to the plasma. This process not only supplies
the gas phase with water and solutes, it also initiates redox processes affecting the
properties of plasma and its emission spectrum.
As suggested by Park et al [62], it is metal cations that are transferred to the gas
with electrons followed by the electron impact excitation of the atoms produced. In view of
the fact that the potential drop at an electrolyte cathode can be as great as a few hundred
volts [63], the transfer of positive ions from the solution to the plasma zone seems to be
improbable. At the same time, it is evident that the appearance of atoms in the plasma zone
is due to cathode sputtering. By analogy with classical cathode sputtering, it should be
expected that the components of solution, primarily neutral species, will appear in the gas
phase.
The spectral lines arise mainly from the elements dissolved originally (Ca, Na, and
K) and spiked (Cu, Pb) in tap water and can be attributed to the effect of cathode sputtering
during discharge. The emission mechanism has been extensively investigated [60, 64].
When the discharge is operating, the positive metal ions are released from the electrolyte
cathode surface due to cathode sputtering. These positive metal ions cannot pass through
the negative space charge near the cathode dark space, but escape from the cathode surface
and diffuse into the negative glow only if they are recombining (becoming neutral) in the
cathode dark space. The recombination of the positive metal ions takes place via a
three-body collision involving one positive metal ion and two electrons. The neutral metal atoms
produced in this way diffuse into the negative glow, where they are excited by electron
2.3. Discharge propagation on am ice surface
Khalifa and Morris [15] explained the flashover of ice-covered insulators based on
the cumulative heating effects of leakage currents. Due to the non-uniform conductance of
the leakage paths in the ice, the temperature rises in some localized zones where the current
density is highest. The rise in temperature at such zones increases the ice conductivity and
thus further increases the current density and the rate of heat development.
To the best of our knowledge, the study of basic phenomena occurring during the
flashover of ice-covered insulators was pioneered by Farzaneh et al [17, 18] while studying
the different parameters affecting the performance of insulators under icing conditions.
These authors distinguished the different stages, such as the appearance of water film on
the ice surface, the initiation of corona discharges, development of local arcs, increase of
leakage current, and finally flashover. These processes appear in a single arc at a speed
sufficiently slow to allow detailed observation, unlike contamination flashover, which tends
to have multiple dry band and arc development paths. Most of the other studies were
carried out to determine the withstand voltages, critical conditions for arc propagation, and
modeling of arc on ice surfaces. They investigated several factors and parameters related to
the icing processes and environmental conditions influencing the flashover voltage of
ice-covered insulators. They showed that wet-grown ice deposits are more dangerous than ice
grown in a dry regime. They found that the maximum withstand voltage of one to four
ice-covered insulators varied linearly as a function of dry-arcing distance. They also reported
distance increased, and the maximum withstand voltage gradient increased as well. For a
post-insulator, they showed that maximum withstand voltage gradient decreases with an
increase of ice thickness up to three cm and then remains constant.
Farzaneh and Drapeau [17] revealed that the gradient of maximum withstand
voltage of the tested post-insulator decreases with an increase in spray water conductivity,
a, up to value of 80 jiS/cm. At relatively high values of water conductivity, because of high
corona discharge activity during the icing period, there was almost no ice deposited on the
top shed of the insulator (HV side).
Farzaneh et al [19] carried out several experiments using high-speed streak
photography to observe streamer propagation on an ice surface. They measured the
streamer inception voltage and propagation velocity considering parameters such as
freezing water conductivity and HV electrode radius. They concluded that in the presence
of an ice surface, discharge is initiated in fields with lower intensity than in air alone, and
also that streamers propagate with higher velocities than in air [19]. They suggested
enhanced electric fields caused by the permittivity of the surface, accumulated charges on
the ice surface, and release of electrons from the surface due to photo-ionization as the
possible mechanisms affecting streamer propagation on ice surface, compared to air. These
investigations were performed using ordinary ice and small inter-electrode distances, which
are not representative of actual outdoor insulators covered with atmospheric ice. Also, these
studies focused on streamer formation and propagation only, in which thermal ionization is
Contrary to mechanical effects, the physics, thermodynamics and electrochemistry
aspects of the flashover process on ice-covered insulators is a complex topic, and some
aspects of the phenomenon are not yet fully understood. Some tentative explanations have
been reported in the scientific literature in this field [3, 18]. Basic studies are essential to
the elucidation of the mechanisms involved in the initiation of discharges, and their
transition to arc propagation.
However, researchers do agree that ice surface flashover is caused mainly by the
combination of several phenomena, including [33 18 and 19]:
•••-• Decrease in "effective" leakage distance caused by ice bridging;
Presence of a pollution layer on the surface of the ice layer;
Increase in surface conductivity caused by the presence of a water film
resulting from various factors, such as wet ice accretion process,
condensation, heating effect of leakage current, partial arcs, rise in air
temperature and/or sunshine;
Formation of air gaps caused by the heating effect of partial arcs, a rise in air
temperature and/or ice shedding.
Ice accretion along energized insulators may not be uniform. The parts of the
insulator that are free of ice are referred to as air gaps. It is generally agreed that the
presence of a water film on the ice surface is necessary for flashover to occur. The high
conductivity of the water film (caused by the rejection of impurities from the solid part
toward the liquid portion of drops or droplets during solidification, and by pollution of the
drops essentially across the air gaps. The initiation of corona discharges leading to the
development of a partial discharge (violet arc) in these zones causes a substantial increase
in leakage current. Under sufficient electrical stress, an arc will propagate along the ice
surface, eventually forming a white arc. When the white arc reaches a critical length, the
whole insulator suddenly undergoes complete flashover.
As the discharge in the air gap is a rather well-understood phenomenon, some
authors have tried to compare insulating material surface discharge characteristics to those
in air. The presence of an insulating surface has two main effects on corona and
breakdown: a) it causes a distortion of the electric field, which lowers the discharge
inception voltage and causes the discharge trajectory to become attached to the insulator;
(b) it modifies the effective ionization and attachment rates which affect the propagation
characteristics of the discharge (propagation speed, charge, current, etc.)[19].
In the case of ice, there are major differences compared to the other surfaces: (a) the
bi-state conductivity of ice surface, and (b) the presence of a liquid or liquid-like film at the
air/ice interface at subfreezing temperatures [19].
Concerning the performance of ice-covered insulators under dc voltage, several
investigations have been conducted on:
® The effects of atmospheric pressure and applied water conductivity on the dc
flashover voltage [65, 66];
® The influence of ambient temperature and applied voltage type [67]; ® The influence of insulator length on flashover voltage[68]; and
Some experimental studies were also performed to measure voltage drops and arc
characteristics (voltage gradient versus current? namely E-I curve) on ice surfaces [70].
These studies provided substantial information used in the development of mathematical
models [24, 71 and 72].
However, few publications are available on the fundamental physical phenomena
occurring inside a discharge channel propagating over an ice surface [19, 26, 27 and 73].
Most of these studies were performed on small physical ice surface models under
experimental conditions which were sometimes different from those observed on
ice-covered insulators.
2.4. Effect of voltage polarity
Regarding the effect of voltage polarity on discharge propagation, experimental research
resulted in finding the differences in arc constants and voltage-current characteristics for
positive and negative cases [71]:
E=84.6r0 7 7 2 for negative arcs
E=208.9r0-449 for positive arcs
The other difference was found to be the electrode voltage drop value for positive and
negative polarities. For negative and positive arcs, the measured values of electrode voltage
2,5» The effect of humidity
It has been well established that the flashover voltages of air gaps subjected to
positive lightning impulse increase linearly with humidity at a rate of. 1 % / (g/m3) over a
wide range of humidity [74]. Kuffel [75] first noted that the enhanced electrical behavior of
air by water vapor is comparable to electro-negative gases, and is qualitatively due to the
loss of free electrons by attachment and absorption of photons by water vapor.
Air humidity could affect the flashover process in two ways [76]: first, it may
influence the fundamental physical process, which can be referred to as the direct effect of
humidity. Second, it may influence the field distribution, thus influencing the outcome of
flashover. This can be referred to as the indirect effect. The flashover voltage of air gaps
increases linearly with increasing humidity due to the direct effect of humidity. When a
dielectric surface is involved, an additional change in flashover voltage caused by the
indirect humidity effect would be superimposed on the linear component [76].
The electric field necessary for stable streamer propagation increases linearly with
humidity, from about 4 kV/cm in dry air to about 5.5 kV/cm at 20 g/m3 [77]. The size of
corona streamers is also reduced as humidity increases [77].
The leader gradient is inversely proportional to the square root of the charge per
unit length, which decreases with increasing humidity [77]. In fact, both streamer and
leader gradient increase with humidity; leading to an increase in the breakdown voltage.
The influence of humidity on the breakdown parameters is a consequence of a modification
It is also believed that humidity affects the flashover voltage in the presence of a
tangential dielectric by creating a thin layer of water on the surface, which is more easily
ionized. The higher the humidity, the thicker the layer on the surface and the easier it is for
field-emitted electrons to produce secondary electrons [79].
2.6. Conclusions
During the arc propagation over an electrolyte surface, the following mechanisms
were found to have a greater influence in the related literature: electrical field
concentration, thermal buoyancy, heat conduction, photo ionization, charge accumulation
on the surface and secondary electron emission.
Previous research on initiation and propagation of discharge over an ice surface
provided valuable information on the mechanisms of streamer propagation in the presence
of an ice surface. The necessary electric field for streamer initiation and the velocity of
propagation were calculated and hypotheses were proposed to explain the observations.
However, these studies were performed on small physical ice surface models and were
limited to streamer formation and propagation, in which thermal ionization is not
CHAPTER 3
CHAPTER 3
FACILITIES AND PROCEDURES
3.1. Introduction
The proposed research was carried out using the following methods that were
chosen based on previous models (different geometries of ice samples: triangular [83- 85],
cylindrical [24, 82], and rod-rod or rod-plane system in a small Plexiglas mould [19, 67, 86
and 87]), which have been demonstrated to be effective and successful in CIGELE's
research laboratory.
In order to achieve the objectives, simultaneous optical, electrical and
environmental condition measurements were performed. However, the data from electrical
and optical measurement categories were synchronized through a data acquisition (DAQ)
system.
Discharge current and applied voltage are the important parameters in the electrical
measurement categories. Leakage current measurements, which can provide more insight
on the initiation and propagation of discharge, were done using Pearson coil and/or shunt
resistance via the DAQ system. The monitored environmental conditions were ambient
Optical measurements were performed using different instruments, which will be
introduced in Section 3.2. These measurements aimed to observe and determine ionization
activity in visible and ultraviolet regions, the shape of arc root, propagation velocity,
discharge channel diameter, and propagation pattern. With its high rate of frames per
second, the high-speed camera enables us to observe different stages of arc propagation on
the ice surface. These data were used to develop and validate the proposed theories.
Because discharge paths are usually randomly distributed along the ice surface and
are unlikely to develop within camera range, care has to be taken. To meet the proposed
objectives, a simple time-saving test setup was chosen, in which the arc starts at one end
and the path of arc propagation can be easily recorded with camera. Discharge luminosity
could be investigated by PMT. Simultaneously, the leakage current and applied voltage
were monitored.
3*2* Test facilities
Experimentally, such fast physical processes require specialized and sophisticated
instrumentation. The equipment and instruments used for the experiments of this research
are listed hereafter.
3.2.1. High-voltage equipment
High voltage was supplied by a 240 kVA single-phase test voltage transformer, with
a 120 kV short-circuit impedance of 5%. The output voltage is adjusted from 0 to 120 kV
voltage drop of the source below 5% when the load current is 0.5 A. Voltage is increased
either manually or automatically at a fairly constant rate of about 3.9 kV/s.
Whenever needed DC voltage is supplied using the above transformer connected to
a rectifier module, comprising a half-wave rectifier and a smoothing capacitor (15.2 p,F).
Positive and negative DC voltages are obtained by inverting the diode direction in the
rectifier. Using the automatic control, DC voltage increases at a constant rate of about 5.5
kV/s. A high voltage SF6 bushing conducts the applied voltage through the walls of the
climate chamber.
3,2,2. Current and voltage measurement devices
In AC experiments, the applied voltage was measured using a capacitive voltage
divider. Current measurements were carried out using a current transformer (Pearson™
current monitor: Model 110) with sensitivity of 0.1 V/A and usable rise time of 20 ns.
In DC experiments, voltage measurements were performed using a resistive voltage
divider. The leakage current was measured using a 10 Q shunt resistance between the
ground electrode of the test setup and ground terminal of the HV system.
3.23. Climate chamber
The climate chamber is a uniquely designed 6 m (W) x 6 m (L) x 4 m (H) room
equipped with an HV SFÔ composite bushing. The temperature inside the room can be
3.2 A High-speed camera
The FASTCAM SA1 (Photron Co.) high speed camera has a recording speed of
5400 full frames per second (fps) with a 1024 x 1024 pixel resolution, and maximum
recording rate of 675,000 fps at reduced resolution. It is controlled either by a PC through
the Gigabit Ethernet port, or by an RS-422 remote control keypad with built-in 5" LCD
monitor for complete camera set-up and operation.
The Photron FASTCAM Viewer (PFV) is a Windows-based application program
that makes it possible to control Photron's FASTCAM series high-speed video cameras
from a PC, including operations such as camera setup, framing and downloading. It also
enables the user to select the playback rate, step through video one frame at a time, and
selectively save video sequences in a variety of compressed and uncompressed formats.
3.2,5. Image intensifier
The UV camera intensifier amplifies the light in an extended spectral range (from
UV to NIR) for display on the phosphor screen. The available UV Camera Intensifier
(Invisible® Vision UVi, model: 185Q-10-S2Q-P46) has a wavelength response range
between 200-800 nm with a decay of lus and can be gated as low as 10 ns. It is equipped
with a 105mm/F4.5 UV lens. This intensifier is optimized for use with high-speed video
cameras.
The UVi can be programmed through its integral menu driven LCD display/control
panel or via its USB interface and software synchronized with an external TTL or video
steps) at input trigger rates greater than 100,000 per second and up to 20,000,000 per
second In burst mode.
When needed, a UV band pass filter can be used in front of the intensifier to block
all the light except ultraviolet region. The available filter is a U-340 2" square band pass
filter from Edmund Optics with a center wavelength of 340 nm and Full Width-Half Max
FWHM(nm)of85nm.
3.2.6. FMT
The CIGELE laboratory has a photomultiplier tube (R928P from Hamamatsu
Photonics) with a wavelength range of 185-900 nm and peak sensitivity of 400 nm. It is
used to detect ionization activity within the above wavelength range. Furthermore, while
operating in photon-counting mode, the electrical output signal may be used to assess the
intensity of photoemission from the discharge channel.
3.2.7. Corona detection camera
Corocam 504 is a video camera with a combined output for ultraviolet and visible
light. The spectrum range of the UV channel is between 240 and 280 nm, with a 30 Hz
standard video frame rate.
3.2.8; Data acquisition system
To establish synchronization between electrical and optical measurements and also
enable data storage with a high sampling rate, the following data acquisition (DAQ) system
providing protection and insulation. A DAQ card from National Instruments (PCI-6035E,
200 kS/s9 16-Bit9 16-Analog-Input Multifunction DAQ) and Lab VIEW software as a.
user-interface are used to acquire and store the signals from different devices.
• 3.3. Procedure
Because discharge inception at the HV electrode is usually randomly distributed and
unlikely to develop at a specific predetermined point, measures had to be taken to ensure
discharge inception recording. The rod-plane arrangement constitutes one of the basic
configurations for investigating discharge inception in high-voltage studies [80, 81]. The
rod simulates the tip of an icicle or a high-voltage conductor, from which the discharge
initiates. A distance between the rod electrode and the ice surface simulates the "air gap59
formed during ice accumulation on energized insulators. Real line or post-insulators
covered with ice or a cylindrical test setup, which could be used to simulate the real case
[82], are not suitable choices for this study due to the random propagation pattern of
discharges, which may not be in the viewing field of observation devices. A simplified
physical geometry was chosen to perform the experiments. A flat plane ice surface ensures
the propagation of discharge in two dimensions, in front of an optical observation device
(e.g. PMT, cameras...).
HV electrode Air gap Ice Surface High speed Camera
• ÙAQ
* system
HV Transformer
Figure 3.1. A schematic diagram of physical setup and equipment.
3.3.1. Physical test setup preparation
A simplified physical geometry was chosen for the experiments. Two types of
moulds were used depending on whether it is necessary to remove the ice or not. The first
one was a rectangular mould made from Plexiglas and the second was a plastic-covered
cardboard box to avoid water infiltration and from which the ice could be removed.
The overall dimensions of the moulds were different, depending on the type of
experiment they were used for. However, wherever not specified, the mould dimensions
were 140 cm (L) x 15 cm (W) x 5 cm (D).
Ice making proceeded as follows: First, the mould was filled up in several stages
with distilled water and put into a cold chamber to freeze completely. Then a narrow band
about 5 cm wide and 3 cm deep was made along the ice. This strip was filled up in 3 stages
with salty water to achieve a predetermined level of conductivity. The strip simulates a long
icicle that bridges the insulator sheds. After each stage it is returned to the cold chamber to
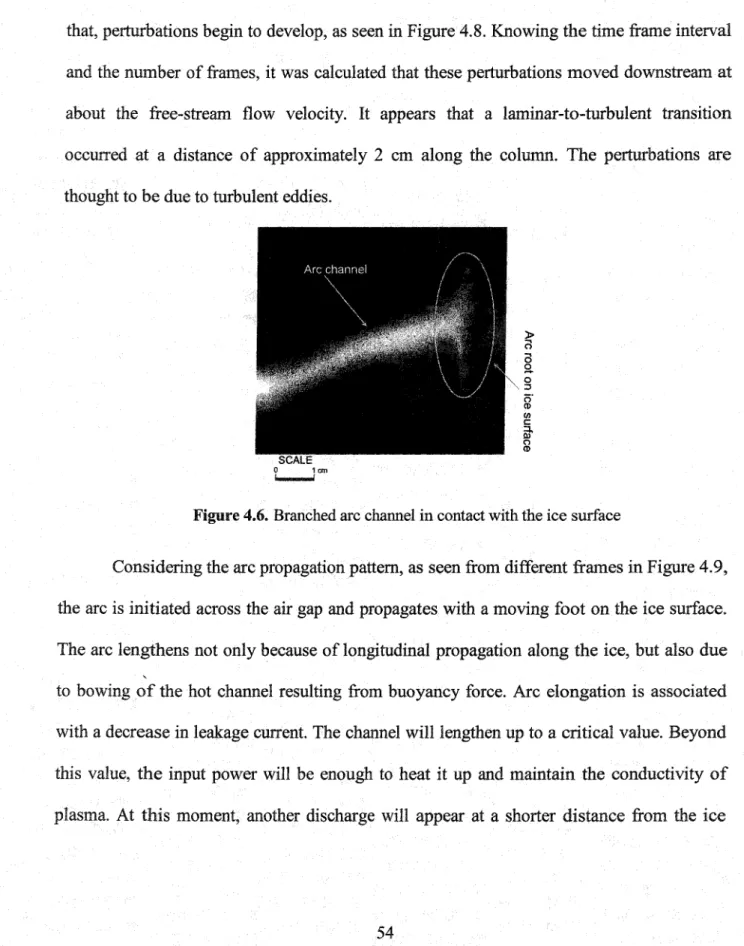
![Figure 2.1. Proposed mechanism of elongation [37]: . 1 Figure 3.1» A schematic diagram of physical setup and equipment](https://thumb-eu.123doks.com/thumbv2/123doknet/7723302.248610/12.918.98.833.82.1099/figure-proposed-mechanism-elongation-figure-schematic-physical-equipment.webp)