Innovation in Enterprise Clusters:Evidence from Dutch Manufacturing
21
0
0
Texte intégral
(2) CIRANO Le CIRANO est un organisme sans but lucratif constitué en vertu de la Loi des compagnies du Québec. Le financement de son infrastructure et de ses activités de recherche provient des cotisations de ses organisations-membres, d’une subvention d’infrastructure du Ministère du Développement économique et régional et de la Recherche, de même que des subventions et mandats obtenus par ses équipes de recherche. CIRANO is a private non-profit organization incorporated under the Québec Companies Act. Its infrastructure and research activities are funded through fees paid by member organizations, an infrastructure grant from the Ministère du Développement économique et régional et de la Recherche, and grants and research mandates obtained by its research teams. Les organisations-partenaires / The Partner Organizations PARTENAIRE MAJEUR . Ministère du Développement économique, de l’Innovation et de l’Exportation PARTENAIRES . Alcan inc. . Banque du Canada . Banque Laurentienne du Canada . Banque Nationale du Canada . Banque Royale du Canada . Bell Canada . BMO Groupe financier . Bombardier . Bourse de Montréal . Caisse de dépôt et placement du Québec . Fédération des caisses Desjardins du Québec . GazMétro . Hydro-Québec . Industrie Canada . Ministère des Finances du Québec . Pratt & Whitney Canada . Raymond Chabot Grant Thornton . Ville de Montréal . École Polytechnique de Montréal . HEC Montréal . Université Concordia . Université de Montréal . Université du Québec . Université du Québec à Montréal . Université Laval . Université McGill . Université de Sherbrooke ASSOCIÉ À : . Institut de Finance Mathématique de Montréal (IFM2) . Laboratoires universitaires Bell Canada . Réseau de calcul et de modélisation mathématique [RCM2] . Réseau de centres d’excellence MITACS (Les mathématiques des technologies de l’information et des systèmes complexes) Les cahiers de la série scientifique (CS) visent à rendre accessibles des résultats de recherche effectuée au CIRANO afin de susciter échanges et commentaires. Ces cahiers sont écrits dans le style des publications scientifiques. Les idées et les opinions émises sont sous l’unique responsabilité des auteurs et ne représentent pas nécessairement les positions du CIRANO ou de ses partenaires. This paper presents research carried out at CIRANO and aims at encouraging discussion and comment. The observations and viewpoints expressed are the sole responsibility of the authors. They do not necessarily represent positions of CIRANO or its partners.. ISSN 1198-8177.
(3) Innovation in Enterprise Clusters: Evidence from Dutch Manufacturing* Bert Diederen†, Pierre Mohnen‡, Franz Palm§, Wladimir Raymond**, Sybrand Schim van der Loeff ††. Résumé / Abstract Cette étude aborde et illustre un problème d’agrégation qui peut se poser dans les études d’innovation. Les données utilisées sont celles de la troisième enquête innovation aux PaysBas, qui sont jumelées aux statistiques de la production et aux données financières des sociétés. Nous comparons les résultats de l’estimation d’une équation d’innovation, obtenus tour à tour à partir de données au niveau des entreprises (bedrijfseenheid), des grappes d’entreprises domestiques (onderneming), et des grappes d’entreprises ayant des filiales à l’étranger ou contenant des filiales de firmes étrangères installées aux Pays-Bas. Mots clés : innovation, agrégation. This paper explores the aggregation problem and illustrates its relevance using data for the Netherlands from the third Community Innovation Survey (CIS3), and production and financial statistics. It compares the results of an innovation output equation that was estimated using data on enterprises (bedrijfseenheid), domestic enterprise clusters (onderneming), and those enterprise clusters with foreign inward or outward investments. Keywords: innovation, aggregation Codes JEL : D21, O33, O52. *. The authors thank METEOR for financial support and the Centre for Research of Economic Microdata (CEREM) of Statistics Netherlands for granting access to the Micronoom dataset. The views expressed in this chapter are those of the authors and are not necessarily those of Statistics Netherlands. This paper will appear as a chapter in Earl, Louise and Fred Gault, eds (forthcoming 2006), National Innovation, Indicators and Policy, Cheltenham: Edward Elgar. † Statistics Netherlands. ‡ University of Maastricht, MERIT and CIRANO. Maastricht University, MERIT/Infonomics, P.O Box 616, 6200 MD Maastricht, The Netherlands, tel +31-43-388 3869, fax +31-43-388 4905, E-mail: p.mohnen@merit.unimaas.nl § University of Maastricht. ** University of Maastricht. †† University of Maastricht..
(4) 1. INTRODUCTION The innovation survey data collected by Statistics Netherlands for the Community Innovation Survey (CIS) pertain to enterprises. However, enterprises are, in fact, often subsidiaries, daughter or sister enterprises, or part of a conglomerate. When the associated legal entities are majority-controlled by a group leader, it is likely that key decisions will be taken with a view to benefiting the whole group. A model of optimizing behaviour that is appropriate at the group level may be inadequate to describe the decisions taken at the component level. When it comes to key issues like research and development (R&D), even legally independent firms may form networks, R&D joint ventures or technological alliances, in which part of the R&D is conducted jointly for reasons of cost sharing, risk sharing and complementarities. There is therefore justification for asking how appropriate it is to relate the characteristics of enterprises to their R&D or innovation decisions, as is usually done using innovation survey data. Would it not make more sense to relate innovation outcomes to determinants measured at the group level? For example, suppose an enterprise is established in the Netherlands and has a subsidiary in China and another in the United States. The R&D is conducted mainly at the home base, but much of the product sales originating from this R&D investment is done in foreign markets through the Chinese and US subsidiaries. Dutch innovation data would record the R&D conducted at home and the product sales of the Dutch parent company, but would ignore the production and sales emanating from the foreign subsidiaries. Put simply, if R&D is conducted in one place and production in another, no link between R&D and innovation would appear in the data..
(5) 2. This chapter explores the aggregation problem and illustrates its relevance using data for the Netherlands from the third Community Innovation Survey (CIS3), and production and financial statistics. It compares the results of an innovation output equation that was estimated using data on enterprises (bedrijfseenheid), domestic enterprise clusters (onderneming), and those enterprise clusters with foreign inward or outward investments. 2. THE INTERNATIONALIZATION OF R&D AND INNOVATION: SOME EXAMPLES The literature on the location and the internationalization of R&D suggests that firms tend to keep their R&D at their home base (Granstrand, Håkanson and Sjölander 1993). If they locate their R&D abroad, they do so for a variety of reasons: cost, lack of scientists and engineers in the home country, a desire to develop products adapted to local preferences and regulations (customization), or a determination to create small-scale research installations that serve as listening posts (Erken and Gilsing 2005). According to Gassman and von Zedtwitz (1999), there is a trend towards more internationalization of R&D, more networking, and more coordination of R&D among the various participating units. According to figures for the Netherlands in the Activities of Foreign Affiliates database of the Organisation for Economic Co-operation and Development (OECD), the proportion of R&D that took place in foreign affiliates in 2001 amounted to 22%. Similar figures were reported for France and Germany. Cornet and Rensman (2001) report that Philips, Unilever and Shell, which are among the major Dutch R&D performers, spend more on R&D abroad than in the Netherlands..
(6) 3. A study by Bongers et al. (2003) was based on R&D and innovation surveys in the Netherlands for the period 1996-2000. It reveals that in that period: (a) foreign-controlled firms depended increasingly on R&D financing from related foreign firms; (b) foreign subsidiaries tended to outsource R&D to foreign (mostly related) firms; (c) foreigncontrolled firms were on average more R&D- and innovation-intensive; (d) Dutch multinationals increased their execution of R&D abroad (but less than employment); and (e) the proportion of R&D done in the Netherlands by foreign-controlled firms was even smaller than the proportion of personnel they employed in the Netherlands. Goedegebuure (2000) reports that, for 31 enterprises in the MicroScope database for which Dutch and worldwide data have been available since 1988, 66% of total revenue is produced abroad. Spithoven and Terlinck (2005) make the point that research stays at headquarters and development gets done in affiliates. The evidence above clearly indicates that, in studying the returns on R&D, more comprehensive information is needed than is usually available from the national bureaus of statistics. What is unclear, however, is to what extent possibly incomplete information affects the estimates of the returns on R&D. 3. VARIOUS STATISTICAL CONSOLIDATION MEASURES OF DUTCH ENTERPRISES Data for the Netherlands from the CIS3 for the period 1998-2000 were used for the analysis presented here. The data on innovation, R&D, production and investment are available at the level of the enterprise or bedrijfseenheid (BE), which may be one part of a legal entity or may be a group of various legal entities, as long as all participating units are engaged in.
(7) 4. the same economic activity. The BE is the lowest level of aggregation at which data on a given economic activity can be collected. BEs are statistical constructs that may not actually exist as separate legal or fiscal entities. In the innovation surveys, enterprises are asked whether they belong to a group — that is, whether they are affiliated with other firms — and, if so, whether or not the parent company of the group is located abroad. This information allows an investigation of differences in innovation behaviour among enterprises that belong to a group, but it does not reveal the composition of groups. For the analysis presented here, it was therefore preferable to rely on the Micronoom dataset. The latter, constructed by Statistics Netherlands by the merging of R&D, innovation, production, investment, financial and trade statistics, reveals the composition of enterprise clusters or onderneming (OND), formed by the grouping of BEs. The OND corresponds to the consolidated domestic accounts of a cluster of related enterprises (Diederen 2001). One way to ascertain whether the enterprise or the enterprise cluster is the more relevant unit of analysis would be to compare the results of an innovation production function at the level of the BE and the OND. However, it must be borne in mind that, for a number of reasons, the OND data do not necessarily (and mostly do not) correspond to the data from the legal entities, or companies, with which they are associated. For example, ONDs do not consolidate the activities of the foreign subsidiaries of a Dutch company. Moreover, an enterprise cluster so constructed may not represent an entire company, because some constituent enterprises are not included in the innovation surveys. It is only for R&D data that the enterprise cluster total more or less corresponds to the total at the company level. From the Statistiek Financiën van Grote Ondernemingen (SFGO), an.
(8) 5. annual financial survey of large non-financial companies based in the Netherlands with a minimum value of around €10 million, dummies for the existence of Dutch-controlled subsidiaries in foreign countries and for the existence of Dutch-based foreign-controlled multinationals can be constructed. In this way, Dutch enterprise clusters with foreign inward or outward (majority-holding) investments can be constituted. It is thus important to point out that the data to analyze operations at the level where decisions are taken — for instance, at the level of the multinational company — were unobtainable. Another level of decision-making that could be used is that of the network, which would comprise all firms with interconnected financial ties. Such networks would include even minority investments in domestic and/or foreign subsidiaries. Again, such a dataset was impossible to construct. 4. ECONOMETRIC MODEL In the Oslo Manual (OECD/Eurostat 1997, 73), which underlies the Community Innovation Surveys, one of the measures of innovation suggested is the share of total sales due to new or significantly improved products. In the CIS3, enterprises had to report whether they had introduced a product innovation to the market between 1998 and 2000 and, if so, the intensity of their innovation behaviour. Not all enterprises were product innovators; some were purely process innovators. They had to report whether they had introduced a new or significantly improved production/manufacturing process to the market in the three-year period. There was no question in the Dutch innovation survey that asked about the intensity of process innovation. Some enterprises may have had no innovation activity at all; others may still have been in the process of introducing an innovation or may have tried to do so.
(9) 6. without success. The latter two categories of enterprises were classified as non-innovators. Thus, selectivity was operating here: only product innovators reported shares of sales from innovation. The innovation output model adopted here, taken from Raymond et al. (2004), takes care of the selectivity and also to some extent of the process innovators. Formally, the model consists of two latent variables y*,1 and y*,2, defined by the following equations: y1* = β 1 x1 + ε 1. (1). y 2* = β 2 x 2 + ε 2 ,. (2). where the observed occurrence of innovation is defined as y1 = 0 if y1* ≤ 0 and y1 = 1 if y1* > 0. and where the observed share of sales from innovation is defined as. 0 c*1 y2 = y2 c 2 . if if if. y1* ≤ 0 y1* > 0 y1* > 0. and y ≤ c1 and c1 < y 2* ≤ c 2. if. y1* > 0. and. * 2. y 2* > c 2. (non - innovators) (process - only innovators) (product innovators) (large product innovators). In equations (1) and (2), x1 and x2 are vectors of explanatory variables, and ε 1 and. ε 2 are random-error terms following a bivariate normal distribution with correlation coefficient ρ. The model is a two-limit Tobit model with two decision equations (two latent variables, y*,1 and y*,2) and two thresholds (c1 and c2). The first latent variable determines.
(10) 7. whether or not an enterprise innovated. If, given the explanatory variables, the latent variable has a negative value, no innovation took place; if the value is positive, innovation did occur, and the type of innovation behaviour is denoted by the value of the second latent variable. If the latter is below threshold c1, the enterprise was a process-only innovator: no product innovation occurred; if it lies between the two thresholds c1 and c2, the enterprise was a product innovator; if it exceeds the second threshold, the enterprise was a large product innovator, probably a newcomer, whose total sales were due to new products. The second latent variable takes the observed value of the share of sales from innovation when it is between the two thresholds. The vector x2 explains the intensity of product innovation. As explanatory variables for the probability of innovating, the following were introduced: size (measured by the number of employees); relative size (measured by the ratio of the enterprise’s revenue to that of the domestic industry); and international competition (proxied by the indicator of whether the main market was the international market). The intensity of product innovation was explained by the following: the size of the enterprise; a demand-pull indicator (a dummy variable that takes the value 1 if “opening up new markets,” “extending the product range” or “replacing products phased out” received the highest score as an objective of innovation from respondents); a technology-push indicator (a dummy variable that takes the value 1 if “improve production flexibility,” “increase production capacity,” “reduce labour cost per produced unit” or “reduce materials or energy per produced unit” was given the highest score for the effects of innovation by respondents); a proximity to science indicator (a dummy variable that takes the value 1 if private or public research institutes, universities or institutes of higher education received.
(11) 8. the highest score as sources of information for innovation from respondents); a dummy for innovation co-operation; a dummy for government subsidies (from local, regional, central or European Union (EU) governments); R&D intensity (measured by the R&D/sales ratio) for R&D performers; a dummy variable that takes the value 1 if R&D expenses were zero (this was included to account for the discontinuity in R&D due to the assignment of a zero for R&D intensity when there was no R&D); and a dummy for continuous R&D performance.1 R&D here included both internal and external R&D. At the level of the enterprise cluster, the shares of sales from innovation and the R&D/sales ratios are weighted averages of the shares and ratios of the individual enterprises. The dummy variables take the value 1 when one of the member enterprises takes the value 1. The composition of the clusters was determined as of the end of the year 2000. Between the beginning and the end of that year, clusters may have changed in composition because of mergers, entries or exits. In both equations, two-digit industry dummies were controlled for. The model was estimated by maximum likelihood. 5. COMPARISON OF ESTIMATES FOR INDIVIDUAL ENTERPRISES AND ENTERPRISE CLUSTERS The leading R&D-performing companies, generally large in size, were expected to manage their innovation activities globally, locating their research facilities according to the supply of scientists and engineers, the cost of conducting research and the presence of technological clusters, and their production facilities according to market proximity, economies of scale and workforce concentration. A discrepancy between R&D and production locations could lead to biased estimates of the innovation production function.
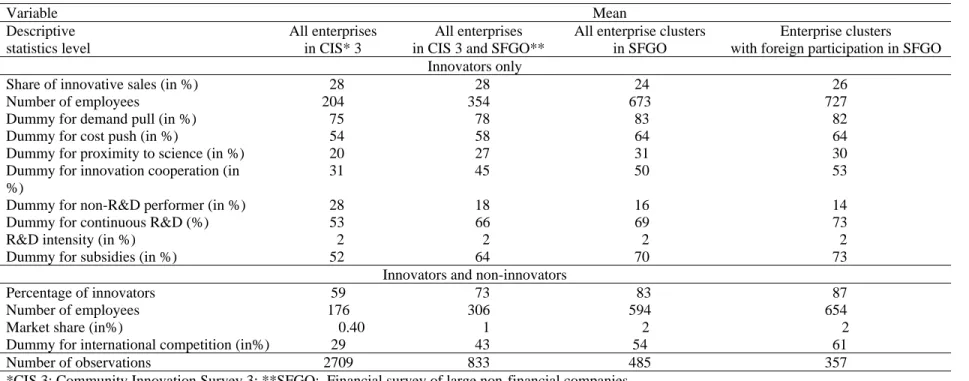
(12) 9. — that is, of the returns on R&D in terms of sales from innovation or the determinants of innovation. If conglomerates tended to keep their core knowledge in their home country, but located their production facilities abroad, the returns on R&D in terms of sales from innovation estimated from domestic enterprise data would be biased downward. Foreigncontrolled firms were expected to benefit from their owners’ stock of knowledge and to behave as agents of larger multinational corporations. If the R&D conducted in the host country played a secondary role in the overall research strategy of a multinational company and the subsidiary in the host country was above all a production facility, then using enterprise data for the subsidiary would most likely lead to an upwardly biased estimated return on R&D. The model outlined in the previous section was estimated at different levels of aggregation. Estimates obtained with enterprise data and with enterprise cluster data were compared. The innovation behaviour of all enterprise clusters and that of those with foreign links either because they were subsidiaries of foreign enterprises or because they had subsidiaries in foreign countries were also compared. The descriptive statistics in Table 1 show that, with few exceptions, all variables increased on average in the move from the sample of all enterprises contained in the CIS3 to the sub-sample of those also contained in the SFGO (columns 1 and 2), and in the move from all enterprise clusters in the SFGO to the sub-sample of multinational enterprise clusters in the SFGO (columns 3 and 4). Of course, enterprise clusters generally had larger mean value than enterprises (columns 2 and 3). However, R&D intensity hardly changed, and the share of sales from innovation was slightly lower for enterprise clusters..
(13) 10.
(14) 11. Table 4.1: Descriptive statistics: CIS 3, Dutch manufacturing Variable Descriptive statistics level. Mean All enterprise clusters in SFGO. Enterprise clusters with foreign participation in SFGO. 24 673 83 64 31 50. 26 727 82 64 30 53. 18 16 66 69 2 2 64 70 Innovators and non-innovators Percentage of innovators 59 73 83 Number of employees 176 306 594 Market share (in%) 0.40 1 2 Dummy for international competition (in%) 29 43 54 Number of observations 2709 833 485 *CIS 3: Community Innovation Survey 3; **SFGO: Financial survey of large non-financial companies. 14 73 2 73. Share of innovative sales (in %) Number of employees Dummy for demand pull (in %) Dummy for cost push (in %) Dummy for proximity to science (in %) Dummy for innovation cooperation (in %) Dummy for non-R&D performer (in %) Dummy for continuous R&D (%) R&D intensity (in %) Dummy for subsidies (in %). All enterprises in CIS* 3 28 204 75 54 20 31 28 53 2 52. All enterprises in CIS 3 and SFGO** Innovators only 28 354 78 58 27 45. 87 654 2 61 357.
(15) 12. Table 4.2: Two - Limit tobit model with sample selection: CIS3, Dutch manufacturing Coefficient (Std. Err) All enterprises in CIS 3. Variable Estimates level. Number of employees Demand pull Cost push Proximity to science Innovat ion cooperation Non -R&D performer Continuous R&D R&D intensity Subsidies Intercept Standard deviation of. -0.52** 1.20** -0.01 0.18 0.43**. ε2. Number of employees Market share International competition Intercept Standard deviation of. ε1. Correlation of the error terms Number of observations Log-likelihood Significance levels:. *: 5%. -0.33** 1.23** -0.23 0.07 0.53**. -1.62** 0.06 0.24** 0.16 2.16** 3.21**. (0.33) (0.16) (0.05) (0.13) (0.47) (0.09). -1.60** 0.15 0.21** 0.24 0.69 2.65**. 0.15** 0.06* 0.26** -0.19. (0.03) (0.03) (0.05) (0.30). 0.47** -0.13* 0.25** -3.01* *. -0.92**. (0.01). -0.87**. 2709 -5057.60 †: 10%. (0.07) (0.14) (0.12) (0.15) (0.13). Coefficient (Std. Err) All enterprises in CIS 3 and SFGO. **: 1%. Coeffici ent (Std. Err) All enterprise clusters in SFGO. Intensity of innovation (0.11) -0.76** (0.22) 0.50 (0.19) 0.01 (0.21) 0.08 (0.19) 0.28 (0.55) -2.71** (0.26) 0.10 (0.08) 0.47** (0.21) 0.40 (0.87) 3.71** 2.97** (0.12) Probability to innovat e (0.08) 0.39** (0.07) 0.03 (0.09) 0.20† (0.78) -1.29 1 (Assumed) (0.04) -0.97**. 833 -1684.58. 485 -1017.66. (0.13) (0.32) (0.25) (0.27) (0.25). Coefficient (Std. Err) Enterprise clusters with foreign participation in SFGO -0.26 0.71† 0.06 -0.09 0.04. (0.16) (0.41) (0.32) (0.33) (0.32). (0.74) (0.36) (0.10) (0.28) (1.11) (0.13). -3.92** 0.02 0.68** 1.11** 1.17 2.48**. (0.98) (0.50) (0.12) (0.36) (1.49) (0.12). (0.11) (0.09) (0.12) (0.99). 0.76** -0.10 0.52* -4.17*. (0.19) (0.16) (0.22) (1.77). (0.01). 0.31. (0.25) 357 -759.63.
(16) 13. The estimates are reported in Table 2. First, the model was estimated using the sample of all enterprises in the CIS3 after those with fewer than 10 employees, zero revenue and a greater than 50% R&D/sales ratio had been eliminated. The latter, somewhat arbitrary criterion was intended to exclude enterprises whose main activity was doing R&D.2 The probability of innovating increased with size (absolute and relative) and international competition.3 Doubling the absolute size increased the probability of being an innovator by 5%, while doubling the relative size increased the probability by 2%. However, sales from innovation did not keep pace with increases in size. The share of sales from innovation increased under the influence of demand-pull and tended to be higher in firms that cooperated in their innovation efforts. Technology-push, government subsidies, continuous R&D and proximity to science did not significantly affect the intensity of product innovation. However, R&D was seen as a significant input to product innovation. The computed elasticity for the share of sales from innovation with respect to R&D intensity was equal to 0.17 with a 0.04 standard deviation.4If R&D intensity increased by 10%, the share of sales from innovation increased by 1.7%. When the estimation was restricted to the sub-sample of enterprises that were both in the CIS3 and part of a company included in the SFGO, the number of observations dropped from 2,709 to 833. It should be noted that, by and large, similar results were obtained in terms of the direction and size of the coefficients, except for the size effect. For the probability of innovating, the marginal effect of absolute size was more pronounced and relative size yielded a negative effect. For the intensity of innovation, the marginal effect of size was somewhat lower than in the larger sample. This may be explained by the fact that.
(17) 14. inclusion in the smaller sample was dependent on the inclusion of the parent company in the SFGO survey. These estimates served as a benchmark for the estimates of the determinants of innovation at a higher level of aggregation. The same relationship was now estimated at the level of the enterprise cluster, with a certain number of enterprises being regrouped. When only enterprise clusters in the SFGO that were made up of enterprises that were in the CIS3 were considered, the resulting number was close to that of the same universe of enterprises as in the previous example. At the enterprise cluster level there were now 485 observations.5 Those clusters were incomplete, since they excluded both enterprises not sampled in the CIS3 and foreign affiliates. In general, the parameters of the model kept the same sign but were less precisely estimated. It is interesting to note that the coefficient of the logarithm of R&D intensity remained highly significant and increased in magnitude from 0.21 to 0.47. All other things being equal, the average share of sales from innovation was higher for R&D-performing firms, and the marginal return on R&D from the share of sales from innovation more than doubled. This could be explained by the existence of intra-group R&D externalities. Blanchard, Huiban and Sevestre (2004) have obtained evidence to this effect from French enterprise data. If members of a group were aware of these externalities and internalized them, as it were, the level of R&D should optimally have been chosen at the group level. Limiting the analysis to multinational enterprise clusters, either domestic with majority holdings in enterprises abroad or foreign with majority holdings in enterprises located in the Netherlands, reduced the observations to 357.6 The probability of innovating was determined more by size and international competition at the level of the enterprise.
(18) 15. cluster than at that of the individual enterprise. Selectivity was less of a problem, as revealed by the insignificance and low magnitude of the correlation coefficient between the error terms in the selection equation (equation (1)) and the innovation intensity equation (equation (2)). International competition had a stronger impact on the probability of innovating for multinational enterprise clusters than for domestic ones. Facing international competition increased the probability of being an innovator by 8% for multinational enterprise clusters compared with 5% for all enterprise clusters combined. The difference in average intensity of innovation between R&D-performing and non-R&D-performing firms was greater for enterprise clusters with foreign involvement than for domestic enterprise clusters, and the marginal return on R&D from the share of sales from innovation was 50% higher for enterprise clusters with foreign involvement compared with all enterprise clusters. It is thus likely that additional intra-group cross-border R&D externalities existed at the level of multinational enterprise clusters. 6. CONCLUSION The results from an innovation production function equation, with selectivity, were contrasted using data from enterprises and enterprise clusters, with and without foreign direct investment. The level of aggregation at which decisions are most likely to be taken was not tested, although this is an interesting question that needs to be addressed. Rather, the innovation production function was compared at two levels of aggregation, the individual enterprise and the enterprise cluster. The difference is probably most relevant for multinational enterprises, but unfortunately data are available only at the national level. However, it was possible to define a subgroup of enterprises and enterprise clusters with.
(19) 16. major foreign inward or outward investments and compare the results for domestic and foreign-owned enterprise clusters. The results suggest that, to obtain more precise knowledge about the effects of R&D on innovation, and therefore to be able to have more credible guidelines for possible innovation policies, more comprehensive information is needed at the level of the company rather than at the level of the enterprises that form the company. The ongoing process of globalization poses a particular problem in this respect. Whereas national laws and tax regulations are the basis for the statistics that are usually available, even in the Community Innovation Surveys, it is likely that the decisions to innovate and to invest in R&D are taken “across borders.” The preliminary results show that the quantitative effects of modelling innovation behaviour at the “wrong” level may be far from negligible. In view of the evidence of differences in innovation behaviour between individual enterprises and those in clusters and in view of the theoretical argument that firms in a group take the group’s interests, constraints and possibilities into account when making decisions, it would be interesting to collect statistics at the group level, in particular for key variables such as R&D and innovation. Companies that are quoted on the stock exchange have to publish consolidated annual reports. Dun & Bradstreet have some data on multinational companies, but they are not necessarily innovation data. If the aim is to understand what drives innovation in large firms that are technological leaders, which account for the largest part of total R&D, it would be useful to obtain group-level statistics. In this way, it would be possible to get a clearer picture of whether size, R&D, market share, barriers to innovation and other determinants of innovation are relevant as stimuli for innovation, and hence whether they are worth acting upon to foster innovation..
(20) 17. With regard to developing indicators of innovation, the internationalization of business activity must be taken into account. To do this, statistics have to be collected at the group, or company, level, and this would require international surveys and co-operation among statistical offices. In Europe, such co-operation would be consistent with the Lisbon objectives. REFERENCES Blanchard, P., J.P. Huiban and P. Sevestre (2004), 'R&D and productivity in corporate groups: An empirical investigation using a panel of French firms', Paper presented at the conference on R&D, Education and Productivity, An International Conference in Memory of Zvi Griliches (1930-1999), Paris: August 25-27, 2003. Bongers, F., R. Goedegebuure, P. den Hertog and J. Segers (2003), Een verkenning van internationale kennistransfers, Studie van Dialogic op verzoek van het, Ministerie van Economische Zaken. Cornet, M. and M. Rensman, (2001), The Location of R&D in the Netherlands. Trends, Determinants and Policy, Centraal Planbureau (CPD) document no. 14, Den Haag. De Meyer, A (1992) 'Management of international R&D operations', in Ove Granstrand, Lars Håkanson and Sören Sjölander (eds.), Technology Management and International Business: Internationalization of R&D Technology. Sussex: John Wiley & Sons, pp.163179. Diederen, B. (2001), 'Micronoom: Micro-integratie van economische statistieken', Unpublished report prepared for Statistics Netherlands. Erken, H. and V. Gilsing (2005), 'Relocation of R&D: A Dutch perspective', Technovation, 25 (10), 1079-1092. Gassman, O. and M. von Zedtwitz (1999), 'New concepts in trends in international R&D organization', Research Policy. 28 (2-3), 231-250. Goedegebuure, R.V. (2000), 'Internationalization and competitiveness: Seeing through the Netherlands', Ph.D. dissertation, Rotterdam: Erasmus Universiteit Rotterdam..
(21) 18. Granstrand, Ove, Lars Håkanson and Sören Sjölander (1993), 'Internationalization of R&D — A survey of some recent research', Research Policy, 22 (5-6), 413-430. Organisation for Economic Co-operation and Development (OECD)/Eurostat (1997), Oslo Manual. Proposed Guidelines for Collecting and Interpreting Technological Innovation Data, Paris: OECD Publishing.. Raymond, W., P. Mohnen, F. Palm and S. Schim van der Loeff (2004), 'An empiricallybased taxonomy of Dutch manufacturing: Innovation policy implications', MERITInfonomics Research Memorandum Series. No. 2004-011. Maastricht: MERIT – Maastricht Economic Research Institute on Innovation and Technology. Spithoven, A. and P. Terlinck (2005), Beyond Borders: Internationalization of R&D and Policy Implications for Small Open Economies, Amsterdam: Elsevier.. 1. In order to have the dependent variable vary in the same range as the error term, a logistic transformation was applied to the share of sales from innovation. 2 Eighty-two enterprises with an R&D intensity greater than 50% were eliminated. 3 The marginal effects of the explanatory variables in the selection equation (equation (1)) were obtained by multiplying the estimated coefficients by the mean value of the normal density evaluated at the estimated score. 4 The elasticities for the share of sales from innovation were computed by multiplying the estimated coefficients by (1 minus the average share of sales from innovation). 5 In many cases, enterprises and enterprise clusters are the same thing. If enterprise clusters with only one enterprise were eliminated, the sample would be cut to one-third and would no longer yield enough observations to identify all parameters in the model. 6 There were not enough observations for separate estimates of the subset of domestic enterprise clusters with no foreign involvement, the subset of enterprise clusters under foreign control or the subset of enterprise clusters with foreign affiliates..
(22)
Figure
Documents relatifs
Exploitation and integration of digital technologies, which is pointed out by [6] as the first dimension of DT strategy development, can include digitalizing products
In our previous work [1], we have introduced a Fractal Enterprise Model (FEM) which has a form of a directed graph with two types of nodes Processes and Assets, where the
The overall structure of the enterprise is composed of its business and IT structures, such as stakeholders, strategy, business capabilities, domains and functions, business and
In this talk, I will describe the key secular trends that characterize the field of Big Data with respect to enterprise analytics.. I will describe some of the open challenges
Belgacom Mobile SIM card ordering process reengineering project overview The SPOMS project presents two new features that are being introduced as innovations to the
The BIVEE approach is based on an open, free innovation space, where innovators will be free to reach the objectives with the preferred strate- gies, according to
The CIP patent program increased the relative contribution of the team, when compared to the global R&D organization, from 18% to 33%.. Consequently, the CIP patent program
Meta model- ling techniques are applied to design the organizational Knowledge Space and then the Knowledge Maturing Scorecards approach is applied to define, manage and
