Keep it Down: An Experimental Test of the Truncated Uniform Price Auction
30
0
0
Texte intégral
(2) CIRANO Le CIRANO est un organisme sans but lucratif constitué en vertu de la Loi des compagnies du Québec. Le financement de son infrastructure et de ses activités de recherche provient des cotisations de ses organisations-membres, d’une subvention d’infrastructure du Ministère du Développement économique et régional et de la Recherche, de même que des subventions et mandats obtenus par ses équipes de recherche. CIRANO is a private non-profit organization incorporated under the Québec Companies Act. Its infrastructure and research activities are funded through fees paid by member organizations, an infrastructure grant from the Ministère du Développement économique et régional et de la Recherche, and grants and research mandates obtained by its research teams. Les partenaires du CIRANO Partenaire majeur Ministère du Développement économique, de l’Innovation et de l’Exportation Partenaires corporatifs Banque de développement du Canada Banque du Canada Banque Laurentienne du Canada Banque Nationale du Canada Banque Royale du Canada Banque Scotia Bell Canada BMO Groupe financier Caisse de dépôt et placement du Québec DMR Fédération des caisses Desjardins du Québec Gaz de France Gaz Métro Hydro-Québec Industrie Canada Investissements PSP Ministère des Finances du Québec Power Corporation du Canada Raymond Chabot Grant Thornton Rio Tinto State Street Global Advisors Transat A.T. Ville de Montréal Partenaires universitaires École Polytechnique de Montréal HEC Montréal McGill University Université Concordia Université de Montréal Université de Sherbrooke Université du Québec Université du Québec à Montréal Université Laval Le CIRANO collabore avec de nombreux centres et chaires de recherche universitaires dont on peut consulter la liste sur son site web. Les cahiers de la série scientifique (CS) visent à rendre accessibles des résultats de recherche effectuée au CIRANO afin de susciter échanges et commentaires. Ces cahiers sont écrits dans le style des publications scientifiques. Les idées et les opinions émises sont sous l’unique responsabilité des auteurs et ne représentent pas nécessairement les positions du CIRANO ou de ses partenaires. This paper presents research carried out at CIRANO and aims at encouraging discussion and comment. The observations and viewpoints expressed are the sole responsibility of the authors. They do not necessarily represent positions of CIRANO or its partners.. ISSN 1198-8177. Partenaire financier.
(3) Keep it Down: An Experimental Test of the Truncated Uniform Price Auction* Maurice Doyon†, Daniel Rondeau‡, Richard Mbala§ Résumé / Abstract La mise en place d’une enchère centralisée pour l'échange des droits de production dans les secteurs agricoles peut considérablement améliorer le flux d'information parmi les participants au marché, ainsi qu'accroître l'efficacité. Toutefois, les conditions qui règnent dans ces petits marchés peuvent fournir aux vendeurs un avantage de marché, ce qui produit des prix de quotas élevés et limite l'entrée de nouveaux producteurs dans l'industrie. Dans cet article, nous modifions la règle de répartition normale d'une enchère de prix uniforme (UPA) afin de favoriser les acheteurs qui offrent des prix plus faibles. Dans les expériences de laboratoire, nous testons une enchère de prix uniforme «tronquée» (T-UPA) contre une enchère de prix uniforme régulière afin de tester sa capacité de diminuer les prix d'équilibre, d'influencer le comportement de l'acheteur et du vendeur, et d'évaluer son impact sur l'efficacité économique. Les résultats montrent que la T-UPA réduit considérablement le prix d'équilibre et entraîne des pertes d'efficacité modérées. Plus important encore, la T-UPA réussit à contrer le pouvoir de marché des oligopoleurs lorsque la demande dépasse largement l'offre. Mots clés : Enchère, uniforme, économie expérimentale, tronquée, efficacité, marché de commodité. The introduction of a centralized institution for trading production rights in quota-regulated agricultural sectors can dramatically improve the flow of information among market pareticipants and increase efficiency. On the other hand, prevailing conditions in these small markets can provide sellers with a market advantage, yielding high quota prices that impose important financial costs on quota holders and limit the entry of new producers into the industry. In this paper, we modify the normal allocation rule of a uniform price auction (UPA) to favor buyers who bid low prices. In laboratory experiments, we test this “Truncated” Uniform Price Auction (T-UPA) against a regular Uniform Price Auction for its ability to decrease equilibrium prices, affect buyer and seller behavior and to assess how it impacts efficiency. The results show that the T-UPA significantly lowers the equilibrium price and results in moderate efficiency losses. Most importantly, the T-UPA effectively counters the market power of oligopolists when demand far outstrips supply. Keywords: Auction, uniform, experimental economics, truncated, efficiency, commodity market JEL codes: C9, D4, Q1. We would like to acknowledge the financial support of La Fédération des producteurs d’oeufs de consommation du Québec, of La Fédération des producteurs de poulets du Québec, and the staff of the experimental laboratory at CIRANO for their invaluable professional and technical support. † Department of Agricultural Economics and Consumer Science Laval University, Quebec, Qc., Canada Fellow CIRANO, Montreal, Canada. ‡ Corresponding Author: Department of Economics, University of Victoria, Victoria, BC, V8W 2Y2, Canada, 250-472-4423 Fax: 250- 721-6214, email: rondeau@uvic.ca § Department of Agricultural Economics and Consumer Science Laval University, Quebec, Qc, Canada. *.
(4) Keep it Down: An Experimental Test of the Truncated Uniform Price Auction 1. Introduction This paper reports on the design and experimental test of a modification to the allocation rule of the Uniform Price Auction (UPA) we call the Truncated Uniform Price Auction (T-UPA). In a nutshell, the T-UPA implements a two step allocation rule. In the first step, the equilibrium quantity and the identification of units to be sold are determined by the usual intersection of the suppliers’ offer curve and demanders’ bid curve. In the second step, the allocation to buyers is made. This is where the T-UPA differs from the regular UPA. In the UPA, the units transacted are allocated starting from the highest bidder, successively working down the bid curve until the last unit (at the equilibrium quantity) is reached. In the T-UPA, all demanders who made bids above the price asked by the seller of the equilibrium unit are eligible to receive units, and the allocation is done starting with the lowest of those bids and working up the buyer’s bid curve. In effect, the T-UPA allocation rule is designed to provide strategic incentives for buyers to submit the lowest possible bids while remaining above the marginal offer price established at the intersection of the bid and offer curves. It is hypothesized that this competition among buyers will create downward pressure on buyers’ bids and thus on equilibrium prices. If effective, this rule may be particularly useful in situations characterized by oligopoly or where there exists a substantial demand for a tightly constrained number of units offered for sale. This is precisely the type of conditions prevailing in several Canadian markets for tradable agricultural production quotas. Therefore, while this research is motivated by the design of a market mechanism for the trading of egg production permits in the province of Quebec, the findings are equally applicable to milk or chicken quota systems in effect across Canada. The knowledge gained from our experiments also applies more generally to broader applications of the UPA and our understanding of this important family of auctions. Our laboratory experiments show, as hypothesized, that the T-UPA produces equilibrium prices that are on average 25% lower than under the regular UPA. This outcome is the result of significantly lower buyer bids and somewhat lower seller offers. For egg producers in Quebec, the T-UPA would likely represent an important improvement over the unstructured quota market currently in place, and might also achieve the desired effect of providing improved access to 2 .
(5) young producers who do not have unfettered access to financial markets. However, the increased “downward” competition is generally accompanied by a reduction in the number of units traded and the allocation of units to buyers who value them less than others. This results in an overall efficiency loss of approximately 15% of the available surplus. Such losses should not be disregarded since the sub-optimal allocation of production quota under the T-UPA could have long term impacts on the competitiveness of the industry. We present and discuss the detail of these results in detail in Section 5. Before this, we provide a brief contextual description of the Quebec egg industry and production quota market, describe the T-UPA rules of allocation, and provide a description of the experimental design and research protocol. We conclude the paper with a discussion and final thoughts. 2. Context Numerous agricultural commodities are plagued by important upswing in prices, followed by periods of deeply depressed price. In the egg production sector, the U.S. response to price volatility and processors’ market power was the development of a vertically integrated industry. Canada has implemented a supply management regime coupled with imports restrictions. Since 1972, Canadian egg producers are required by law to hold a production permit (quota) for each laying hen they own. The quota system strictly controls the expansion of the industry and creates an oligopoly that maintains higher egg prices and reduces price volatility (Doyon et al. 2008b). The presence of oligopoly rents confers value to the individual transferable quota required for production. In a well functioning quota market, we would expect the price of a unit of quota to reflect the rents it allows by equating the annual rental cost (i.e. the financial cost or opportunity cost of holding permits) with the annualized economic rents from production. However, the small size of the industry and the illiquid nature of the physical infrastructure required to produce eggs (and other agricultural commodities where quotas are also required) likely make for a thin quota market, especially on the seller side. With few sellers and the demand for quota likely exceeding the supply available, it is believed that prevailing conditions in the egg industry (as. 3 .
(6) well as in the milk and chicken sectors) provide sellers with a distinct advantage, yielding quota prices that are relatively high within the range of admissible equilibrium prices.1 High quota prices are a concern for Quebec’s egg producers for two central reasons. First, large sums of money need to be capitalized into this non-productive asset (Boots et al 1997, Alvarez et al 2006). In the province of Quebec, there are approximately 103 egg farms, each with an average of 36 000 laying hens. Hence, the capitalized value of the quota likely exceeds $800 million, or close to 8 million dollars per farm. Second, there is a perception among industry leaders that high quota prices are detrimental to a renewal of the industry. They make it difficult for young individuals to become producers, artificially favoring a concentration of the industry into the hands of a few large agri-food corporations and slowly reducing the geographical distribution of producers across the province. While these trends may actually be desirable from the perspective of increasing the efficiency and long term competitiveness of the industry, current producers and stakeholders view this issue quite differently. Motivated by environmental and regional economic development concerns, current producers have clearly expressed that one of their objectives is to maintain a producerowner structure over a large territory. One interpretation of the situation is that existing quota holders – those who stand to lose the most from lowering quota prices - view the continuation of the current industry structure as a public good. Furthermore, they are collectively prepared to accept lower quota prices in exchange for its provision. Unfortunately, this willingness to provide a public good must inevitably confront the free-rider problem. In Quebec’s egg industry, the current lack of organized institutions for quota trading likely means that this collective good is not provided. Perhaps even worse, the existing approach to quota trading might also greatly exacerbate the impact of other market imperfections. In the last decade, a small number of input suppliers have become de facto quota brokers. Their regular contact with a large fraction of egg producers puts them at a great advantage for identifying both potential sellers of quota and potential buyers among existing producers. Feed and other input suppliers have successfully capitalized on this informational advantage by purchasing much of the available quota and tying its resale to exclusive long term input contracts. This situation 1. Models B and C employed in our experimental design will clearly illustrate this theoretical possibility.. 4 .
(7) introduced systematic informational rents to the market (largely if not entirely captured by feed suppliers). It has made the real quota price unobservable and allowed input suppliers to select buyers. Cumulatively, the current system leaves input suppliers with a large portion of the industry’s rents and undue influence over its future. It is within this context that the Quebec Federation of Egg Producers decided to create a centralized market institution for quota trading. The objective of the Federation is to implement a market mechanism in order to avoid allocating the by administrative decisions that pose the risk of being manipulated for favoritism. The market mechanism would ideally foster efficient trading of a relatively low volume of units in a market likely characterized by a small number of sellers and demand that substantially outstrips supply. The Quebec Federation of Egg Producers wishes to adopt a market rule that maintains downward pressure on the price as an indirect mechanism to favor the provision of its “industry structure public good”. Doyon and Rondeau (2006) explored various market designs that could potentially meet the objectives of Quebec’s egg producers. Together with egg producers, they concluded that a UPA with an alternative allocation rule possessed characteristics that held some promise of delivering the federation’s objectives. In the remainder of the study, we present and test the effect of this new allocation rule on the resulting market price, buyers and sellers behavior, the number of units traded and the resulting level of market efficiency. 3. The Truncated Uniform Price Auction The uniform price auction is recognized as a simple, transparent and efficient market allocation mechanism under a variety of market conditions. (Ausubel and Cramton 2002).2 However, this otherwise efficient auction design neither prevents market manipulation (Chatterjee and Jarrow 1998) nor strategic bidding and the exercise of market power (Bower and Bunn 2001), when the number of players is low, when multiple bids or offers are allowed, or when the allocation rules are modified to provide incentives for players to deviate from revealing their true valuation of the object being transacted. The experimental literature consistently reports how manipulations of the rules affects the behavior of market participants and equilibrium outcomes. Cason and 2. Economic efficiency is defined in terms of the percentage of total surplus (buyer and seller surpluses) being captured. The higher the percentage captured, the higher the efficiency. This definition of efficiency will be used throughout the paper.. 5 .
(8) Plott, (1996) compare the proposed EPA auction for the resale of SO2 emissions permits to a standard UPA. Under EPA rules, buyers’ bids were ranked from highest to lowest, and sellers’ asks from lowest to highest. The lowest ask was matched with the highest bid and the transaction price set at the bid price. Since a successful buyer paid the amount he bid, the EPA auction rules created an incentive for buyers to misrepresent their true value, and they did! Cason and Plott found that the EPA rules significantly reduced the average price and decreases market efficiency. Vossler et al. (2009) explore whether modifying the basic UPA can mitigate high prices (here, in a single sided market for wholesale electricity deliveries). They consider the introduction of a “soft-cap” with a unique pricing rule. All offers below the soft cap are treated as in a UPA and paid a clearing price equal to the highest accepted offer from those who submitted a price below the soft cap. Any capacity offered above the soft cap is purchased at the actual offer price in a discriminatory price auction. They conclude from their experimental investigation that the soft cap is unable to lower prices. In a study methodologically closer to ours, Doyon et al. (2008) evaluate the impact of modifying the UPA employed for the trading of dairy quota in Canada. Once again, the principal impetus for the modifications tested by Doyon et al. was to create downward pressures on prices. They test three different alternatives to the normal UPA. 1) a tax on units offered but not sold (akin to an all-pay auction); 2) outright exclusion of the highest bids and offers from the bid and ask schedules; and 3) a combinations of the two rules. Experimental results show that a tax significantly reduces the number of units offered and the efficiency of the market; without significantly reducing the market price. While the exclusion of highest priced bids and asks slightly decreased the equilibrium price, it also significantly decreased the number of exchanges (and economic efficiency) as might be expected since, by construction, the rule always excludes tradable units from the final allocation. Combining the two rules did not improve results. The truncation rule tested in this paper is an alternative price determination and quantity allocation procedure that modifies the normal rules of the uniform price auction. While we have outlined the rule in the introduction, greater details and an example are now provided. Under the T-UPA, both buyers and sellers are invited to submit bids and asks consisting of 1) the number of units they wish to buy or sell; and 2) the price at which they are prepared to buy or 6 .
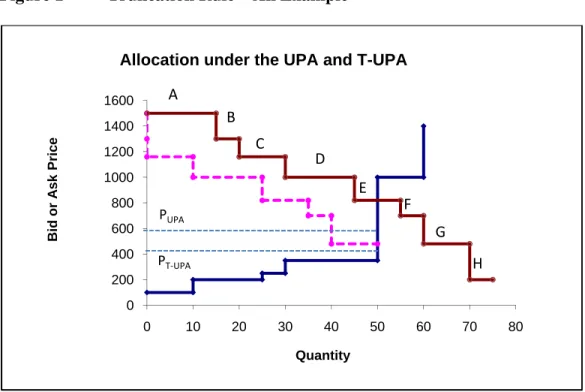
(9) sell respectively. While multiple units are involved, a restriction is imposed that participants can only submit a single bid or ask (participants can freely choose the number of units but must select a single price). This restriction limits the ability of participants to directly influence the equilibrium price with a series of bids or asks each with small quantities at various prices, a possibility that could lead to extensive strategic behavior (Wilson 1979, Back and Zender 1993, Khrisna 2002). Once the bids and asks are ordered in the way of typical supply and demand curves, the intersection of the bid and ask curves determines the quantity supplied to the market. In a standard UPA, the units to be sold are those starting with the lowest asking price on the supply curve, moving sequentially up to the intersection of the bid and ask functions. This rule remains unchanged in the T-UPA. . The T-UPA modifies which buyers get to purchase those units (and at what price). Whereas a standard UPA simply allocates the units in decreasing order of bid price, the T-UPA favors bidders with low bids first. Bidders are declared eligible to purchase some of the traded units as long as their bid price is equal to or greater than the price asked by the seller of last transacted unit (the unit at the intersection of the bid and ask curves). In a reversal of normal rules, the units are then sold in priority to bidders who submitted the lowest (rather than the highest) price bids.3 Another way of looking at the allocation rule is that it implements a leftward shift of the revealed-demand curve whenever there exist some units that are to the right of the supplydemand intersection, and for which the bid price exceeds the asking price at the equilibrium quantity. Figure 1 illustrates the rule and its potential impacts on the equilibrium allocation. It presents with solid lines, examples of ordered buyer bids and seller asks submitted by market participants. Ignoring the dashed lines momentarily, the intersection of the supply and demand curves determines that 50 units will be traded. Under the T-UPA rules, the asking price of the last unit sold (unit #50) is 350. Inspection of the demand curve reveals that all buyers from A to G 3. We have also implemented identical tie-breaking rules in the UPA and T-UPA. These do not modify the equilibrium price and quantities, but determine which participant gets to sell (buy) units when two or more sellers (buyers) have submitted asks (bids) at the same price and it is not possible to meet all orders at that price. The tiebreaking rule that we apply universally to both buyers and sellers gives priority to the smallest quantity submitted. This simply increases the likelihood that at least one order in the tie will be fully traded satisfied. If the offers are identical with respect to both the price and quantity submitted, the order fulfilled first is chosen randomly.. 7 .
(10) inclusively have made bids equal or greater than 350, qualifying them for purchases. Buyer H is excluded because his price is below marginal price of 350. The allocation to buyers is then made starting with buyer G and moving up sequentially to F, E, D, up to and ending with Buyer C who, in this example, obtains his full order. Effectively, the allocation results from shifting the bid curve to the left (the downward slopping dashed curve in Figure 1) up to the lowest possible point of intersection that maintains a total of 50 units being traded. Figure 1. Truncation Rule – An Example. Allocation under the UPA and T-UPA A. 1600. B. Bid or Ask Price. 1400. C. 1200. D. 1000. E. 800. F. PUPA. 600 400. G. PT‐UPA. H. 200 0 0. 10. 20. 30. 40. 50. 60. 70. 80. Quantity. Under the T-UPA we implement, the uniform clearing price is set halfway between the asking price and bidding price at the intersection of the supply and shifted demand schedule. In the example above, this is a price of $415. By comparison, the normal UPA we implement as a control in our experiment would yield radically different results. While an identical number of units (50) would be supplied by the same sellers, Buyers A through D would see their entire orders fulfilled and buyer E would only receive a fraction of his order. Furthermore, the equilibrium price under the UPA would be set at the half way point between the supply curve and the original buyer schedule, yielding a substantially higher transaction price of 585.. 8 .
(11) It is worth pointing out that the T-UPA and standard UPA rules yield identical results whenever extra-marginal demand (units on the demand schedule to the right of the intersection) have a bid price below the asking price of the last unit sold. Thus, if the T-UPA rule did not modify the bids and asks made by market participants, it would either leave the equilibrium price unchanged, or lower it whenever the configuration of the bid and ask schedules triggers the shift in the revealed demand curve. However, as with the exclusion rule tested in Doyon et al (2008), the T-UPA rule is designed to create strategic incentives for buyers to lower their bids by creating greater competition among them and favoring low price bidders.4 Unfortunately, the T-UPA rule also has potentially negative effects on efficiency. Efficiency losses will occur whenever the allocation of traded units is incorrect in the sense that bidders who value the units the most are excluded from transacting. Such risks are present in all forms of market institutions, but might be exacerbated by the T-UPA rules. High value buyers with incentives to lower their bid might collectively demand units at prices sufficiently low that they do not obtain them. The overall number of units traded would then be lower than the welfare maximizing number, or units could be allocated to bidders with lower value for them. At a minimum, we expect that the T-UPA will generate greater efficiency than the tax and exclusion treatments tested by Doyon et al. (2008). 4. Experimental Design and Procedure Two sets of experiments were conducted to compare the impact of the T-UPA against the standard uniform price auction. The underlying market environments were identical across all experiments. The market was made up of seven buyers and five sellers who kept the same role for a total of thirty periods of play. At the beginning of each period, sellers were given a number of units they could sell, and a uniform cost of producing each unit if it was successfully sold. Buyers were told that they could attempt to buy up to a specified number of units and that each unit they successfully purchased would yield a given amount of currency (i.e. a constant resale value).. 4. A formal theoretical prediction is elusive and may very well include mixed strategies. Hence, we do not present formal game-theoretic predictions. However, the prediction that allocating units first to low-bid buyers can only lower the equilibrium bidding strategy should not be contentious.. 9 .
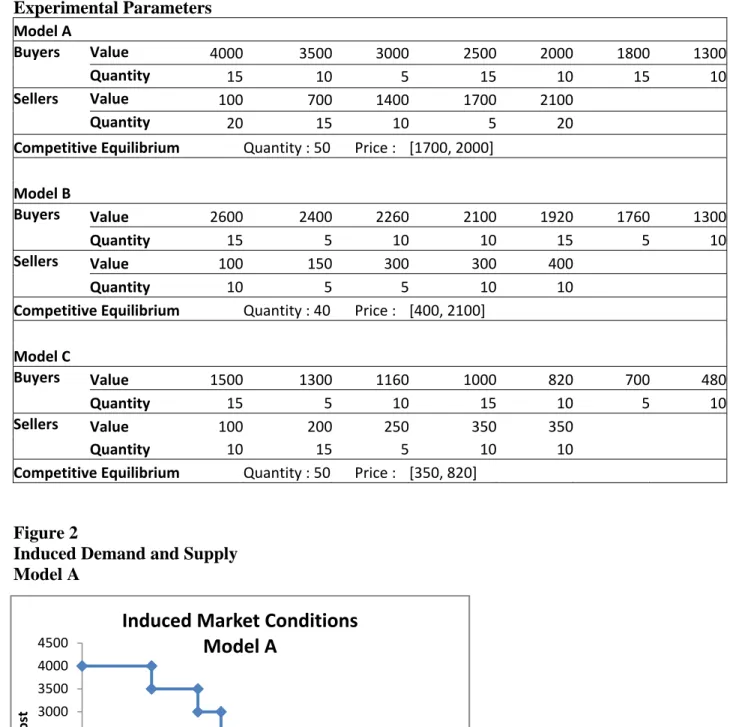
(12) Subject could visually determine that there were twelve participants, but were not told how many were buyers and sellers. All information on quantities and reserve prices (induced values) was private and kept confidential. In each period, a subject’s task was to submit a bid or ask containing two pieces of information: 1) the number of units offered (seller) or sought (buyer); and 2) the price at which he is prepared to transact at (maximum willingness to pay for buyers and minimum willingness to accept for sellers). The information was aggregated and the outcome of the market computed. At the end of each period, each individual was privately given the number of units he/she transacted, the market clearing price and their resulting level of individual profit. The first six periods of the experiment were unpaid practice rounds. Each of these periods implemented different vectors of market parameters (individual quantities and reserve prices), allowing participants to familiarize themselves with their task, the computer interface and the impact of their decisions. The experiment then proceeded with twenty four paid trading periods, divided in three sets of eight. During each set, the same vector of market parameters were kept, but the quantity and induced value that a participant was given changed with each new period. This was done to prevent participants from settling into particular patterns of behavior premised on a simple repetition of previous rounds, yet maintained the overall market structure to facilitate data analysis and comparisons over time and across treatments. We label the three different configurations of the market as Models A, B and C respectively. They are summarized by Figures 2, 3 and 4 and Table 1.. 10 .
(13) Table 1 Experimental Parameters Model A Buyers Sellers . Value Quantity Value Quantity . 2000 10 2100 20. 1800 15. 1300 10. Competitive Equilibrium . 4000 3500 3000 2500 15 10 5 15 100 700 1400 1700 20 15 10 5 Quantity : 50 Price : [1700, 2000]. Model B Buyers Value Quantity Sellers Value Quantity Competitive Equilibrium . 2600 2400 2260 2100 15 5 10 10 100 150 300 300 10 5 5 10 Quantity : 40 Price : [400, 2100] . 1920 15 400 10. 1760 5. 1300 10. Model C Buyers Value Quantity Sellers Value Quantity Competitive Equilibrium . 1500 1300 1160 1000 15 5 10 15 100 200 250 350 10 15 5 10 Quantity : 50 Price : [350, 820] . 820 10 350 10. 700 5. 480 10. Figure 2 Induced Demand and Supply Model A. Induced Market Conditions Model A. 4500 4000 Value/Cost. 3500 3000 2500 2000 1500 1000. Induced Demand Induced Supply. 500 0 0. 20. 40 Quantity. 60. 80. 11 .
(14) Figure 3 Induced Demand and Supply Model B. Induced Market Conditions Model B. 3000. Value/Cost. 2500 2000 1500 1000 500. Induced Demand Induced Supply. 0 0. 20. 40 Quantity. 60. Figure 4 Induced Demand and Supply Model C. Induced Market Conditions Model C. 1600 1400 1200 1000 800 600 400 200. Induced Demand Induced Supply. 0 0. 10. 20. 30. 40. 50. 60. 70. The different models introduce variations in the relative position of the demand and supply functions. Model A is generic in the sense that there are extra-marginal quantities (i.e. to the right of the curves’ intersection) on both the demand and supply sides. Model A also has a 12 .
(15) relatively “fine” crossing (small price difference at the crossing). Models B and C, in contrast, introduce two markets characterized by significant excess demand and are probably more representative of most short run agricultural quota markets. In both situations, efficiency calls for all available units to be sold. With demand far exceeding supply we would expect sellers to take advantage of the situation, resulting in equilibrium prices closer to upper range of the competitive equilibrium interval (see Smith, 1962, for such results in the double auction). On the other hand, the large vertical distance between the demand and supply curves and the excess demand leaves a substantial amount of room for the T-UPA allocation rule to generate intense competition between all buyers, putting downward pressure on the equilibrium price. As such, Model B should provide insights into the ability of the T-UPA to contain seller power in a supply-constrained market. Model C also embodies excess demand, but the relative elasticities and smaller equilibrium price interval are far less conducive to the exercise of market power. The smaller distance between the curves also reduces the margin of error for buyers since strategic bidding under the T-UPA runs a greater risk of resulting in lost transactions. The experiments were implemented using z-tree (Fischbacher, 2007) and conducted at the CIRANO laboratory for experimental economics in Montreal, Canada. Subjects were university students from all disciplines recruited via email invitations using the laboratory’s standing list of student volunteers. Though some subjects had likely participated in economic experiments in the past, none were allowed to attend more than one of our own sessions. Individuals arrived at the laboratory, were randomly seated at a station protected by privacy screens (hence randomly assigned to their role of buyer or seller), before they read and signed consent forms. They then received oral explanations and instructions. They were given the opportunity to ask questions in private, which were relayed to the entire group and answered publicly only if they concerned general understanding and clarifications (questions of strategy or revealing private information were not shared nor answered). Sessions lasted approximately 90 minutes and participants received between $18 and $50, (including a $5 show up fee) for a session that lasted approximately 90 minutes.. 13 .
(16) 5. Data and Results In total, we report the data from 10 sessions of the normal uniform price auction and 11 sessions of the T-UPA. We analyze the data from Model A for all 21 sessions. In all sessions, Model A was the first one presented to participants. A minor programming error resulted in a small allocation error in about 20% of the periods of Models B and C. Thus, we restrict our analysis of behavior under these market conditions to 3 sessions for each of the two auction modes.5 Table 2 summarizes the number of observations underlying the analysis. Table 2 Number of Participants and Number of Individual Observations (decisions) by Model Model A Model B Model C Total Unique Buyers/Sellers UPA 70/50 21/15 21/15 182/130 Unique Buyers/Sellers T-UPA 77/55 21/15 21/15 119/85 Total Unique Buyers/Sellers 147/105 42/30 42/30 301/215 Number of Bids/Asks UPA 560/400 168/120 168/120 1456/1040 Number of Bids/Asks T-UPA 616/440 168/120 168/120 952/680 Total Bids/Asks 1176/840 336/240 336/240 2408/1720 The analysis proceeds first by presenting overall market outcomes before delving into how the underlying behavior of buyers and sellers is affected by the T-UPA market rule. 5.1 Transaction Prices Result 1: The uniform transaction price under the T-UPA allocation rule is significantly lower than under the UPA rule. Result 1 confirms the central hypothesis of the paper and the main motivating factor behind this research that the T-UPA puts a significant downward pressure on the transaction prices. The summary statistics by model are presented in Table 3, while Figure 5 presents the results visually for the mean transaction price per period for both treatments. 5. The programming error resulted in one of the buyers (not always the same individual) purchasing one fewer unit than the auction rules actually called for, and only on some occasions. We have separately analyzed the data from the affected sessions and find no qualitative differences in the behavior of participants. However, the slight misallocation makes efficiency calculations inaccurate. Thus, while there is no evidence to suggest that the programming error was perceived by participants (consciously or not), we simply err on the side of caution and leave all of the affected data out of this paper.. 14 .
(17) In addition to the mean transaction price for each period, Figure 5 includes three horizontal lines for each model. As benchmarks, they indicate the minimum, maximum and mid-range of the interval of prices that are consistent with efficient market clearing. Figure 5. Mean Equilibrium Prices, per periods and per models. . Mean Transaction Price. Price 2200 2000 1800 1600 1400 1200 1000 800 600 400 200. UPA. 0 1. 2. 3. 4. 5. 6. 7. Eq (Mid‐Range) 8. T‐UPA. 9 10 11 12 13 14 15 16 17 18 19 20 21 22 23 24 Period. Note : periods 1 to 8 (Model A), periods 9 to 16 (Model B) and periods 17 to 24 (Model C). . Table 3 Equilibrium Transaction Price, Aggregated by Models. Mean Median Max Min Std. Dev. Obs.. Model A Model B Model C UPA T-UPA UPA T-UPA UPA T-UPA 1831.28 1655.16 1554.33 757.92 721.46 460.90 1800.25 1700.25 1562.50 704.75 702.50 472.75 2375.00 2300.00 1725.00 1149.50 900.00 676.00 1200.50 700.00 1350.00 512.50 575.00 337.50 214.44 369.71 108.07 206.52 89.18 80.92 80 88 24 24 24 24. For each of the models, the average price in the truncated auctions is lower than in the UPA by a significant margin. In model A, the decrease in price is slightly less than 10%, whereas for 15 .
(18) Models B and C the decrease is respectively 51% and 36%. Statistical analysis of the data confirms the obvious casual observation that the T-UPA generates significantly lower prices that the UPA. Although observations within a session are not independent from one another, usual test statistics provide some sense (albeit biased) of the statistical importance of those differences and are presented as a guide to assess their strength. Here all of the usual tests (t-test, F-test, Welch, Mann-Withney performed separately for each model) on the means and medians easily reject the null hypothesis of equality of the equilibrium prices. For example, the weakest of all the means tests is for the difference between the prices of Model A, with a probability of equality between UPA and T-UPA measured at p<0.0003. The weakest medians test is also for Model A with a probability p<0.0006. The variance in the equilibrium price across treatment are significantly different for Model A, and for Model B, but not so (p=0.69) for Model C. This, we speculate are the results of different factors, including learning over time and the large band of theoretically admissible equilibrium prices in Model B compared to Models A and C. It is worth discussing the results of Model B further. Recall that Model B is the economy where the gap between demand values and supply costs is greatest, and where supply is most severely constrained. Consistent with the early findings of Smith (1962) with a double auction, the UPA data under these conditions show clear signs of the ability of sellers to take advantage of the situation. Indeed, for Model B (and C to a lesser extent), transaction prices are significantly greater than the mid-range of the theoretical market clearing price. Moreover, the average clearing price of Model B is much closer (1554) to the willingness to pay of the marginal buyer (1920) than of the reserve price of the marginal seller (400). The T-UPA, on the other hand, successfully restrains seller’s ability to capture those profits, with the average equilibrium price falling to 758. Overall, these results demonstrate the ability of the T-UPA to lower equilibrium prices, and to do so effectively when market conditions otherwise strongly favor the exercise of market power by sellers. 5.2 Number of Units Traded The formal testable hypothesis that we explore in this section is that the number of units traded under the two market rules are equal across treatments, irrespective of the underlying economic 16 .
(19) conditions. This is a necessary condition – though not a sufficient one – for achieving allocative efficiency. Unfortunately, it is not borne by the data. Result 2: The T-UPA allocation rule results in a smaller number of trades than the UPA Table 4 presents the descriptive statistics for the number of units traded, aggregated for each of the model economies, while Figure 6 shows the evolution of the mean number of trades for each period. As a benchmark, the number of units that would be traded in an efficient allocation is 50 for models A and C, and 40 for Model B.. Figure 6. Mean Number of Units Traded per Periods and per Models. Mean Number of Units Traded 55 50 45 40 35 UPA 30. Theoretical Market Clearing. T‐UPA. Period 1 2 3 4 5 6 7 8 9 10 11 12 13 14 15 16 17 18 19 20 21 22 23 24 . Note : periods 1 to 8 (Model A), periods 9 to 16 (Model B) and periods 17 to 24 (Model C). Table 4 Equilibrium Quantity Traded, aggregated by model Model A Model B Model C UPA T-UPA UPA T-UPA UPA T-UPA 43.3 41.0 39.4 37.9 45.8 42.8 Mean 45 43 40 38 49.5 45 Median 50 50 40 40 50 50 Max 25 17 35 34 25 32 Min 4.98 5.84 1.47 1.94 6.21 5.35 Std. Dev. 80 88 24 24 24 24 Obs. 17 .
(20) It is clear that the number of trades is lower under the T-UPA than under UPA. Although the difference is not large in absolute terms, with roughly 4% fewer units traded under the TUPA. Ttests on the means yield p-values of 0.007, 0.003 and 0.079 for Models A, B and C, respectively. For Model C the p-value of 0.07 is just outside the usual bounds of strict rejection (0.05). Yet, since non-parametric tests on medians all clearly reject the hypothesis that quantities traded are equal (p<0.001), it seems safe to conclude that the T-UPA significantly lowers the number of trades in the market. Note that neither the UPA nor the T-UPA is clearly successful at delivering all of the units that should ideally be traded if all the gains from trade were seized. Early in the experimental sessions (Model A) participants managed to trade less than 80% of units predicted to trade. This percentage increases early in the sessions but by the end of the experiments, a significant number of trades remain unexecuted. The exception is model B where 98% of trades take place under the UPA and 95% under the T-UPA. Once again, much of this can probably be attributed to the large spread between the demand and supply functions. The weaker ability of the T-UPA to deliver all the welfare-enhancing trades raises concerns for the efficiency performance of the mechanism, a criterion we now turn to. 5.3 Market Efficiency The results presented to this point confirm the hypothesis that the T-UPA sufficiently alters the incentives of market participants to have a marked effect on both the price and allocation of the traded commodity. To the extent that lower prices are seen as an indirect mechanism for the indirect provision of a public good, this result can be viewed as a benefit by existing egg quota holders whose quota value would be lowered by the introduction of the T-UPA. The reduction in the number of units traded, on the other hand, should clearly be seen as one of the costs associated with the mechanism. We should suspect that this negative aspect of the T-UPA will have repercussions on the level of efficiency attained by the mechanism. We measure efficiency as the proportion of the maximum possible gains from trade that are actually captured by market participants. The central result from our experiments is summarized by the following statement:. 18 .
(21) Result 3: For the experimental conditions implemented in this study, the T-UPA captures 15 fewer points of percentage of the potential gains from trade than the UPA. Table 5 provides a summary of the results, while Figure 7 presents distributions for each model and treatment of the proportion of the available surplus that was captured by participants under the different model economies. Table 5. Percentage of the Total Available Surplus Captured Aggregated by Model Model A Model B Model C Total . UPA 88,8% 97,1% 93,3% . T‐UPA 76,1% 77,9% 74,3% . 91,3% . 76,1% . While not 100% efficient, the regular UPA allows participants to capture between 89% and 97% of potential gains from trade. In contrast, the truncated auction records efficiency levels averaging between 74% and 78% for an overall efficiency loss of 15% compared to the UPA. Inspection of Figure 7 reveals that the UPA results in a systematic shift away from the highest levels of surplus captured towards greater dispersion and lower bounds for the single period performance.. 19 .
(22) Model A. Model B. UPA. UPA. 14 12 10 8 6 4 2 0 0.0. 0.2 0.4 0.6 0.8 Fraction of the Surplus Captured. 6. 4. 2. 0. 1.0. 0.0. 12 9 6 3 0. 1.0. 0.0. 10 8 6 4 2 0. 1.0. 6. 4. 2. 0 0.0. 0.2 0.4 0.6 0.8 Fraction of the Surplus C aptured. 0.2 0.4 0.6 0.8 Fraction of the Surplus Captured. 1.0. T-UPA. 8. Frequency - Number of Periods. Frequency - Number of Periods. Frequency - Number of Periods. 0.2 0.4 0.6 0.8 Fraction of the Surplus C aptured. 15. T-UPA. 12. 0.2 0.4 0.6 0.8 Fraction of the Surplus Captured. UPA. 8. T -UPA. 0.0. Model C Frequency - Number of Periods. Frequency - Number of Periods. Frequency - Number of Periods. Figure 7 Distribution of the Fraction of Surplus Captured - Treatments and Models.. 1.0. 7 6 5 4 3 2 1 0 0.0. 0.2 0.4 0.6 0.8 Fraction of the Surplus Captured. 1.0. Two factors contribute to the loss of efficiency. The first, already noted, is the loss associated with the sub-optimal number of units traded. Each unit that goes untraded necessarily implies a loss of efficiency. The second factor which might be particularly problematic for the T-UPA is the “misallocation” of units to extra-marginal buyers and sellers, participants who, on the basis of the underlying induced values, are on the right-hand-side of the equilibrium crossing of the supply and demand schedules. The trading of these extra-marginal units can happen with any auction mechanism. However, the T-UPA is particularly vulnerable to it since, by construction, the allocation rule explicitly gives priority to the holders extra-marginal units (albeit in the vector of submitted bids and asks). This explicitly gives a chance to participants with extra marginal buyer values to displace higher value demanders. This effect of the truncation rule can only be attenuated if high value buyers place the lowest of the admissible bids. The difficulty that arises, of course, is that with this strategic incentive to bid low comes the risk of being left out of the market entirely. Hence the hypothesis and result that Result 4: Units defined as extra-marginal based on the underlying distributions of reserve prices are more likely to be traded in the T-UPA auction and contribute significantly to lowering the efficiency of the market rule.. 20 .
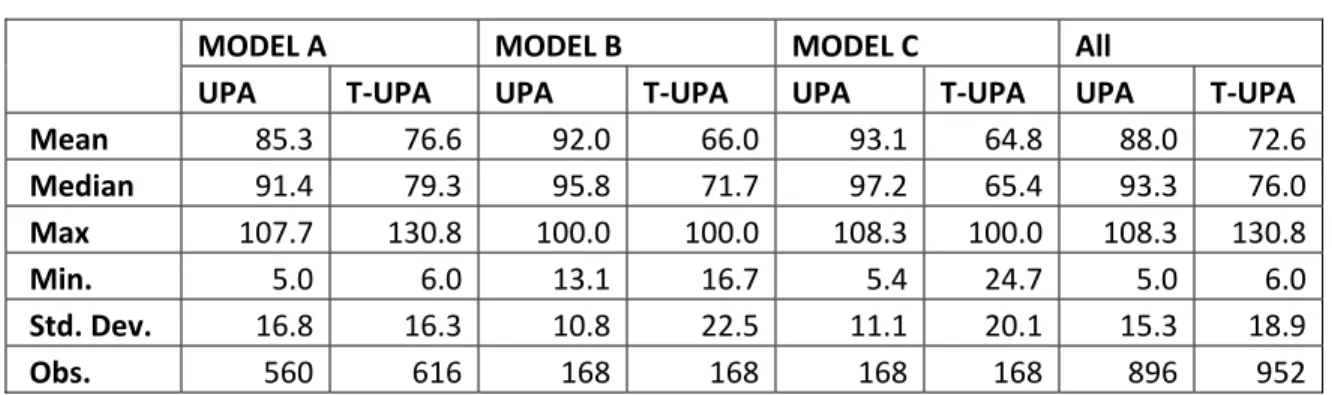
(23) In our dataset, we identified whether a unit is extra-marginal based on the induced demand and supply curves. It is then possible to identify the number and proportion of transactions that involve such units. For the regular UPA, and across all models, merely 1.05% of the 5,507 units exchanged in our experiments were extra-marginal on the demand side. In contrast, this proportion climbs to 10.3% of the 5,542 units traded under the T-UPA. This tenfold increase in the transaction of extra-marginal units appears to be the principal weakness of the T-UPA in our tests. The rule provides significant opportunities for less efficient buyers to purchase units and it follows that both the quantity reduction and the increase in extra-marginal trades contribute to the loss of efficiency associated with the T-UPA. 5.4 Individual Behavior We conclude the analysis of results with a brief description of the impact of the allocation rule at the individual level. We look, in turn, at the bids of buyers and offers of sellers in an effort to understand the channels by which the market outcomes are are affected. 5.4.1 Buyer Behavior The central idea behind the truncation rule was to generate downward price competition among buyers. Since the equilibrium price is indeed lower under the T-UPA, it is worth verifying whether these incentives have in fact affected the price submitted by buyers. Result 5: Buyers submit significantly lower bids under the T-UPA than under the UPA We converted buyer bids to express them as a ration of their induced value. The result is a normalized measure - ranging from 0 to 1.3 (measures above 1 must be bidding errors but there are only a small number of ratios above 1) that we present In Table 6 and Figure 8 as percentages. Table 6 clearly demonstrates a sharp and systematic difference between the bidding prices of participants across treatments. Buyers submit prices that are on average 88% of their true value in the UPA, whereas buyers in the T-UPA bid only 72%. All means and medians from the TUPA are substantially lower than the comparable measure in the UPA. These differences are universally highly significant in all parametric and non-parametric tests performed (p < 0.001).. 21 .
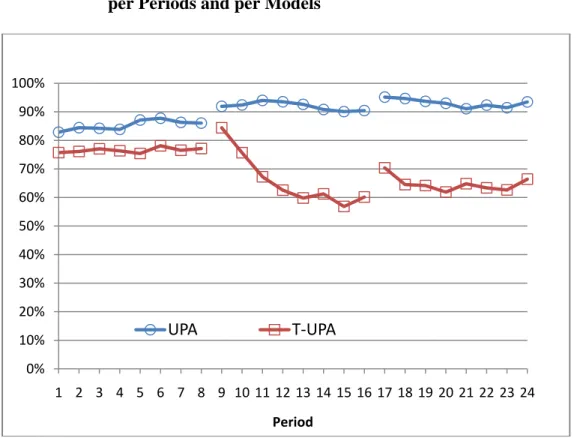
(24) With the exception of the data for Model A, the variance of the T-UPA price is also significantly greater, making the overall distributions of prices both shifted down and much flatter under the T-UPA. This confirms the expected primary impact of the truncation rule. Table 6. Mean Median Max Min. Std. Dev. Obs. . Price Submitted by Buyers as a Percentage of their Induced Value, Aggregated by Model MODEL A MODEL B MODEL C All UPA T‐UPA UPA T‐UPA UPA T‐UPA UPA T‐UPA 85.3 76.6 92.0 66.0 93.1 64.8 88.0 72.6 91.4 79.3 95.8 71.7 97.2 65.4 93.3 76.0 107.7 130.8 100.0 100.0 108.3 100.0 108.3 130.8 5.0 6.0 13.1 16.7 5.4 24.7 5.0 6.0 16.8 16.3 10.8 22.5 11.1 20.1 15.3 18.9 560 616 168 168 168 168 896 952. Figure 8 further illustrates the impact of the auction rule in different models (and perhaps the effect of learning). It presents the average of the bid to value ratio for each of the 24 periods. The patterns observed are consistent with the result that the T-UPA has the greatest impact when there exists excess demand (Models B and C) and when there is a wider interval of efficient equilibrium prices (Model B). Of the two conditions, though it would appear that the excess demand is a more important factor since buyers continue to substantially shave their bids in Model C, where there continues to be excess demand, but where the gap in the reserve price is smaller than in Model B. These observations are necessarily speculative at this point. Greater variation in underlying parameters, and controlling for possible order effects, would seem necessary in order to better understand the importance of each component. One thing is very clear, however, buyers respond to the incentives provided by the T-UPA by lowering their bid prices.. 22 .
(25) Figure 8. Average Price Submitted by Buyers as a Percentage of their Induced Value per Periods and per Models. 100% 90% 80% 70% 60% 50% 40% 30% 20%. UPA. 10%. T‐UPA. 0% 1 2 3 4 5 6 7 8 9 10 11 12 13 14 15 16 17 18 19 20 21 22 23 24 Period Note : periods 1 to 8 (Model A), periods 9 to 16 (Model B) and periods 17 to 24 (Model C). 5.4.2 Seller Behavior As for buyers, we once again employ the quotient of bid price to reserve price to explore the behavior of sellers. Here, the results are mixed and conveyed well by visual inspection of Figure 9. It reveals that buyers did not behave differently under Models A or C. This is confirmed by Table 7. T-UPA offers are higher for Model A and somewhat lower for model C, though neither difference is statistically significant. However, significantly lower asking prices are observed in the T-UPA under the stressful conditions of economy B (p<0.002). It is also notable that asking prices in the UPAs with Model B is the most volatile data from our experiments. This is undoubtedly attributable to the large gap between demand and supply prices at the theoretical equilibrium, and the ability of sellers to search for greater profits. In contrast, the T-UPA produced much less volatility in this imperfect market, a result that could be seen as an additional benefit in agricultural quota markets. Asking prices in Model B with the T-UPA are substantially reduced, reaching 174% of costs, a value in line with the results of Models A and B.. 23 .
(26) It is notable that the T-UPA mechanism can lead sellers to different behavior (at least some of the time) since the only direct effect of modifying the auction’s incentive is on buyers. This reinforces the ability of the truncation rule to contain inflationary pressure. Figure 9. Average Bids Submitted by Sellers as a Percentage of their Induced Values per Periods and per Models. Average Bids Submitted by Sellers 400% 350% 300% 250% 200% 150% 100% 50%. UPA. 0%. T‐UPA. 0 1 2 3 4 5 6 7 8 9 10 11 12 13 14 15 16 17 18 19 20 21 22 23 24 Note : periods 1 to 8 (Model A), periods 9 to 16 (Model B) and periods 17 to 24 (Model C). Table 7 . Average Bids Submitted by Sellers as a Percentage of their Induced value, Aggregated by Models . Model A Model B Model C . UPA 152% 267% 184% . T‐UPA 159% 174% 164% . Theoretical prediction P‐value for perfect competition 100% 0,61 100% < 0 100% 0,25 . . 6. Closing Remarks The truncated uniform price auction has been shown to significantly reduce the market clearing price when compared to the standard uniform price auction. It does so by significantly reducing buyers’ bids and by reducing the asking price of sellers in extreme market conditions where 24 .
(27) sellers have shown an ability to exercise market power in a standard uniform price auction. In fact, the greatest effect of the truncated rule was felt under conditions that ought to be considered the most favorable to sellers: large excess demand and wide difference between the reserve prices of the marginal buyer and seller (Model B). In these conditions, the truncated rule was able to dramatically reduce the ability of sellers to push the equilibrium price up. This is an important finding that could help devise better allocations rules in thin agricultural quota markets and in other sectors marked by excess demand and market power. However, the reduction in market clearing prices and the ability to mitigate market power among sellers come at a cost. This cost is a drop in the number of units transacted and the sub-optimal allocation of some units to buyers who value them less than other excluded participants. These combined effects result in a loss of efficiency in the order of 15% in our experiment. Nevertheless, these results compare advantageously with the modifications to the uniform price auction market tested by Doyon et al (2008). The best that Doyon et al (2008) achieved was a mere 5% reduction in market clearing price, with a reduction of 50% in the number of units traded and a 52 point reduction in efficiency. This contrasts sharply with our results in Model B where a 51% reduction over the competitive market price is obtained in exchange for a reduction of roughly 4% in the number of unit traded and an efficiency loss of 15 points of percentage. Although efficiency losses are not as important here as they were in Doyon et al (2008), they are significant. It is difficult to measure the long term impact of this phenomenon. One could argue that if buyers’ bids are a reflection of their comparative advantage, then the efficiency loss would reduce the long term competitiveness of Quebec’s egg production sector. However, it is quite likely that the adoption of the truncated uniform price auction in Quebec’s egg industry (or any other centralized market mechanism that evicts input suppliers from the quota trade) would represent a sizeable improvement for the long term efficiency of the egg industry. By construction, the T-UPA also has distributional consequences that favor buyers over sellers. In our experiments, sellers captured 50.3% of the realized gains from trade in UPAs compared to 39.7% under the T-UPAT. It might very well be that this kind of redistributive impact and the lower prices generated by the T-UPA are both conduits and indicators of the ability of the TUPA to favor small and new entrants and limit the geographical concentration of the industry. 25 .
(28) Nevertheless, efficiency losses should be seriously considered and weighted against those perceived benefits before implementing the truncated uniform price auction in the field. Thus, while few if any economists would enthusiastically recommend the broad adoption of such a mechanism, Quebec Egg Producers have the legal power (through a democratic process) to choose and implement the quota allocation rules they wishes to have. Current quota holders who stand to lose the most from the implementation of the T-UPA are in fact preparing for its deployment in Quebec. Since they have received the information gathered in this research project, their decision to forge ahead with the mechanism must be taken as evidence that they are deeply committed to maintaining a low level of industry concentration despite the cost falling predominantly on them. The actual implementation of the auction should provide exciting opportunities to analyze the behavior of actual buyers and sellers in the Quebec egg quota market. Given that the egg industry (and many other such markets) are really small groups of individuals who know each other, future research should explore whether allowing more explicit means of manipulating the market or colluding with other participants might affect the auction’s outcome. Kremer and Nyborg (2004), for instance, point out that in a single-sided UPA (buyers compete for a fixed supply), allowing buyers to submit several quantity-price pairs produces strategic incentives that can lead to a lowering of the selling price (an undesirable outcome in their context). Not only might such rules further reduce transaction prices, but allowing buyers to bid on several quantities at different prices could perhaps increase efficiency by increasing the number of units traded and reducing the number of units sold to extra-marginal buyers.. 26 .
(29) References Alvarez, A., C. Arias and L. Orea. 2006. Explaining differences in milk quota values: The role of economic efficiency. American Journal of Agricultural Economics 88 (1): 182–193. Ausubel, L. M. and P. Cramton. 2002. Demand reduction and inefficiency in multi-unit auctions. University of Maryland Working Paper 96-07. Back, K., and J. F. Zender, 1993. Auctions of Divisible Goods: On the Rationale for the Treasury Experiment. Review of Financial Studies Vol. 6: 733-64. Boots, M., A. Oude Lansink and J. Peerling. 1997. Efficiency lost duet o distorsions in Dutch milk quota trade. European Review of Agricultural Economics 24: 31–46. Bower, J. and D. Bunn, 2001. Experimental analysis of the efficiency of uniform-price versus discriminatory auctions in the England and Wales electricity market. Journal of Economic Dynamic & Control 25: 561-592 Cason, T. and C. Plott. 1996. EPA’s New Emissions Trading Mechanism: A Laboratory Evaluation. Journal of Environmental Economics and Management 30: 133-160 Chatterjee, A. and R. A. Jarrow. 1998. Market manipulation, price bubbles, and a model of the U.S. Treasury securities auction market. The Journal of Financial and Quantitative Analysis 33 (2): 255–289. Cramton, P. 2004. Competitive Bidding Behavior in Uniform-Price Auction Markets. Proceedings of the Hawaii International Conference on System Sciences, January. Doyon, M. et D. Rondeau. 2006. Étude d’alternatives d’accès au quota d’œufs de consommation Rapport de recherche, Fédération des producteurs d’œufs de consommation du Québec, 2006 Doyon, M., Simard, V., Messer, K., Tamini, L. et H. Kaiser. 2008. An Experimental Analysis of Modifications to the Centralized Milk Quota Exchange System in Quebec, Canadian Journal of Agricultural Economics, Vol 56, 295-312. Doyon, M., Criner, G. et L. Bragg. Milk Marketing Policy Options for the Dairy Industry in New England. Journal of Dairy Science, vol 91, 2008b: 1229-1235 . Urs Fischbacher 2007: z-Tree: Zurich Toolbox for Ready-made Economic Experiments, Experimental Economics 10(2), 171-178 Kremer, I, and K.G. Nyborg. 2004. Underpricing and Market Power in Uniform Price.” Review of Financial Studies Vol. 17:849-877. Krishna, V. 2002. Auction Theory. Burlington, MA: Academic Press (Elsevier).. 27 .
(30) Smith, V.L. 1962. An Experimental Study of Competitive Market Behavior. Journal of Political Economy Vol 70:111:137. Vossler, C. Mount, T. Thomas, R. and R. Zimmerman. 2009. An Experimental investigation of soft price caps in uniform price auction markets for wholesale electricity. Journal of Regulatory Economics DOI 10.1007/s11149-009-9090-7 Wilson, R., 1979, “Auctions of Shares." Quarterly Journal of Economics, Vol. 93: 675-689.. 28 .
(31)
Figure


+5


Documents relatifs
In this note, we prove that the density of the free additive convolution of two Borel probability measures supported on R whose Cauchy transforms behave well at innity can be
To rule out the above selection confounds, we recruited entire classes (of economics students) at Shenzhen University 6 (SZ), a mid-tier university. There we
In this article we consider the inverse problem of determining the diffusion coefficient of the heat operator in an unbounded guide using a finite number of localized observations..
However when attention is divided at test two contrasting predictions are made: a distinctiveness account predicts an absence of a production effect as a result of the disruption
We have derived the exact and asymptotic distributions of the traded volume, of the lower and upper bound of the clearing prices and of the clearing price range of a basic call
An in-depth study of the 40 fish markets in France (LEN-Corrail 2007) complemented by both a phone survey of 6 auction managers in June 2007 and qualitative
Furthermore, another breakthrough made by Muto ([Mut]) showed that Yau’s conjecture is also true for some families of nonhomogeneous minimal isoparametric hypersurfaces with
L’archive ouverte pluridisciplinaire HAL, est destinée au dépôt et à la diffusion de documents scientifiques de niveau recherche, publiés ou non, émanant des
