O
pen
A
rchive
T
OULOUSE
A
rchive
O
uverte (
OATAO
)
OATAO is an open access repository that collects the work of Toulouse researchers and makes it freely available over the web where possible.This is an author-deposited version published in : http://oatao.univ-toulouse.fr/
Eprints ID : 18786
The contribution was presented at XX : AAMAS 2016
https://sis.smu.edu.sg/aamas2016
To cite this version : Taillandier, Patrick and Banos, Arnaud and Drogoul, Alexis and Gaudou, Benoit and Marilleau, Nicolas and Truong, Chi Quang Simulating Urban Growth with Raster and Vector models: A case study for the city of Can Tho, Vietnam. (2016) In: International conference Autonomous Agents and Multiagent Systems (AAMAS 2016), 9 May 2016 - 10 May 2016 (Singapore, Singapore).
Any correspondence concerning this service should be sent to the repository administrator: [email protected]
Simulating Urban Growth with Raster
and Vector Models: A Case Study
for the City of Can Tho, Vietnam
Patrick Taillandier1(B), Arnaud Banos2, Alexis Drogoul3, Benoit Gaudou4,
Nicolas Marilleau3, and Quang Chi Truong3,5,6
1 UMR IDEES, University of Rouen, Mont-Saint-Aignan, France
2 UMR G´eographie-cit´es, CNRS, Paris, France
3 UMI 209 UMMISCO, IRD Bondy, Bondy, France
[email protected], [email protected]
4 IRIT, University of Toulouse 1 Capitole, Toulouse, France
5 CENRES & DREAM Team, Can Tho University, Can Tho, Vietnam
6 PDIMSC, University Pierre and Marie Curie/IRD, Paris, France
Abstract. Urban growth has been widely studied and many models (in particular Cellular Automata and Agent-Based Models) have been developed. Most of these models rely on two representations of the geo-graphic space: raster and vector. Both representations have their own strengths and drawbacks. The raster models are simpler to implement and require less data, which explains their success and why most of urban growth models are based on this representation. However, they are not adapted to microscopic dynamics such as, for example, the construction of buildings. To reach such goal, a vector-based representation of space is mandatory. However, very few vector models exist, and none of them is easily adaptable to different case studies. In this paper, we propose to use a simple raster model and to adapt it to a vector representation of the geographic space and processes allowing studying urban growth at fine scale. Both models have been validated by a case study concerning the city of Can Tho, Vietnam.
Keywords: Agent-based simulation
·
Urban growth·
Raster model·
Vector model1
Introduction
Being able to control urban growth has become a major challenge for our society. In this context, the possibilities offered by agent-based and cellular automata models to simulate this phenomena, and thus to evaluate possible outcomes of urban planning policies, are particularly interesting. These last years have seen
the development of various urban growth models. If many of them are abstract models aiming at underlying the key factors behind the phenomena, only a few aim at reproducing observed urban growth. Concerning this second type of models, most of them are based on Cellular Automata, or at least on a raster representation of space. This representation, consisting in dividing the space in homogeneous (in terms of internal state) space units, has for advantage to require less data (or at least less precise data) and to be simpler to implement, in particular with the numerous platforms that exist today. However, this type of space representation does not allow simulations at fine scale. Moreover, as it was showed by [11] for segregation models, we state that using a vector (GIS) representation for urban growth models would allow to learn new knowledge.
In this paper, we propose to derive a vector model a model at building scale -from a raster one and to use them to study the urban growth of the Can Tho city in Vietnam. Both models have been implemented using the GAMA platform. GAMA is an open-source modeling and simulation platform for building spatially explicit agent-based simulations [1,14]. It integrates a complete and easy to learn modeling language and supports the definition of large-scale models (up to millions of agents). In addition, it allows a natural integration of GIS data (automatic agentification of data). At last, it integrates some built-in indicators such as the F uzzy−KappaSim [22] enabling to directly evaluate the simulation results.
This paper is organized as follow: Sect.2 presents a state of the art of urban growth models. Section3 is dedicated to the presentation of the case study of Can Tho. Section4 presents the raster model developed and Sect.5 the vector model. Section6 proposes a discussion about the comparison of the two models. At last Sect.7 concludes and proposes some perspectives.
2
State of the Art of Urban Growth Models
Modeling urban growth has been, since the seventies, one of the most docu-mented domains in disciplines like geography [6,7,9], urbanism [16], or urban economy, and transportation [23,24] (see [2] for a comprehensive review), but also in disciplines not directly connected to urban systems but widely concerned with complex systems in general, such as physics [15,18]. However, despite this huge investment, it is still a challenging issue, especially when it comes to coupling processes and patterns at different geographic scales [25], which could require to use different representations of space.
Many of the first urban growth simulation models were based on a raster representation of space, in particular on square and hexagonal grids. Thus, the ’90s have seen the development of many Cellular Automata models such as the ones proposed in [6,10,26].
Even with the multiplication of GIS vector data, this representation of space is still dominant when modeling urban growth. In fact, many recent models still use it (see for instance [17,20,21]). These models cover a large part of the “stylized - particular” axis proposed by [5] to classify models (cf. Fig.1). Indeed, some of these model are very stylized (e.g. [20]), others are based on a lot of
Fig. 1. “Horseshoe” reading template proposed by [5] to classify models in geography.
local pieces of knowledge and are very specific to a case-study such as [3]. In the same way, for the second “axis” “KISS [4] - KIDS [12]”, some models are very simple and integrate very few processes (e.g. [20]) while others, that use the possibilities offered by Agent-Based Modeling, integrate many factors (social, economic, human, etc.) (e.g. [3,17]).
Only very few research works have proposed a vector-based model, in par-ticular at the building scale (explicit representation of building geometries). A notable work is [19] that proposes a general framework to build vector urban growth models. This framework is based on the hierarchical decomposition of space in districts, blocks and geographical objects (roads, buildings, etc.). It provides modelers some built-in measures and indicators to help them to define their own dynamics. However, the use of the framework requires a lot of work to adapt it to a given case-study and requires to write Java code.
Our work aims at filling the lack of simple to use and easily adaptable vector models. In particular, we propose a KISS stylized vector-based model, adapted from a raster model, that can be easily implemented for different case-studies.
The Sects.4and5present respectively the raster model and the vector model.
3
Case Study: The City of Can Tho
3.1 The City of Can Tho
The city of Can Tho is the fourth-largest in Vietnam with 1 200 000 inhabitants and is the largest and fastest growing city in the Mekong Delta.
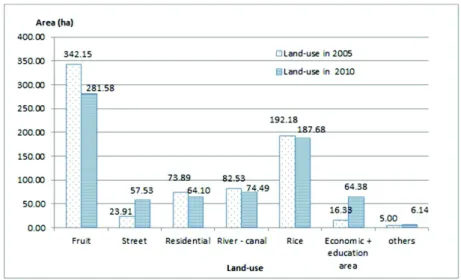
Fig. 2. Evolution of the Land Use between 2005 and 2010 in the An Binh ward. (Source: Generated from the Land Use maps of An Binh ward in 2005 and in 2010)
Fig. 3. Map of the Land Use evolution between 2005 and 2010 in the An Binh ward. (Source: Department of Environmental and Natural resources of Can Tho City, Vietnam)
The urbanization of this city shows a very fast growing in Ninh Kieu district, the central district of Can Tho, the agricultural area of this district are quickly replaced by construction area. An Binh ward is only one example for this process. The chart in Fig.2 shows the rice area of this ward has sharply decreased more than 150 ha while the residential zones, street, economic and education area have increased rapidly. The land-use map in 2005 and in 2010 could explain this shifting (Fig.3).
As many similar cities in developing countries, it has to face a number of economic, social and ecological challenges linked to this fast growth, such as
the colonization of rural and wild-land spaces (and thus the preservation of ecosystems), the social impact (increase of spatial segregation of social groups, spatial fragmentation of labor markets, increase of traffic jams...). But due to its location in the Mekong Delta, it has also to face some specific challenges related to sea level rise (climate change), such as flooding by high tides from the river and canal system in rain season.
It is important to notice that Can Tho being located in the Mekong Delta, it is surrounded by rivers. Inhabitants are located not only along streets but along rivers as they use them for transportation. As a consequence, we have taken into account the importance of rivers in the micro-level vector model. In this model they have the same role as roads.
3.2 The 2020 Local Urban Masterplan of Can Tho City
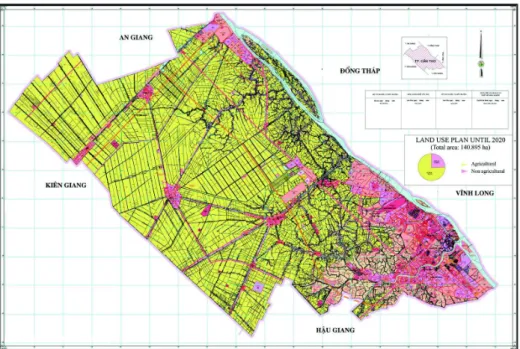
The Can Tho urban spread is mainly driven by a plan (the last one has been drawn until 2020 and is presented in Fig.4). It determines which roads should be built or enlarged. It defines also area that will be dedicated to activity or residential buildings. This plan is used to decide investments that will be made in the city in terms of infrastructures.
The interest of models such as the ones presented in the following is (could be) to give some insights to decision-makers about the impacts and efficiency of their plans. It can in particular often be observed in Vietnam a significant difference between plans and actual results, with the consequence of a waste of resources due to the construction of infrastructures that are not adapted or efficient.
Fig. 4. Plan for Can Tho city in 2020. Red roads will be enlarged and built. Pink and red polygons are planned to become residential buildings. (Color figure online)
3.3 Description of Data
A comprehensive dataset on the evolution of the city shape has been gathered and built by researchers and practitioners.
The dataset contains data at the city level and more precise data for one of the city wards (An Binh ward). This is a ward of the center district (Ninh Kieu) where the urbanisation is very fast:
– Raster map (asc files) of Can Tho in 1999 and 2014 (resolution: 200 × 200 m). Three possible values for each cell have been defined: urban, non urban and river,
– Shapefile of roads of Can Tho in 2010,
– Shapefile of rivers (and canals) of Can Tho in 2010, – Shapefile of the district boundaries of Can Tho,
– Vector land use maps (shapefiles) of An Binh ward (Ninh Kieu district) in 2005 and 2010. One type of land use is defined per vector object: river, road, non urban, rice, perennial tree, aquaculture, economic activity, education, religion, residential1.
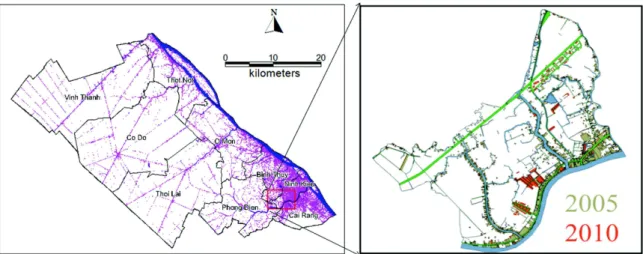
Figure5 shows the dataset. The picture displaying vector data merges shape-files of roads, rivers and buildings.
Fig. 5. Raster data (left) of Can Tho city and vector data (right) of An Binh ward, Ninh Kieu district. (Source: Department of Environmental and Natural resources of Can Tho City, Vietnam)
4
Raster Model
4.1 Model Description
As stated in Sect.2, there are many raster agent-based models. As our goal is to simulate urban growth with minimum local knowledge, we chose to develop
a KISS stylized raster model that requires a small amount of data. Our model was strongly inspired by the model proposed by [20]. This model proposes two dynamics: the construction of buildings and the construction of roads. The road construction dynamics is not adapted to our application context as its goal is more to study the emergence of classic city patterns than to reproduce real city evolutions. We made then the choice not to integrate the road network construction dynamics, and to consider the construction of roads as part of the input scenario.
As an illustration we use the Can Tho city raster map, aiming at simulating urban growth over 15 years from 1999 to 2014 (with a simulation step duration of 1 year).
In this model, the main agents are cells that represent a homogeneous area of space. A cell agent has two attributes:
– is built: is the cell built or not (Boolean value),
– constructability: level of constructability of the cell (float value between 0 and 1): 0 means that it is not interesting at all to build on this cell (i.e. to switch the variable is built to true), 1 that it is very interesting.
We have introduced an additional agent, city center, in order to locate the center of the city, i.e. the place that concentrates the administrative activity. In the Can Tho city, we have located it following expert recommendations. In addition this type of agent gives us more flexibility if we want to apply our model on other cities and in particular in polycentric cities.
4.2 Model Dynamics
The general process of the model is based on two steps: – each cell computes its level of constructability,
– the nb build units cells with the highest level of constructability are built (which induces that the attribute is built is set to true).
The number of cells built at each simulation step, nb build units, is one of the parameters of the simulation.
The level of constructability of a cell depends on 3 criteria:
– CR1: the density of construction in the neighborhood (the highest, the better):
CR1 = nb of built cells in the neighborhood
nb of cells in the neighborhood (1)
– CR2: the euclidean distance to the closest road (the closer, the better):
CR2= 1 − dist to the closest road
– CR3: the distance to the city center using the road network (the closer, the
better):
CR3= 1 −
dist to the city center
max dist to the city center (among all the cells) (3) Note that the original model integrated a fourth criteria: the distance to activity. As we chose to minimize the local knowledge required to make the model works, we do not integrate this criteria in our model.
The level of constructability is the weighted average of these 3 criteria: constructability = w1∗ CR1+ w2∗ CR2+ w3∗ CR3 (4)
The three weights (w1, w2 and w3) are parameters of the model.
4.3 Results
Figure6 illustrates the results of the simulation after 15 steps. It highlights the impact of the three weights and thus of the three processes included in the urban growth model: to this purpose we run experiments with 2 of the 3 weight parameters at 0 and the last one at 1. This gives three different kinds of cities. If only the density criterion is used, the city tends to expand its city center in a homogeneous way. If only the distance to road criterion is used, the construction of buildings reflects the road network. At last, if only the distance to city center criterion is used, the city tends to expand its center following the road network. 4.4 Model Calibration
Finally we looked at the combination of parameters that provides the best simu-lation results, i.e. results that minimize the error compared to real data. In order to compute the error between two raster images (in our case the real and simu-lated results) it is easy to simply compare pixel by pixel (cell by cell in our case) the two images; the error is the rate of different pixels. But we consider that this error computation is too strict in our case. In particular because of the random factor in the selection of the cells that will be built among the one with the best constructability, we cannot get exact results. So, instead of this strict compari-son between maps, we adopt a fuzzy approach and use the F uzzy − KappaSim similarity indicator [22]. It does not compute the similarity of cells two by two, but computes the similarity of a cell (in simulated data) with the corresponding cell in the real data and its neighborhood. If the real and simulated cells are different, but there is a similar cell on the neighbourhood, the similarity will be greater than 0.
Using the batch mode of GAMA to find among all the possible combinations of weight values the ones that maximize the f uzzy − KappaSim indicator we get: w1 = 0.5, w2 = 1.0, w3 = 1.0 and a result of f uzzy − KappaSim = 0.497.
This means that new buildings have to be built along the roads that are close to the city center.
Fig. 6.Results of the raster model in three particular cases: (top) with only the density criterion (w1= 1, w2= 0 and w3= 0); (center) with only the distance to road criterion
(w1 = 0, w2 = 1 and w3 = 0); (bottom) with only the distance to city center criterion
5
Vector Model
This model is similar in essence to the one based on cellular automata but operates at a finer scale and only uses vector GIS data. In particular, the unit of space and of reasoning is no more the arbitrary defined cells but urban blocks [8]. In the urban area, urban blocks are blocks containing buildings and delimited by roads and rivers (which are very important for transportation in the Mekong Delta).
Many types of entities have to be taken into account: buildings, roads, rivers, urban blocks. In this model, we chose to represent all them as agents, even when they do not have any dynamic. This choice helps to simplify the interaction process between them and to simplify the description of the model. In our model, simulating urban growth will thus consist in creating new building agents and locating them appropriately.
As an illustration we use the An Binh ward of the Can Tho city, aiming at simulating urban growth over 5 years from 2005 to 2010 (with a simulation step duration of 6 months). The data that will be used are the shapefiles of rivers, roads and land-use of the ward in 2005 to initialize the model. The land-use shapefile in 2010 is used to calibrate the model. Among the land-use shape-file entities, only urban-related ones (i.e. all residential, religion and economic buildings) are used in the model.
5.1 Hypotheses (Based on [20])
We consider that urban blocks (cf. Fig.7) can be isolated within the ward. An urban block is defined as an urban space delimited by cycling streets or rivers [8]. Each urban block is composed of a set of buildings. Each building has its own function (Residential, Commercial, Education or Religion).
New residential buildings are created following 3 rules: – They tend to be created in blocks with a lot of empty space.
– They tend to be located in blocks not too far away from “services” (non-residential buildings).
– They tend to be located in well-connected blocks (close to roads and rivers). 5.2 Model Description
In this model and due to the capacities of the modeling and simulation platform chosen (GAMA, version 1.6.1) in terms of agentification of GIS data, the model contains agents representing rivers, roads and buildings. These agents are created directly from Can Tho GIS data. They are all characterized by their shapeand location. In addition buildings have a type attribute taken its value among residential, commercial, religion and education. The last three types of buildings are considered as services.
Finally the model also contains urban blocks agents. They are created at the initialization of the model from the existing data. In addition to its shape and location attributes, it contains also the attributes:
– buildings (resp. roads and rivers): it contains the set of building (resp. road and river) agents included in this urban block,
– constructability: this numerical attribute contains the constructability value of the urban block.
5.3 Model Dynamics
The dynamics of the model follows a 2-step process, repeated at every simulation step:
1. The constructability of each urban block is computed,
2. The nb build units urban blocks with the highest constructability create nb new buildings buildings inside them.
Both steps base their computations on the intensive use of geometrical operations (computation of distances (using road network), intersections, extrusions, etc.). nb build units and nb new buildings are two parameters of the simulation. Step 1 - Evaluation of Urban Blocks Constructability. The aim of this first step is to give a mark to each urban block in order to rank them and deter-mine which ones should be constructed first. So for each urban block with enough remaining space to construct a building, we evaluate it given the 3 following cri-teria: (CV1) its density of empty space, (CV2) the quantity of transportation
(roads and rivers) inside and around it and (CV3) its distance to services. The
constructability index of each urban block is simply the weighted sum of these three criteria:
with w1, w2 and w3 the weights associated to each criterion; they are considered
as parameters of the simulation. They represent the importance of each of these three attractivenesses (by density, services and transportation) on new buildings. The calibration process will thus aim at finding the weight values for which the simulation results fit the best with real data.
For each urban block, at each simulation step, the three criteria are computed as follows:
– CV1 is the density of free space, i.e. the rate of free space in the urban block:
CV1=
area of free space area of the urban block
– CV2 is the total area of transportation (roads and rivers) inside and around
(at a distance of 1 m) the urban block compared to the area of the urban block:
CV2 =
area of roads & rivers within a 1 m distance from the urban block area of the urban block
– CV3 is the distance of the urban block to services. We consider here as
ser-vices the educational, religious and commercial buildings. CV3thus depends on
the distance to the closest educational building (deducational building), religious
building (dreligious building) and commercial building (dcommercial building).
It is normalized by the maximum possible distance in the environment (max distance):
CV3 = 1 −
deducational building+ dreligious building+ dcommercial building
3 ∗ max distance
Step 2 - Selection of the nb build units Urban Blocks with the High-est Constructability and Creation of nb new buildings Buildings Inside Each. Once each urban block has computed its own constructability, the nb build units urban blocks with the higher constructability are chosen and nb new buildings new buildings are created on them.
To simplify the model, we chose not to create new building shapes. When creating a new building we simply copy the shape of an already existing build-ing. We consider it is a good compromise between the creation of very simple rectangular buildings and of buildings with a random (and thus perhaps not realistic) shape.
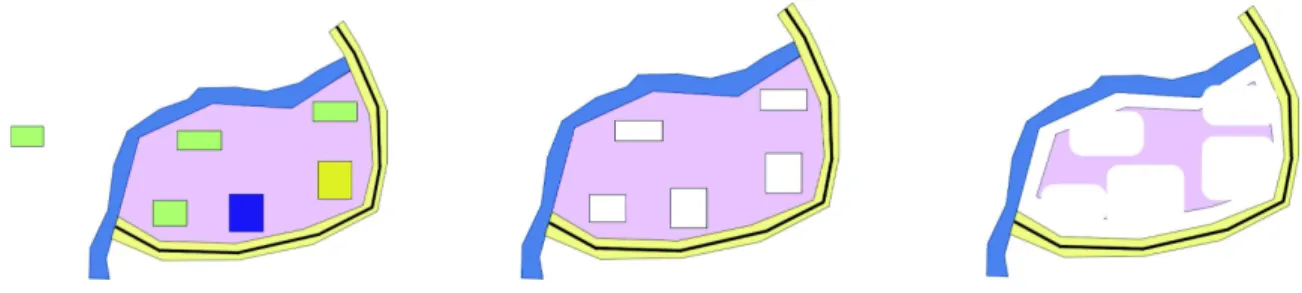
In each chosen urban block, a new building is created following the 4 steps (cf. Fig.8):
1. Choose an existing building in the block or in a neighboring one if none is available,
2. Extrude the shape of its buildings from the block geometry,
3. Erode the resulting shape by the maximum dimension of the chosen building, 4. If the resulting geometry is not empty, choose a random location inside it, create a building at this location (with the shape of the chosen building) and proceed similarly for the next building.
Fig. 8. Steps of the selection of possible locations for a new building. The remaining pink geometry in the right picture represents these possible locations. (Color figure online)
5.4 Results
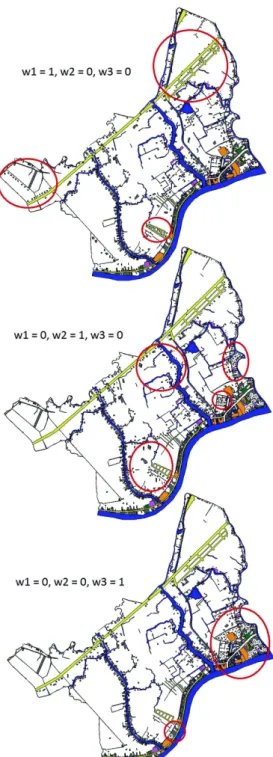
The Fig.9 shows preliminary results by considering separately the impact of each criterion. It highlights the impact of the three weights and thus of the three processes included in the urban growth model: to this purpose we run experiments with 2 of the 3 weight parameters at 0 and the last one at 1.
As expected, we get three very different locations for new buildings. If only the density criterion is used, new buildings are created in the empty urban blocks. If only the transportation criterion is used, new buildings are created in area with lot of roads and rivers around. Finally if only the activity criterion is used, new buildings are concentrated in the city center (and a few to another block with several activities).
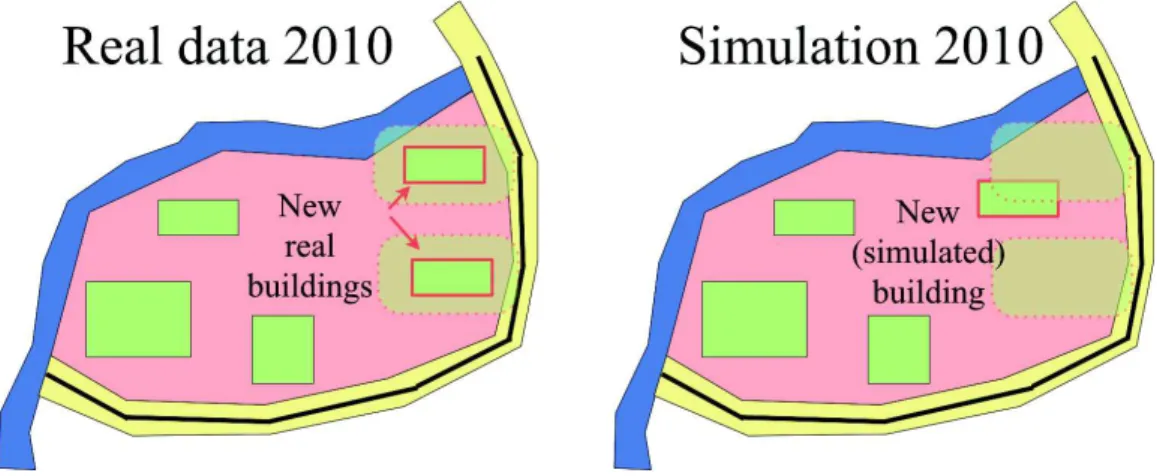
5.5 Calibration and Validation of the Models on Can Tho Data The calibration will be the minimization of the distance (i.e. the error) between the simulation results and the data. Contrarily to the raster model where it is easy to compute the error cell by cell, in the vector model we cannot use this grid discretization. As a consequence, the error is computed as the rate of new real buildings that are not intersected (with a given buffer) by buildings obtained by simulation, weighted by their area. As an example in the Fig.10, the error between real data and simulated data (in 2010) is 0.5. This way of computing error is very close in essence to the fuzzy indicator used in the raster model.
After calibration, the best weights we get are: w1 = 0.2, w2 = 1.0 and
w3 = 0.0. The lowest error we get is error = 0.288. This means that most of new buildings are in urban blocks with a high density of free space and surrounded by many roads and rivers. This also shows that in the best combination the third criteria (related to the distance to services) does not seem to have an impact.
Fig. 9.Results of the vector model in three particular cases: (top) with only the density criterion (w1= 1, w2 = 0 and w3= 0); (center) with only the quantity of transportation
criterion (w1 = 0, w2 = 1 and w3 = 0); (bottom) with only the distance to services
criterion (w1 = 0, w2 = 0 and w3 = 1). Red circles highlight the location of new
buildings. Education buildings are in green, religion ones in violet, commercial in orange and residential in gray. (Color figure online)
Fig. 10. Computation of the distance between real and simulated data. In this case the distance is 0.5.
6
Comparison and Discussion
The two models are based on the same general process: at each simulation step, the choice of a certain number of cells/blocks to build/densify. However, the difference in space representation has a deep impact on the questions the model can answer.
The raster model has for major advantage to require less data: only landsat data and a shapefile of roads were used in our case study. In addition, the time consumption of the model can be easily controlled through the resolution of the grid. These advantages make it particularly interesting for application context when the data are scare (which was typically the case for the city of Can Tho) and when the city is composed of many buildings.
The vector model requires not only to have a shapefile of roads, but also a shapefile of buildings (eventually with the function of each building). This model allows to simulate with details where buildings are going to be built. It allows as well to precise the function of each new building.
Concerning the comparison of the computational cost of the two models, we carried out an experiment in which we ran the previously presented models for 50 simulation steps on respectively the complete city of Can Tho for the raster model (335 × 222 cells with a size of 200 m × 200 m) and the An Binh ward (1037 buildings and 93 urban blocks) for the vector model. The experiment was carried out on an old Macbook computer (early 2011). The average step duration without considering the initialization stage (computation of the distances to roads and to city centers) for the raster model was 1.9 s and 2.4 s for the vector one. These results show that the computation cost is acceptable for both models. Of course, running the vector on the complete city of Can Tho will have increased a lot the computation time, as well as the use of a finer grid (with for example cells with a size of 20 m × 20 m that is the average size of buildings in Can Tho). This experiment shows that the raster model is well adapted to be used as city level with a low granularity grid, whereas the vector model is more adapted to be used at ward level.
Concerning this scale level, it is interesting to note that the density criterion is used in an opposite way in the two models: in the raster model the chosen cells are the densest ones, whereas the chosen urban blocks are the less dense ones. We can observe here different forces at different scales. At the city level, there is an attractiveness of the denser area to build the city. But at the ward level, inhabitants prefer to have more free space to build their buildings.
The two models are complementary. An interesting work could be to couple these models in order to be able to use the raster model for the parts of the city where we do not need precise details on building construction, and the vector model for the other parts. Such hybrid model could have for benefits to require less data and be less time consuming than the use of the vector model on the complete city.
7
Conclusion
In this paper, we have presented two complementary KISS urban growth models: a model based on a raster representation at city-scale and a vector one at ward-scale. As discussed in Sect.6, the two models have their own advantages and drawbacks. The raster model requires less data and can be less time-consuming if the resolution of the grid is not too high. It is well-adapted to simulate urban growth at city scale. In contrary, the vector model allows studying the urban growth at fine scale and simulating the construction of buildings - and thus to answer new questions. This model is well-adapted to simulate the urban growth at district-scale.
Both models have their advantages and drawbacks. They also make sense at different scales: fine scales for the vector-based model, more global ones for the raster-based one. However, coupling these two models within an integrated multi-scale approach is definitely a challenge the research team seeks to address in the next future.
In order to validate the genericity of our two models (and the hybrid one), we plan to test them on other cities.
We plan as well to improve the vector model by adding new criteria in the choice of the urban blocks to densify. In particular, we could add the criterion proposed by [20] concerning the accessibility of the urban blocks toward different activities. Another possible improvement could consist in using a more robust multi-criteria decision-making method to sort the cells/urban blocks. A possi-bility could be to use the Choquet integral to compute the constructapossi-bility [13] that allows to take into account the redundancy and synergy between criteria.
Acknowledgements. This work was part of and supported by the Tam Dao Summer School in Social Sciences (JTD) – http://www.tamdaoconf.com/.
References
1. GAMA website (2015). http://gama-platform.org
2. Acheampong, R.A., Silva, E.: Land use-transport interaction modeling: a review of the literature and future research directions. J. Transp. Land Use 8(3), 1–28 (2015)
3. Arsanjani, J.J., Helbich, M., de Noronha Vaz, E.: Spatiotemporal simulation ofur-ban growth patterns using agent-based modeling: the case of Tehran. Cities 32, 33–42 (2013)
4. Axelrod, R.M.: The Complexity of Cooperation: Agent-Based Models of Compe-tition and Collaboration. Princeton University Press, Princeton (1997)
5. Banos, A., Sanders, L.: Mod´eliser et simuler les syst`emes spatiaux en g´eographie. Mod´eliser et Simuler-Epist´emologies et Pratiques des Mod`eles et des Simulations, Ebook des ´editions Mat´eriologiques, vol. 1, pp. 833–863 (2013)
6. Batty, M., Xie, Y., Sun, Z.: Modeling urban dynamics through GIS-based cellular automata. Comput. Environ. Urban Syst. 23(3), 205–233 (1999)
7. Benenson, I.: Multi-agent simulations of residential dynamics in the city. Comput. Environ. Urban Syst. 22(1), 25–42 (1998)
8. Boffet, A., Coquerel, C.: Urban classification for generalisation orchestration. In: 19th International Symposium of Photogrammetry and Remote Sensing (ISPRS 2000), Amsterdam, pp. 16–23, July 2000
9. Caruso, G., Vuidel, G., Cavailh`es, J., Frankhauser, P., Peeters, D., Thomas, I.: Morphological similarities between DBM and a microeconomic model of sprawl. J. Geogr. Syst. 13(1), 31–48 (2011)
10. Clarke, K., Hoppen, S., Gaydos, L.: A self-modifying cellular automaton model of historical. Environ. Plan. B 24, 247–261 (1997)
11. Crooks, A.T.: Constructing and implementing an agent-based model of residential segregation through vector GIS. Int. J. Geogr. Inf. Sci. 24(5), 661–675 (2010) 12. Edmonds, B., Moss, S.: From KISS to KIDS – an ‘anti-simplistic’ modelling
approach. In: Davidsson, P., Logan, B., Takadama, K. (eds.) MABS 2004. LNCS (LNAI), vol. 3415, pp. 130–144. Springer, Heidelberg (2005). doi:10.1007/ 978-3-540-32243-6 11
13. Grabisch, M., Labreuche, C.: A decade of application of the Choquet and Sugeno integrals in multi-criteria decision aid. Ann. Oper. Res. 175(1), 247–286 (2010) 14. Grignard, A., Taillandier, P., Gaudou, B., Vo, D.A., Huynh, N.Q., Drogoul, A.:
GAMA 1.6: advancing the art of complex agent-based modeling and simulation. In: Boella, G., Elkind, E., Savarimuthu, B.T.R., Dignum, F., Purvis, M.K. (eds.) PRIMA 2013. LNCS (LNAI), vol. 8291, pp. 117–131. Springer, Heidelberg (2013). doi:10.1007/978-3-642-44927-7 9
15. Haken, H., Portugali, J.: The face of the city is its information. J. Environ. Psychol. 23(4), 385–408 (2003)
16. Hillier, B., Leaman, A., Stansall, P., Bedford, M.: Space syntax. Environ. Plan. B Plan. Des. 3(2), 147–185 (1976)
17. Liu, Y., Feng, Y.: A logistic based cellular automata model for continuous urban growth simulation: a case study of the Gold Coast City, Australia. In: Heppenstall, A.J., Crooks, A.T., See, L.M., Batty, M. (eds.) Agent-Based Models of Geograph-ical Systems, pp. 643–662. Springer, The Netherlands (2012)
18. Louf, R., Barthelemy, M.: Modeling the polycentric transition of cities. Phys. Rev. Lett. 111(19), 198702 (2013)
19. Perret, J., Curie, F., Gaffuri, J., Ruas, A.: A Multi-agent system for the simulation of urban dynamics. In: 10th European Conference on Complex Systems (ECCS 2010), Lisbon (2010)
20. Raimbault, J., Banos, A., Doursat, R.: A hybrid network/grid model of urban morphogenesis and optimization. In: Aziz-Alaoui, M.A., Bertelle, C., Liu, X.Z., Olivier, D. (eds.) Proceedings of the 4th International Conference on Complex Systems and Applications (ICCSA 2014), pp. 51–60, June 2014
21. Torrens, P.M.: Simulating sprawl. Ann. Assoc. Am. Geogr. 96(2), 248–275 (2006) 22. van Vliet, J., Hagen-Zanker, A., Hurkens, J., van Delden, H.: A fuzzy set approach to assess the predictive accuracy of land use simulations. Ecol. Model. 261, 32–42 (2013)
23. Waddell, P.: Urbansim: modeling urban development for land use, transportation, and environmental planning. J. Am. Plan. Assoc. 68(3), 297–314 (2002)
24. Wegener, M.: Overview of land-use transport models. In: Handbook of Transport Geography and Spatial Systems, vol. 5, pp. 127–146. Pergamon/Elsevier Science, Kidlington (2004)
25. White, R.: Modeling multi-scale processes in a cellular automata framework. In: Portugali, J. (ed.) Complex Artificial Environments, pp. 165–177. Springer, Heidelberg (2006)
26. White, R., Engelen, G.: Cellular automata and fractal urban form: a cellular mod-elling approach to the evolution of urban land-use patterns. Environ. Plan. A 25(8), 1175–1199 (1993)
![Fig. 1. “Horseshoe” reading template proposed by [5] to classify models in geography.](https://thumb-eu.123doks.com/thumbv2/123doknet/3163817.90220/4.892.201.664.102.496/fig-horseshoe-reading-template-proposed-classify-models-geography.webp)