2016/2017
يملعلا ثح لا يلاعلا ميلعتلا را
MINISTERY OF HIGHER EDUCATION AND SCIENTIFIC RESEARCH راتخم يجاب عماج
- بانع
BADJI MOKHTAR UNIVERSITY – ANNABA
FACULTY OF SCIENCES DEPARTMENT OF BIOLOGY
THESIS SUBMITTED TO OBTAIN A 3rd CYCLE LMD DOCTORATE
DEGREE IN ANIMAL BIOLOGY
OPTION:NEUROSCIENCE
TITLE
Presented by: Miss
MATALLAH Ahlem
Jury Members:
Mr TAHRAOUI Abdelkrim Pr Chairman University of Annaba
Mr BAIRI Abdelmadjid Pr Supervisor University of Annaba
Mr ACHOU Mohamed Pr Examiner University of Annaba
Mm TADJINE Aïcha Pr Examiner University of El Tarf
Mr SOUIDI Maȃmar Mc Examiner IRSN Fontenay-aux-
IMPACT OF BIOACTIVE MOLECULES ON
ADAPTIVE, BEHAVIORAL AND IMMUNE
RESPONSES IN WISTAR RAT
Roses Paris-France
In January, I got one of the biggest opportunity of my life
’ PhD! Perseverance and
determination were absolutely needed to reach the end of that phase.
Firstly, I thank God for always being in front of me to drive me in the right directions,
besides me to support me and behind me to protect me! I have always needed You.
I would like to acknowledge my dedicated dissertation committee. Deep appreciation goes out to
my advisor, BAIRI Abd el-madjid, for teaching me that sometimes is needed to move one step
back in order to move to steps on! His laid-back style and unworldly flexibility throughout this
project.
I am grateful to Professor
TAHRAOUI Abdelkrim
for being the chairman of my thesis. My
gratitude and profound respect are expressed to him.
I would thank Professor
ACHOU Mohamed
for agreeing to participate in my thesis editorial
board. My sincere thanks and deepest respect for him.
Thanks are given to Professor
TADJINE Aïcha
for being an examiner in my thesis. My
sincere appreciation.
I also want to thank Doctor
SOUIDI Maamar
for the valuable contribution on my thesis as an
editorial board.
My sincere appreciation.
I wish to express my sincere thanks to Professor TAHAR Ali for his guidance from the beginning
of my PhD studies
and insightful feedback regarding statistical analyses. And to trusting on my
potential as researcher.
My very deepest gratitude to several closes friends. It was a pleasure to meet you but also to
share some special moments and I will always cherish them.
During my PhD, I also had the honored and pleasured to meet with some excellent people who
truly committed a significant amount of time and brain-power to helping me. Your immense
patience, the genuine respect and for providing me with a sound foundation on which faither in
good in all times and places. I thank from the bottom of my heart all of you above who supported
me in what was an exceptionally tough time and I will be always grateful to your friendship.
I a
y a
y
” Wa ” from Canada. If it was not you, I could not started my
project research but you promised me and sensed me the product "Harmine" at a time of no
person could delivery. Thank you for your trust and support.
Finally, I thank my family, my brother and sisters, who taught me that all things are possible
with faith in God, you have always been there for me, especially my parents who made sure that
I did not feel alone, for never letting me down. Who took an activity interest in all aspects of my
work and took care of all my needs during my graduate education. Without them, this would
have not been possible. MOM, DAD, your support is unbelievable.
…
…
For My beloved, Parents & Grandparents. If it were not for you, i would
never have made it this far.
ABSTRACT
This study aims at evaluating the behavioral and physiological effects of chronic administration of β-carboline Harmine and Amitriptyline in rats exposed to CMS procedure. After 30 days of exposure to CMS procedure, rats were treated with Harmine (15 mg/kg/day, ip.) or Amitriptyline (20 mg/kg/day, ip.) for 7 days. Afterwards, rats were tested with a battery of behavioral tests: Annedonia, Open Field (OF), Elevated plus Maze (EPM) and Light and Dark Box (LDB).
The findings demonstrate that CMS shows behavioral changes during the different tests; a decrease in the consumption of sweet solutions compared with the control group.
Concerning the data of the effects of CMS in the EPM test, CMS rats demonstrated a decrease in the number of entries and the time spent in the open arms compared to non-stressed rats. On the other hand the results show no significant differences on the number of entries and the time spent in closed arms on CMS rats compared with the control rats.
However, in the OF parameters, we notice a decrease of the time spent in the field center, a decrease of grooming time, without affecting defecation, crossing and rearing activity in the stressed group compared with the control group.
The data of the CMS effects on the LDB parameters show a decrease in the number of entries and the time spent in the light compartment compared with the control group.
Regarding the physiological parameters; the results reveal an increase of ACTH level compared with the control group. Moreover, CMS alters the immunological parameters by increasing of IgG, without affecting IgM circulating levels.
The results demonstrate also how that CMS induces a decrease in brain weight and hypertrophy of adrenal gland.
The chronic treatment with Harmine or Amitriptyline for 1 week reverse anhedonia, OF, EPM and LDB behaviors, brain and adrenal gland weights, normalized ACTH and immunoglobulin G (IgG) circulating levels .
In conclusion, treatment with Harmine or Amitriptyline has robust effects in reverting mainly physiological alterations reliable as indicators of animal depressive disorders.
Keywords:
RESUME
La présente étude vise à évaluer les effets comportementaux et physiologiques de l'administration chronique d’Harmine β-carboline et d’Amitriptyline chez des rats exposés à la procédure de CMS.
Après 30 jours d'exposition au stress chronique modéré (CMS), les rats ont traités avec l’Harmine (15mg/ kg/ j, ip.) ou l’Amitriptyline (20mg/kg/j, ip.) pendant 7 jours. Ensuite, les rats ont été soumis à une série de tests comportementaux: solutions sucrées, Open Field (OF), labyrinthe en croix surélevé (EPM) et la Boite claire obscure (LDB).
Les résultats ont montré que le CMS induit des changements comportementaux au cours des différents tests; une diminution de la consommation des solutions sucrées par rapport au groupe témoin.
Les résultats montrent également les effets du CMS sur les paramètres d’EPM; les rats stressés ont montré une diminution du nombre d'entrées et du temps passé dans les bras ouverts par rapport à des rats non stressés. Bien qu’aucune différence significative n'a été détectée chez les rats stressés par rapport aux rats témoins sur le nombre d'entrées et le temps passé dans les bras fermés.
En outre, dans le champ ouvert, nous avons constaté une diminution du temps passé dans le centre du champ, la diminution du temps de toilettage, sans affecter la défécation, l'activité locomotrice et l’escalade dans les groupes stressés par rapport au groupe témoin.
Les résultats montrent également les effets du CMS sur les paramètres de LDB. Nous avons constaté une diminution du nombre d’entrées et du temps passé dans la boite claire par rapport au groupe témoin.
En ce qui concerne les paramètres physiologiques; les résultats d'augmentation du niveau de l’hormone ACTH sont affiché par rapport au groupe témoin. Pour les paramètres immunologiques, les résultats ont révélé que le CMS a induit une augmentation d 'IgG, sans affecter les taux circulants d'IgM.
Les résultats ont montré que le CMS a induit une diminution du poids du cerveau et une augmentation du poids de la glande surrénale.
Le traitement chronique avec l’Harmine et l’Amitriptyline pour 1 semaine a inversé les comportements anhédoniques, EPM, OPF et LDB, Le poids du cerveau et des glandes
surrénales. La normalisation des taux circulants d'hormone ACTH et aussi des taux circulants de l'immunoglobuline IgG .
Les traitements avec l'Harmine et l’Amitriptyline ont des effets puissants en revenant des altérations physiologiques qui sont principalement des indicateurs fiables des troubles dépressifs des animaux.
Mots clés :
صخلملا
س ث س ف ح س أ إ . 30 ء إ إ ، ح ) 15 /غ /غ , ( أ ) 20 /غ /غ , ( 7 أ خ ، . ) ، ح ح خ س خا EPM ) ح ف ضإ ( OF ء ص ( ) ا LDB ( . أ ص ئ إ خ ء اخ س غ أ . ش س ح ا س س ف أ ف ف ئ أ ف ، خ س ئ ح ا ف حا . غ ح ا ص ف ش ا ف . غ ح س أ ف ض ، س ف ف ض حا ف ، ح ش ث أ ف . ش ف أ ف ض حا ، ا ء ص خا ئ حإ اخ . ش ح ف ف ئ أ ، س ش ف ش ّ س (ACTH) . ش ئ أ س أ إ س غ س ف G ث أ غ س M أ ئ . إ خ ف س غ . س ح أ س س ف (EPM) : ) OF ( ) LDB ،( ا خ غ . غ ف ضإ ش ّ س G . ش ف أ س ح ثأ أ ف ص خ ا ح ف ش س . ح ا ضا ث يحاتفملا املكلا : إ ، أ ، ح ، غ ، س غ ، ش ّ G غ ، M . ا ،N° Title page
1 Rat housing conditions. 07
2 Chemical structure of the Harmine (7-methoxy-1-methyl-9H-pyrido [3, 4-b] indole).
07
3 Chemical structure of Amitriptyline [3-(10, ll-dihydro-5H-dibenzol [a,d] cyclohept-5-ylidene) propyldimethylamine]
08
4 Drug was administered intraperitoneally at (1 mg/kg/day) on each rat. 09
5 Elevated plus-maze test (EPM). 13
6 Open Field Test. 14
7 Light dark box test 15
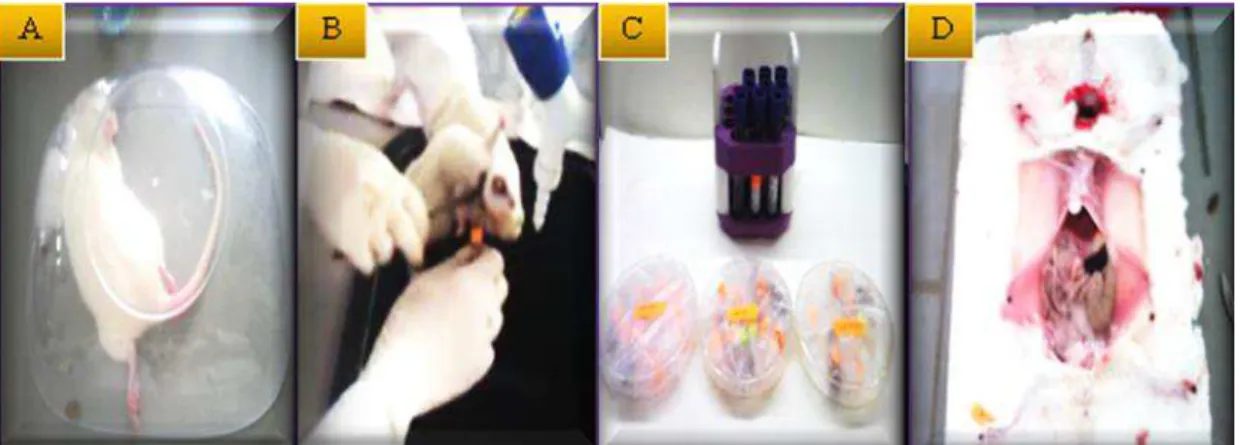
8 Photographs illustrating (A) Anesthesia; (B) Blood collection; (C) Dissection; (D) Organs removed.
16
9 Photographs illustrating the removed organs (A) Brain; (B) Thymus; (C) liver; (D) Heart; (E) Adrenal gland.
17
10 Schematic representation of the experimental protocol; CMS procedure and treatments using Harmine or Amitriptyline.
23
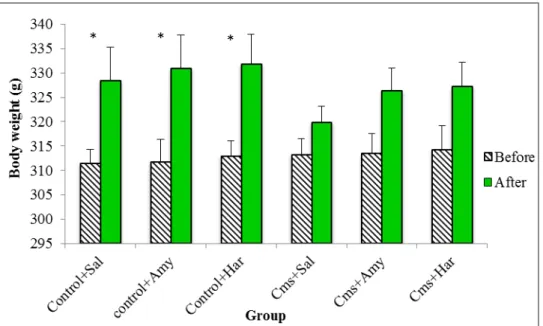
11 Effects of CMS procedure on body weight of rats repeatedly treated with Harmine (Har; 15 mg/kg i.p.) and Amitriptyline (Amy; 20 mg/kg i.p.) on body weight gain in rats. 30 days of CMS were followed by 1 week of drug treatment. Bars represent means ± SEM (n꞊10 per group). Ns: No significant difference p >0, 05 vs. control saline, according to the Student t-test for paired data.
24
12 Effects of CMS procedure on the relative weight of (A) the brain, (B) adrenal gland, (C) thymus, (D) liver and (E) heart in rats repeatedly treated with Harmine (Har; 15 mg/kg, i.p.) and Amitriptyline (Amy; 20 mg/kg, i.p.).Bars represent means±S.E.M. Ns: No significant difference p >0, 05.**p<0 .01 vs. control saline; #p < 0.05 vs. CSM saline, according to ANOVA post hoc Tukey’s test.
,i.p.) on 1% sucrose consumption in rats. 30 days of CMS was followed by 7 day of drug treatment. Bars represent means ±SEM (n = 10). *p< 0.05 vs. control saline; #p < 0.05 vs. CSM saline, according to ANOVA post hoc Tukey’s test.
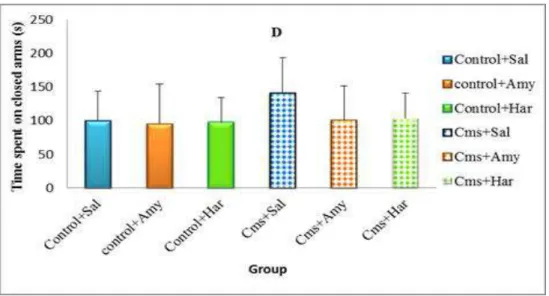
14 Effects of CMS procedure on the number of entries into the open arms (A) the time spent in the open arms (B) the number of entries into the closed arms (C) and the time spent in the closed arms (D) in the elevated plus maze test in rats repeatedly treated with Harmine (Har; 15 mg/kg, i.p.) and Amitriptyline (Amy; 20 mg/kg, i.p.). Bars represent means± SEM (n = 10). Ns: No significant difference p >0, 05,* p<0, 05, ** p<0, 01 vs. control saline; # p<0.05, ## p<0.01 vs. CMS saline, according to ANOVA post-hoc Tukey test.
30
15 Effects of CMS procedure on emotional rat behaviors repeatedly treated with Harmine (15 mg/kg, i.p.) and Amitriptyline (20 mg/kg, i.p.) in the open-field on test. (A) the time spent in the central zone;(B) the time spent in the peripheral zone; (C) crossings number; (D) rearings number; (E) rearings time (F) grooming time; (G) defecation . Bars represent means ± SEM, (n꞊10). Ns: No significant difference p >0, 05,*P<0.05, **P<0.01 vs. control saline; #P<0.05 vs. CMS saline, according to ANOVA post-hoc Tukey test.
33
16 Effects of the chronic administration of Harmine (15 mg/kg, i.p.) and Amitriptyline (20 mg/kg, i.p.) on (A) the number of entries in light compartment and (B) the time spent in light area (sec) in rats subjected to the Light Dark Box test .Bars represent means ± SEM (n =10).* P <0.05 vs. control saline; # P<0.01 vs. CMS saline, according to ANOVA post hoc Tukey’s test.
34
17 Effects of CSM procedure on adrenocorticotropic hormone (ACTH) circulating levels in rats repeatedly treated with Harmine (15 mg/kg, i.p.) and Amitriptyline (20mg/kg, i.p.). Bars represent means ±SEM. (n =10). ** P <0.01 vs. control saline; # P<0.05 vs. CMS saline, according to ANOVA post hoc Tukey’s test.
35
18 Effects of CSM procedure on immunoglobulin’s (A) IgG, (B) IgM levels in rats repeatedly treated with Harmine (15mg/kg, i.p.) and Amitriptyline (20 mg/kg, i.p.). Bars represent means ±SEM. (n =10).*P <0.05 vs. control saline; # P<0.05 vs. CMS saline, according to ANOVA post hoc Tukey’s test.
a role in an individual’s tolerance for stress. When an individual perceives a stimulus as stressful a physiological and behavioral response will be displayed
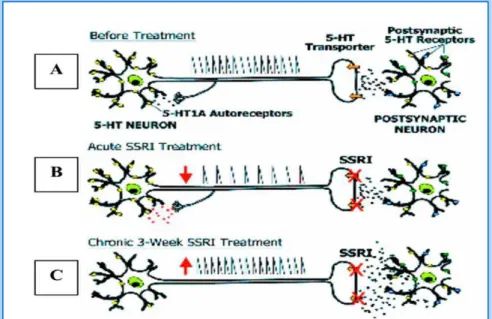
20 Schematic representation of serotonergic neuron (A) before treatment, (B) in the acute treatment with an SSRI (inhibition of neuronal firing due to the activation of 5-HT1A autoreceptor) and (C) in chronic treatment (desensitization of 5-HT1A autoreceptor / 1B / 1D).
44
21 The HPA Axis and Stress Response System 47
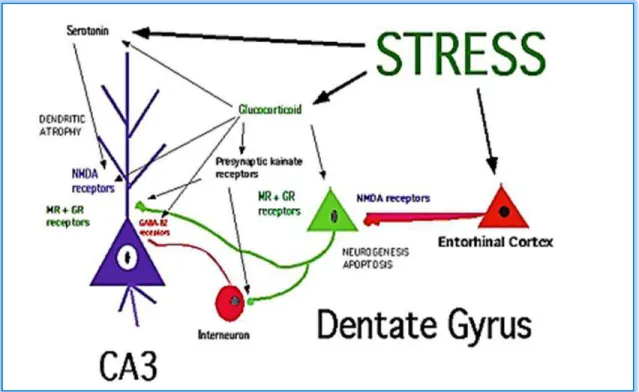
22 Shematic diagramme of the role of neurotransmitters and glycocorticoides in regulation neurogenesis and dendritic remodeling in the dentate gyrus-CA3 system of the hippocampal formation
48
23 The interface of the immune and central nervous systems. Peripheral immune cells and signals reach the CNS via two primary routes: the neural pathway and the humoral pathway.
N° Title page 1 The protocol and stress procedures for chronic mild stress 10
2 The characteristics of the multiple comparison methods 21
LIST OF ABBREVIATIONS
ACTH : Corticotropin (Adreno-Cortico-Tropic Hormone)
ANOVA AVP BDNF β-CA Bw CAM CMS CNS : Analysis of variance : Arginine-Vasopressin : Brain-Derived-neurotrophic Factor : β –carboline : Body Weight
: Complementary Alternative Medicine : Chronic Mild Stress
: Central Nervous System
CRH : Corticotrophin Releasing Hormone
DHEA DYRK1A
: Dehydroepiandrosterone
: Dual specificity tyrosine-phosphorylation-regulated kinase 1A EDTA EPM EU-phytomedicines FST G GnRH 5-HT HLL HML HMR HPA IgG IgM IL-1β IL-6 IMAO LC/NE LDB
: Ethylene Diamine-Tetraacetic Acid- : Elevated Plus -Maze
:European phytomedicines : Forced swim test
: Group : Gonadotropin-releasing hormone : 5-hydroxytryptamineserotonin : Tetrahydroharmine : Harmine : Harmaline
:Hypothalamic–pituitary–adrenal axis : Immunoglobuline G
: Immunoglobuline M : Interleukin -1β :Interleukin 6
: Monoamine oxidase inhibitors : Locus Coeruleus Norepinephrine : Light Dark Box
mg/ml/Kg NA NHPs NMDA NO OF P PVN SOD SSRIs TNF-a x
: milligramme per millilitre per kilogramme : Noradrenaline
: Natural Health Products : N-methyl-D-aspartate Nit : Nitric oxide
: Open Field : Probability value : Paraventricular Nucleus : Superoxide Dismutase
: Selective Serotonin-Reuptake Inhibitors : Tumor Necrosis Factor
:Mean
INTRODUCTION 01
2. MATERIALS AND METHODS 06
2.1. Animals and housing 06
2.2. Drug and treatment 07
2.3. Experimental protocol 09
2.4. Behavioral assessment 11
2.4.1. Sucrose preference test 11
2.4.2. Elevated plus maze (EPM) 12
2.4.3. Open field test (OFT) 13
2.4.4. Light dark box test 14
2.5. Methods 15
2.5.1. Body weight 15
2.5.2. Blood analysis 15
2.5.3. Organ weight 16
2.5.4. ACTH, IgG and IgM assays 17
2.5.4.1. Measurement of plasma ACTH level 17
2.5.4.1.1. Assay procedure 17
2.5.4.2 Quantitative determination of IgG and IgM 18
2.5.4.2.1 IgG Assay procedure 18
2.5.4.2.1 IgM Assay procedure 19
2.5.5. Statistical analysis 19
2.5.5.1 The multiple comparison method 20
2.5.5.1.1. Tukey's method 20
2.5.5. 2. Sample t-test or student T test 21
2.5.5. 3. Paired T-Test 21
3. RESULTS 24
3.1. Body weight gain 24
3.2. Variation of organs weight 24
3.3. Behavioral assessment 27
3.3.1. Sucrose preference test 27
3.3.4. Anxiolytic activity in light dark box (LDB) test 33
3.5 Variation of hormonal parameters 34
3.5.1 ACTH plasma level 34
3.5.β Immunoglobulin’s Level 35 4. DISCUSSION 37 5. CONCLUSION 52 6. PERSPECTIVES 53 7. REFERENCES 54 ANNEX
1 1. INTRODUCTION
Humans have been created with a complex range of metabolic machinery intended to maintain normal homeostasis. This physiologic state of balance is susceptible to various perturbations by intrinsic and extrinsic events, whether actual or perceived (Guilliams & Edwards, 2010). The term “stress” has been coined to describe a “state of threatened homeostasis or disharmony” that must then be counteracted by an “adaptive stress response,” a complex array of physiologic and behavioral responses intended to re-establish homeostasis.(Kirschbaum & Hellham, 1994). Stress may be acute (single or short exposure to stress) or chronic (long-term exposure to stress) (Nagaraja & Jeganathan, 1999).
Chronic stress may cause depression (Sakakibara et al., 2005). It has become the most prevalent psychiatric disorder and imposes a substantial societal burden (Lépine & Briley, 2011; Hidaka, 2012). Many signaling pathways have been shown that depression constitutes a serious and recurrent disorder often manifested with psychological, behavioral and physiological symptoms: depressed mood, loss of interest or pleasure, decreased energy, feelings of guilt or low self-worth, disturbed sleep or appetite (Armario, 2006; Wei-Wei et al., 2014). Several studies have also indicated that depression is related to structural and
functional changes in speciefic brain regions (Vyas et al., 2002; Stockmeier et al., 2004; Oh, 2012). These disabilities appear through a disturbance of the hypothalamic-pituitary-adrenocortical (HPA) axis (Howell & Muglia, 2006); the key components of the “stress system” and one of the primary systems moderating the physiological response to psychological and physiological stressors in mammals (Sapolsky et al., 2000), including the release of glucocorticoids. The principal end products of the HPA axis regulate many physiological functions and play an important role in affective regulation and dysregulation (Maric & Adzic, 2013). Obviously, this dysfunction is not only affecting regulation, but it can also lead to serious metabolic, immune, cardio vascular and psychological dysfunction. Newly studies focused on the interactions between the central nervous system (CNS), the endocrine system and the immune system which have given rise to the field of psycho-neuro-immunologic researches (Fleshner et al.,2011) and the impact of these interactions on health are the two major pathways through which immune function can be altered, especially induces a decrease or a disruption of immunity cells , a decrease of the different subsets of
2 lymphoid cells in secondary lymphoid organs that correlates with a decrease of antibody levels (Moazzam et al., 2013) as well as a disruption of cytokine secretion ( McEwen, 2008). Dysfunction of HPA and immune systems is in line with an illness model of depression in which the stimulus (i.e. time-dependent risk factor) continues to have an impact even when no longer present. In this model there is an immediate increase in the risk of illness following application of a stimulus; once ill. However, removing the risk factor does not necessarily lead to restitution (Bottomley et al., 2010). Therefore, we need to look for treatment strategies that provide HPA functional restitution and promote resilience. Resilience is defined as the ability to maintain a state of normal equilibrium in the face of extremely unfavorable circumstances.
One of the most elegant long-term models of depression is the chronic mild stress (CMS) procedure that was first used by (Katz, 1982). In the CMS model, chronic sequential exposure of rats to a variety of mild model has been shown to induce lower consumption of sucrose postulated to reflect anhedonia (the loss of interest or pleasure) in animals. One of the core symptoms required for diagnosis of a major depressive episode in humans is reflected by a reduced consumption and/or preference of sweetened solutions. Exposure to chronic mild stress also induces significant changes in behavioral parameters (Farhan et al., 2014) such as locomotive and explorative behavior; a decline in food and water intakes. It can also lead to activity of the HPA axis including adrenal hypertrophy and corticosterone hyper-secretion and loss of body weight (Jankord & Herman, 2008; Lucca et al., 2009). All these symptoms are consistent with human depression (Harro et al., 2001); although it has been extensively reported that stress may reduce body weight in rodents (Matuszewich & Yamamoto, 2003; Lin et al., 2005).
The complexity of daily life in modern societies frequently leads to various degrees of anxiety and depression. Mood, depression and anxiety disorders have been found to be associated with chronic pain amongst medical patients in both developed and developing countries (Rupesh et al.,2011). Currently many experimental studies focusing on the pathophysiology of depression have examined the effects of stress and/ antidepressant in male subjects (Palanza, 2001). Therefore, the development of new drugs for the treatment of depression disorders is an important goal of neuro-psychopharmacology researches.
3 Most abnormal effects of CMS can be reversed by antidepressant treatments, suggesting a strong predictive validity (Zhang et al., 2010).
However, the exact molecular and cellular mechanism underlying the development of depression and therapeutic actions of antidepressants remain poorly understood. In recent years, researchers have focused on the interactions between the monoamine neurotransmitters and their reuptake and the receptor proteins.
Most antidepressant drugs used clinically are synthetic compounds, such as selective serotonin-reuptake inhibitors (SSRIs), tricyclic antidepressants, monoamine oxidase inhibitors, and norepinephrine reuptake inhibitors (Ping et al., 2014). Although these antidepressant agents can produce a rapid increase of serotonin (5-HT) and/or noradrenaline (NA) at synaptic levels, it usually takes at least 3 to 4 weeks to obtain an appreciable clinical effect (Wong & Licinio, 2001; Santarelli et al., 2003).
Since these applied agents present in many cases adverse effects on patients (Dhawan et al., 2001; Nutt, 2002; Wei-Wei et al., 2014). The usage of complementary and alternative
medicine (CAM) is required.
Nowadays, plants are being used as a source of medicine in alternative therapy of depression (Kessler et al., 2001). There are over 10 medicinal plants used commercially as regulated Natural Health Products (NHPs), or EU- phytomedicines to treat mood disorders related to anxiety (Cayer, 2011). There is a growing interest in these products among some researchers because patient compliance is high and evidence of efficacy and fewer drawbacks are available.
Medicinal plants have been an important source for the discovery of new bioactive compounds which served and continue to serve as lead molecules for the development of new drugs. (Banisteriopsis capi) and (Peganum harmala) are most widely used as medicinal plants; this may be due to the high level of pharmacologically active alkaloids produced mainly of β-carboline (β-CA) as Harmine (HMR) harmaline (HML) and tetrahydroharmine (THH) (McKenna, 2004). These medicinal plants have been studied pharmacologically, phytochemically, extensive animal behavior and clinical researches supporting their efficacy are found.
4 In this regard, Harmine a naturally occurring β-carboline alkaloid has long been used in folk medicine in the Middle East and in Asia (Sourkes, 1999) and as a hallucinogenic drug (Wink & Van Wyk, 2008). Harmine present the most abundant and active ingredients of several plants such as Grevia bicolor (Malvaceae), Passiflora incarnate (Passifloraceae),
Banisteriopsis capi and Peganum harmala (Zygophyllaceae) (Kartal et al., 2003; Cao et al.,
2007). Harmine was first isolated from the seeds of Peganum harmala L in 1874 (Zhao & Wink, 2013).
Harmine possesses a broad range of pharmacological activities such as anxiolytic and behavioral effects (Brierley & Davidson, 2012). Some studies demonstrated that Harmine contains significant anti-tumor potential both in vitro and in vivo (Martín et al., 2004; Cao et al., 2013). Hypothermic, antibacterial (Arshad et al, 2008), antioxidant, hallucinogenic, cytotoxic, (Cao et al., 2007; El Gendy & El-Kadi, 2012). Insecticide (Bouayad et al., 2012), to activities in complex processes of bone regeneration (Yonezawa et al., 2011). Furthermore, antiplasmodial activity (Astulla et al., 2008),vascular (Berrougui et al., 2006) muscle, antimutagenic, antiplatelet properties, and antigenotoxic activities (Moura et al., 2007, Im et al., 2009). Similarly analgesic, powerful anti-inflammatory (Monsef et al., 2004; Shahverdi et al., 2005), is an antidiabetic agent (Vollmayr & Henn, 2003), cholesterol lowering, with hepato-protective effects (Hamden et al., 2007) and immune modulator influences (Wang et al., 1996). But the main studies are focused on the activity of the substance on the nervous system, that’s why some of these properties may explain why Harmine was found to have significant antidepressant actions (Kim et al., 1997; Glennon et
al., 2000; Husbands et al.2001; Halberstadt et al., 2008). Altogether, many researcheshave
been reported that Harmine have a wide range of neurotrophic and neuroprotective effects (Li
et al., 2011, Zhong et al., 2015).
In fact, systemic administration of Harmine has been shown to induce antidepressant- like actions in animals subject to forced swimming test (Farzin & Mansouri, 2006; Fortunato et
5 Aims of the study:
The overall objectives of the thesis are to assess:
The construct validity of the CMS model that we introduced a few modifications in our laboratory.
a) Administration of stressors.
b) Assessment of anhedonia (sucrose/saccharine intake).
c) Evaluation of pathophysiological and neurobiological aspects of depression in the CMS model:
- Exploration activity and emotionality in various behavioral tests. - Plasma ACTH.
- Plasma IgG and IgM .
We examined if there was any behavioral measure which correlates with the changes of the hedonic reactivity due to CMS.
The ability of chronic administration of Harmine and Amitriptyline to regulate disorders after CMS in a battery of animal behavior paradigms.
The effects of Harmine or Amitriptyline chronic treatment on the altered physiological responses mainly ACTH circulating levels and humoral immune response of wistar rats after CMS.
Materials &
Methods
6 2. MATERIALS AND METHODS
2.1. Animals and Housing
Adult male albino Wistar rats were purchased from the Pasteur institute of Kobba (Algiers) with body weight 200-331 g. The laboratory rats, Rattus norvegicus belongs to the order Rodentia and family Muridae (Fallon, 1996).Unlike wild ones, they are year round breeders, omnivorous and will burrow if given the chance. They are nocturnal animals (Würbel et al., 2009; Lennox & Bauck,2011) but adapt to their environments.
Laboratory rats are shorter lived two to four years (Ballam et al., 2000; Bulliot, 2004) dependent genetic and environmental factors. Puberty occurs between (45 –75) days of age for male rats (4 ~ 8 weeks) (Wu & Gore, 2010) with some inbred strains maturing sexually at 3-4 months of age. Laboratory rats are docile, very adaptable, curious intelligent and easily trained. Rats are most commonly housed in solid cages (50× 60×53 cm3) constructed of durable plastic and bedding in special circumstances such as stainless steel cages. A contact bedding material such as wood chips, particles should be placed in the bottom of cages. The study was carried out in the animalery of the University Badji Mokhtar-Annaba.
The animals were housed ten per cage with access to food and water ad libitum. They were maintained in under natural conditions of temperature, photoperiod and relative humidity (Fig.1). Animals were weighted and divided into six experimental groups as follows: (1) Control - Saline, (2) Control - Amitriptyline ; (3) Control - Harmine, (4) Stressed - Saline; (5) Stress - Amitriptyline ,(6) Stress - Harmine .They were allowed to acclimatize for a period of 30 days. Animals in the control group were reared in single cages without any environmental stresses unlike animals in CMS were entered into the CMS procedure.
7 Figure 1. Rat housing conditions.
2.2. Drug and Treatment The drugs used in this study are:
Harmine (C13H12N2O) is a tricyclic beta-carboline alkaloid .It was purchased from Cayman Chemical (USA) (CAS 343-27-1, approx. 98% purity) (Fig.2).The dose was chosen based on (Garcia et al., 2008a, b).
Amitriptyline (C20H23N) is a tricyclic standard antidepressant (for many years it has been considered as one of the reference compounds for the pharmacological treatment of depression) was purchased from pharmaceutical industry Gencopharm (ZI Rouiba, Route C BP 73, Algeria) (Fig.3).
Figure 2. Chemical structure of Harmine (7-methoxy-1-methyl-9H-pyrido [3, 4-b] indole) (Wang et al., 2015).
8 Figure 3. Chemical structure of Amitriptyline [3-(10, ll-dihydro-5H-dibenzol [a,d] cyclohept-5-ylidene) propyldimethylamine] (Soni et al.,2012).
To develop this study we used 60 animals (n=10 animals in each group) separated into six groups, as follows:
G1: Control + Saline; Group treated with saline 1ml / kg bw.
G2: Control + Amitriptyline; Group treated with 20 mg/1ml / kg bw. G3: Control + Harmine; Group treated with 15 mg/1ml / kg bw. G4: Stressed + Saline; Group treated with saline 1ml / kg bw. G5: Stressed + Amitriptyline; Group treated with 20 mg/1ml / kg bw. G6: Stressed + Harmine; Group treated with 15 mg/1ml / kg bw.
All groups were treated intraperitoneally (i.p.) with saline, Harmine or Amitriptyline respectively according to body weight (Carbajal et al., 2009) (Fig.4).
All the treatments were administered in a volume of 1 ml/kg.
The chronic treatment was performed during the anhedonia test once a day during 7 days, 30 min before the behavioral evaluation. Physiological Saline (0.9%) was used as a control vehicle for this experiment. The drugs were freshly prepared and the unused portions of drug solutions were discarded after 24 h.
G1; G2; G3: served as a control group
9 Figure 4. Drug was administered intraperitoneally (i.p) at (1 mg/kg/day) on each rat.
2.3 Experimental Protocol
The CMS used was developed on the basis of the previous experiments with minor modifications (Willner et al., 1992; Xiong et al., 2011). This model used to achieve depressive-like symptoms in wistar rats (Willner et al., 1987; Jayatissa et al., 2006). Also it is used for screening novel antidepressant treatments and investigating the neurobiology of depression and its relation to other diseases (Fawcett et al., 1983; Willner et al., 1987). During this experiment, the rats in the control group were left undisturbed in their home cages in a separate room, without any stress, receiving only ordinary daily care with supports of food and water, whereas the rats in CMS groups exposed to CMS procedure. Rats were subjected once a day for 30 days to one of the following stressors such as (i) forced swimming for a duration of 10 or 15 min on days 1, 15, 21, 25 ;(ii) 24 h water deprivation on days 5, 10, 14, 19,30 ; (iii) 24 h food deprivation was applied on days 6, 13, 20,26; (iv) 1–1,5 h restraint on days 2, 3, 4, 7, 8, 9 ; and 3-4 h restraint on days 16- 29 13, 26 (v) and no-stress on days 11-12-27. Stressor stimuli were applied at different times every day, in order to minimize its predictability. The Restraint test was model described by (Bardin et al., 2009). Animals were restrained by gentle wrapping of their upper and lower limbs with masking tape, then returned to their cages. The Forced swimming was carried out by placing the animal in a glass tank measuring 50×47 cm with 30 cm of water at 23±2°C (Porsolt et al., 1977). After 30 days of chronic mild stress protocol, one group of rats was treated with Harmine (15 mg/kg/day) and another group was treated with Amitriptyline (20 mg/kg/day) once a day across 7 days. The body weight was determined throughout the experiment.
10 At the end of the experimental procedure, rats were killed by decapitation and the blood was collected. Then, the organs of each animal of the different groups were removed and weighed. The stressed group was exposed to water and food deprivation prior to sucrose intake, in all other cases, food and water were freely available in their home cages (Willner et al.,1992 ;Gronli et al., 2005).Individual stressors and length of time applied each day are listed in Table 1.
Table 1
The protocol and stress procedures for chronic mild stress
Day of treatment Stressor used Duration
Day 1 Forced swimming 10 min
Day 2 Restraint 1h
Day 3 Restraint 1h
Day 4 Restraint 1h
Day 5 Water deprivation 24h
Day 6 Food deprivation 24h
Day 7 Restraint 1.30
Day 8 Restraint 1.30
Day 9 Restraint 1.30
Day 10 Water deprivation 1.30
Day 11 No stressor applied -
Day 12 No stressor applied -
Day 13 Food deprivation 24h
Day 14 Water deprivation 24h
Day 15 Forced swimming 15min
Day 16 restreint 2h
Day 17 restreint 2h
Day 18 restreint 2h
Day 19 Water deprivation 24h
Day 20 Food deprivation 24h
Day 21 Forced swimming 10 min
Day 22 restreint 3h
Day 23 restreint 3h
Day 24 restreint 3h
Day 25 Forced swimming 15 min
Day 26 Food deprivation 24h
Day 27 No stressor applied -
Day 28 restreint 4h
Day 29 restreint 4h
11 2.4. Behavioral Assessment
Organism reaction to stressor or any environmental change is an important adaptive response that mobilizes the organism and re-establishes homeostasis. As known, Laboratory rats tend to be social animals, docile and curious but within the stressful procedures that may result in either adaptive or maladaptive reactions. Therefore, there are numerous behavioral paradigms using several conflict procedures, social interaction or exploration of novel environments have been proposed as animal models of anxiety. In this study, we carried out on using the following employed paradigms to assess anxiety-like and depression related behavior modification by pharmacological agents in rodents: Anhedonia test, Elevated Plus Maze (EPM), Open Field (OF) and Black & White Box test. These tests were performed at the end of CMS procedures or treatment.
2.4.1. Sucrose Preference Test (Anhedonia Test) (Willner et al., 1987)
The sucrose preference is considered as an index of anhedonia a core symptom of depression (Wann et al., 2010; Shi et al., 2012). The test is a two-bottle choice paradigm performed according to the procedure as described (Bolanos et al., 2008, Shi et al., 2012). Briefly, rats were given access to two bottles (water and 1 % sucrose solution) freely for 7 days. The position of the 250-mL bottles containing sucrose solution or tap water was alternated each day, to prevent location preference. The sucrose consumption test was performed (1st day of behavioral test) by presenting both sucrose solution and tap water in the morning (08:00 am). The bottles were weighed after 24 h (the next morning). The rats are typically subjected to an acclimatization period (Dagytė et al., 2011) where they are trained to consume the sucrose solution (Wang et al., 2013) and then deprived of food and water prior to testing so as to motivate them to drink.
Sucrose preference was calculated according to the following formula:
Sucrose preference was calculated as the percentage of sucrose solution ingested relative to the total amount of liquid consumed (Willner et al., 1987, Sclafani & Ackroff, 2003). Behavioral changes were measured in the following tests;
12 Elevated plus-maze (EPM).
Open Field (OF). Light dark box (LDB).
2.4.2. Elevated Plus Maze (EPM)(Montgomery, 1955)
The elevated plus maze has strong claims to validity as an animal model of anxiety, is based on a rat’s natural fear of open, unprotected, and elevated spaces (Pellow et al., 1985; Parihar
et al., 2011). The apparatus and the testing procedure were carried out as originally described
by (Pellow et al., 1985). Frequently, it was used to measure the exploratory and anxiety levels in rodents and to screen potential anxiolytic drugs. The EPM apparatus was made of wood and consisted of two opposite open arms (50×10 cm) had no walls and the other two closed arms (50×10 cm) had 45 cm high walls made of clear Plexiglas. The open and closed arms were connected by a central square (10×10 cm) (Montgomery, 1955; Roy, 2002) and were elevated 50 cm above the floor. Rats from each group were placed in the central square of the EPM facing an open arm and then were allowed to freely explore the apparatus. And their activity was videotaped for 5 min. The following behaviors were scored during the test:
The number of entry in each arm, which was mostly, used as measures of general motor activity (Dawson et al., 1995; Weiss et al., 1998; Costa et al., 2012).
The time spent exploring both open and closed arms were recorded (s).
An individual entry was recorded when the animal entered the arm with at least two front paws and half of its body. The shorter is the time spent in opens arms, the higher is anxiety and vice versa (Ho et al., 2002; Mechan et al., 2002). After 5 minutes, rat was removed from the maze by the base of their tails and returned to their home cage. The maze was than cleaned with a solution of 30% ethanol and soft paper permitted to dry between tests.
13 Figure 5. Elevated plus-maze test (EPM) (Handley & Mithami, 1984).
2.4.3. Open Field Test (OFT) (Hall, 1934)
The open field test has been performed as previously reported (Hallam et al., 2004). The test has been used to assessing the emotionality, the spontaneous locomotor activity, the exploratory and anxiety behavior of animals (Pellow et al., 1985; Swiergiel & Dunn, 2007; Calabrese, 2008; Mesquita et al., 2008; De Paiva et al., 2010). It was performed after the EPM test. When the elevated plus maze test was finished, the rat was immediately placed into the open field.
The rats were treated with Harmine (15 mg/kg), Amitriptyline (20 mg/kg) and saline 60 min before the exposure to the open field apparatus, in order to assess possible effects of drug treatment on spontaneous locomotor activity. The test was performed between 08:00 and 11:00 h. The open-field apparatus is circular arena 70 cm×70 cm surrounded by 40 cm high walls made of whiteplywood with a frontal glass wall. The floor of the open-field was divided into 9 rectangles (10 cm×10 cm each) by black lines (Frey et al., 2006). At the start of the test, each animal were gently placed in the central square of the open field and rats received one 10 minute exploration session to help them habituate to the apparatus and assess overall activity level .The following behaviors were recorded by a video camera for 5 min:
The time spent (s) in the center was measured as an anxiolytic indicator (Prut & Belzung, 2003; Grivas et al., 2013).
14 The number of rearing’s (standing on the hind paws)
Time spent (s) in rearing in each of the open field zones. The number of crossing.
Grooming time (s) (rubbing the body with paws or mouth and rubbing the head with paws). (Prut & Belzung 2003).
Defecation: The number of (fecal pellets) excreted during open field exploration (Hall, 1934; Qi,2006)
After each trial, the plate was cleaned each time after testing a rat to minimize circadian differences in behavior.
Figure 6. Open Field Test (Hall, 1934).
2.4.4. Light Dark Box Test (Shimada et al., 1995)
Light dark box allows easy and quick evaluation of an animal’s anxiety as reflected in their behavior. The test identifies behavioral modifications resulting from pharmacological agents. Activity in LDB is used to assess anxiety behavior in rodents (Shimada et al., 1995). Briefly, the apparatus consisted of clear Plexiglas cage (70×70×40 cm) separated in two compartments with an access (10x10cm) at floor level. The open compartment was open topped, transparent and brightly illuminated by a 60 Walt desk lamp overhead and the other was made of black Plexiglas. It was cover on top also by black Plexiglas. Animals were placed in the dark box
15 facing the opening and were allowed 10 min of free exploration. The following behaviors were recorded using a video camera:
The number of entries (all four paws) into the light area, which is defined as the placement of all four paws in the compartment of the activity box (Bourin & Hascoët, 2003).
The time spent in the light area (s).
After performing tests the rat is returned to home cage and the apparatus was cleaned thoroughly between subjects (Bailey & Crawley, 2009).
Figure 7. Light dark box test (Shimada et al., 1995). 2.5. Methods
2.5.1. Body Weight
Animal body weight was measured at the beginning (1st day) of the chronic mild stress protocol, and 7 days after completing treatment (37th day).
2.5.2. Blood Analysis:
On the seventh day of consumption of sweet water, immediately after the last testing session, under ether anesthesia, blood samples taken in the morning between 8:00 am and 10:00 am from jugular vein (Toft et al.,2006) , then was collected in tubes containing;
Ethylenediaminetetraacetic acid (EDTA) for determination of adrenocorticotropic ACTH plasma levels (Katz, 1981; Gamaro et al., 2003).
16 However blood collected in tubes containing heparin, used for determination of
immunological parameters.
Figure 8. Photographs illustrating (A) Anesthesia; (B) Blood collection; (C) Dissection; (D) Organs removed.
2.5.3. Organ Weight
Immediately after decapitation, the following organs were removed and dissected out through laparotomy, carefully pruned from surrounding fat and tissues and slowly cleaned using filter paper saturated in 0.9% NaCl solution and weighed in precision scale (SCALTEC SBC 51) (Bikas et al., 2002).
Adrenal gland and brain weight were used in this study as an indirect parameter of hypothalamic-pituitary-adrenal axis activation (Katz, 1981; Gamaro et al., 2003). When the left and right adrenals were weighed together.
Thymus (the immune system organs). Liver (the digestive system organs).
Heart (the circulatory system organs).
The relative weight of organs is calculated using the formula (Talip et al., 2013):
17 Figure. 9 Photographs illustrating the removed organs (A) Brain; (B) Thymus; (C) liver; (D)
Heart; (E) Adrenal gland.
2.5.4. ACTH, IgG and IgM Assays
At the end of the experiment, ten rats from each group were randomly chosen for blood analysis. Blood samples were taken in the morning. The tubes were kept at room temperature for approximately half-hour to allow clotting of blood. Then serum was centrifuged with 5000 tr/min during 15 mn, the plasma separated was used for determination of ACTH, IgG and IgM levels. The plasma of each parameter concentration were measured using commercially available radioimmunoassay kits (both from sigma - Aldrich, USA).
2.5.4.1. Measurement of Plasma ACTH Level (Katz, 1981)
Plasma ACTH was measured by (Katz, 1981) (following the technical bulletin). 2.5.4.1.1. Assay Procedure
1. Secure the desired number of coated wells in the holder.
2. Add 200 µL of standards or calibrators, specimens and controls into appropriate wells. Freeze (-20°C) the remaining calibrators and controls as soon as possible after use.
3. Add 25 µL of Reagent 1 (Biotinylated Antibody) to each well. 4. Add 25 µL of Reagent 2 (Enzyme Labeled Antibody) to each well.
5. Cover the plate with aluminum foil to avoid exposure to light and incubate for 2 hours at room temperature (20-25°C) with shaking.
18 6. Remove liquid from all wells. Wash wells five times with 300 µL of 1X wash buffer. Blot on absorbent paper towels.
7. Add 100 µL of luminol substrate to all well.
Read the relative light units in each well using Luminometer (0.2-1 second integration time) within 5 minutes of substrate addition.
2.5.4.2. Quantitative Determination of IgG and IgM (Whicher et al., 1982) 2.5.4.2.1. IgG Assay Procedure
1. Secure the desired number of coated wells in the holder.
2. Dispense 100 ml of standards and diluted samples into the wells (we recommend that samples be tested in duplicate).
3. Incubate on an orbital micro-plate shaker at 100-150 rpm at room temperature (18-25°C) for 45 minutes.
4. Aspirate the contents of the microtiter wells and wash the wells 5 times with 1x wash solution using a plate washer (400 ml/well). The entire wash procedure should be performed as quickly as possible.
5. Strike the wells sharply onto absorbent paper or paper towels to remove all residual wash buffer.
6. Add 100 ml of enzyme conjugate reagent into each well.
7. Incubate on an orbital micro-plate shaker at 100-150 rpm at room temperature (18-25°C) for 45 minutes.
8. Wash as detailed in 4 to 5 above.
9. Dispense 100 ml of TMB Reagent into each well.
10. Gently mix on an orbital micro-plate shaker at 100-150 rpm at room temperature (18-25°C) for 20 minutes.
11. Stop the reaction by adding 100 ml of Stop Solution to each well.
12. Gently mix. It is important to make sure that all the blue color changes to yellow. 13. Read the optical density at 450 nm with a microtiter plate reader within 5 minutes.
19 2.5.4.2.2. IgM Assay Procedure
1. Secure the desired number of coated wells in the holder.
2. Dispense 100 µl of standards and diluted samples into the wells (we recommend that samples be tested in duplicate).
3. Incubate on an orbital micro-plate shaker at 100-150 rpm at room temperature (18-25°C) for 45 minutes.
4. Aspirate the contents of the microtiter wells and wash the wells
5 times with 1x wash solution using a plate washer (400µl/well). The entire wash procedure should be performed as quickly as possible.
5. Strike the wells sharply onto absorbent paper or paper towels to remove all residual wash buffer.
6. Add 100 µl of enzyme conjugate reagent into each well.
7. Incubate on an orbital micro-plate shaker at 100-150 rpm at room temperature (18-25°C) for 45 minutes.
8. Wash as detailed in 4 to 5 above.
9. Dispense 100 µl of TMB Reagent into each well.
10. Gently mix on an orbital micro-plate shaker at 100-150 rpm at room temperature (18-25°C) for 20 minutes.
11. Stop the reaction by adding 100 µl of Stop Solution to each well.
12. Gently mix. It is important to make sure that all the blue color changes to yellow. 13. Read the optical density at 450 nm with a microtiter plate reader within 5 minutes.
2.5.5. Statistical Analysis (Daniel & Cross, 2010)
Data and interactions (body and organs weight, sucrose preference test, open field, elevated plus maze, light dark box tests, ACTH, IgG and IgM plasma level) were evaluated by one-way analysis of variance ANOVA was performed for multiple comparisons followed by Tukey post hoc test. Student t test and student t test for paired data. All results are expressed as mean ± standard error of the mean (SEM).
20 All analysis was performed using Statistic Minitab version 16.0 for windows. The level of probability was set at (p < 0.05) as statistically significant.
2.5.5.1. The Multiple Comparison Method 2.5.5.1.1. Tukey's Method
The Tukey (also called Tukey-Kramer in the unbalanced case) method is extensions of the methods used by one-way ANOVA. The Tukey approximation has been proven to be conservative when comparing three means. "Conservative" means that the true error rate is less than the stated one. In comparing larger numbers of means, there is no proof that the Tukey method is conservative for the general linear model.
Tukey method used in ANOVA to create confidence intervals for all pairwise differences between factor level means while controlling the family error rate to a level you specify. It is important to consider the family error rate when making multiple comparisons because your chances of making a type I error for a series of comparisons is greater than the error rate for any one comparison alone. To counter this higher error rate, Tukey's method adjusts the confidence level for each individual interval so that the resulting simultaneous confidence level is equal to the value you specify.
The ANOVA resulted in a p-value of 0.01, leading you to conclude that at least one of the manufacturer means is different from the others.
Tukey’ confidence intervals provide less precise estimates of the population parameter but limit the probability that one or more of the confidence intervals does not contain the true difference to a maximum of 5%. Understanding this context, you can then look at the confidence intervals to see if any do not include zero, suggesting a significant difference.
21 Table 2 The characteristics of the multiple comparison methods
Comparison method Properties
Tukey all pairwise differences only, not proven to be conservative
2.5.5. 2. Sample T-Test or Student T Test
A hypothesis test for two populations means to determine whether they are significantly different. This procedure uses the null hypothesis that the difference between two population means is equal to a hypothesized value (H0: U1- U2 = U0), and tests it against an alternative hypothesis, which can be left-tailed (U1- U2 < U0), right-tailed U1- U2 > U0), or two-tailed U1- U2≠ U0).
The 2-sample t-test analyzes the difference between these two means to determine whether the difference is statistically significant. The hypotheses of a two-tailed test would be:
• H0: U1- U2 = 0 (seatbelt strengths from both companies are equal) • H1: U1- U2≠ 0 (seatbelt strengths from both companies are different)
If the test's p-value is less than our chosen significance level, we should reject the null hypothesis. To conduct a 2-sample t-test, the two populations must be independent; in other words, the observations from the first sample must not have any bearing on the observations from the second sample.
2.5.5. 3. Paired T-Test
A hypothesis test for the mean difference between paired observations that are related or dependent. The paired t-test is useful for analyzing differences between twins, differences in before-and-after measurements on the same subject, and differences between two treatments given to the same subject. This procedure tests the null hypothesis that the true mean difference within pairs (d12) is equal to a hypothesized value (H0: d = 1 2 =
22 0). The alternative hypothesis can be left-tailed (d< 0), right-tailed (d > 0), or two-tailed (d ≠ 0).
A paired t-test can be more powerful than a 2-sample t-test because the latter includes additional variation arising from the independence of the observations. A paired t-test is not subject to this variation because the paired observations are dependent. Also, a paired t-test does not require both samples to have equal variance. Therefore, if you can logically address your research question with a paired experimental design, it may be advantageous to do so, in conjunction with a paired t-test, to gain more statistical power.
p-value (P)
Used in hypothesis tests to help you decide whether to reject or fail to reject a null hypothesis. The p-value is the probability of obtaining a test statistic that is at least as extreme as the actual calculated value, if the null hypothesis is true. A commonly used cut-off value for the p-value is 0.05. For example, if the calculated p-value of a test statistic is less than 0.05, you reject the null hypothesis.
23 Figure10. Schematic representation of the experimental protocol; CMS procedure and
Results
24 3. RESULTS
3.1. Body Weight Gain
The effects of the CMS paradigm in body weight are illustrated in Fig. 11. It should be mentioned that at the beginning of the experimental procedure, no body weight differences were observed between groups (F=0.04; p=0.999). However, CMS rats treated with saline failed to gain weight (t=-1.26; df=18; p=0.225) during the 30 days of observation. Also, CMS animals failed to gain weight after the treatment with Harmine or Amitriptyline compared with the rats' body weight assessed at the beginning of the experiment (t=-1.86; df=18; p=0.080) (t=-2.05; df=18; p=0.055).
Figure 11. Effects of CMS procedure on body weight of rats repeatedly treated with Harmine (Har; 15 mg/kg i.p.) and Amitriptyline (Amy; 20 mg/kg i.p.) on body weight gain in rats. 30 days of CMS were followed by 1 week of drug treatment. Bars represent means ± SEM (n꞊10 per group). Ns: No significant difference p >0, 05 vs. control saline, according to the Student t-test for paired data.
3.2. Variation of Organs Weight
The effects of the CMS protocol in organs weight are summarized in the Fig. 12. As compared to the mean values of stressed rats treated with saline to non-stressed rats injected with saline, significantly lower mean relative brain weight (F=2.51; p = 0.041; Fig. 12A). Also, CMS procedure induced an increase of relative adrenal gland weight in stressed rats
25 treated with saline compared with non-stressed rats (F = 3.38; p =0.010; Fig. 12B) and were statistically different from all other treated groups.
Whereas no statistical significant alterations were observed in thymus , liver and heart weight (F= 0.29; p= 0.914; Fig. 12C),(F= 1.51; p =0.186; Fig. 12D),(F= 1.60 ; p =0.175; Fig. 12E) .Interesting enough, the treatment with Harmine or Amitriptyline for 1 week re-established to a normal range the brain and adrenal gland weight in stressed rats.
26 Figure 12. Effects of CMS procedure on the relative weight of (A) the brain, (B) adrenal gland, (C) thymus, (D) liver and (E) heart in rats repeatedly treated with Harmine (Har; 15 mg/kg, i.p.) and Amitriptyline (Amy; 20 mg/kg, i.p.).Bars represent means ±S.E.M. Ns: No significant difference p >0, 05.**p<0 .01 vs. control saline; #p < 0.05 vs. CSM saline, according to ANOVA post hoc Tukey’s test.
27 3.3. Behavioral Assessment
The results of various employed paradigms have been used in this study Anhedonia, Elevated
plus maze (EPM), Open Field (OPF) and Light Dark Box test are discussed below:
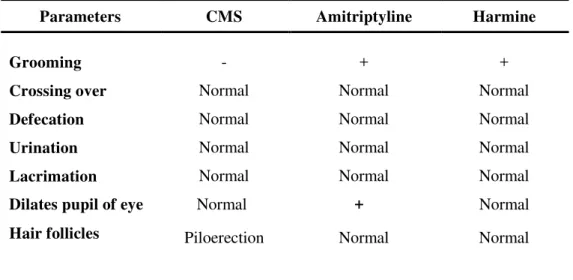
Table 3. Effect of Harmine and Amitriptyline on Gross behavioral parameters.
3.3.1. Sucrose Preference Test
CMS gradually reduced the consumption of the sucrose solution. As compared in the baseline test, 1 week later the sucrose intake was reduced in the stressed animals. The difference in sucrose intake between the control and stressed groups treated with saline (p< 0.05). As shown in Figure.13, unstressed rats treated with Har, Amy and saline presented no significant variation in their preference for sucrose consumption. But in the stressed animals, when compared at this week, to the treatment with Har or Amy caused a gradual recovery of the sucrose intake. Stressed animals repeatedly treated with Har for one week showed significant improvement and there was no significant difference between the drug-treated stressed and vehicle-treated control animals.
Parameters CMS Amitriptyline Harmine
Grooming - + +
Crossing over Normal Normal Normal
Defecation Normal Normal Normal
Urination Normal Normal Normal
Lacrimation Normal Normal Normal
Dilates pupil of eye Normal + Normal Hair follicles Piloerection Normal Normal
28 Figure 13. Effects of chronic mild stress (CMS) and chronic treatment with Harmine (Har; 15 mg/kg, i.p.) and Amitriptyline (Amy; 20 mg/kg ,i.p.) on 1% sucrose consumption in rats. 30 days of CMS was followed by 7 day of drug treatment. Bars represent means ±SEM (n = 10). *p< 0.05 vs. control saline; #p < 0.05 vs. CSM saline, according to ANOVA post hoc Tukey’s test.
3.3.2. Anxiolytic Activity in Elevated Plus Maze (EPM) Test
Data regarding to the effect of chronic administration of Harmine at dose of 15 mg/kg and Amitriptyline at dose of 20 mg/kg on the behavioral changes during the elevated plus- maze were outlined in (Figure 14). CMS rats displayed a decrease in the number of entries and in the time spent in the open arms compared to non-stressed rats (F= 2.62 ; p =0.034; Fig. 14A), (F= 4.140 ; p =0.003; Fig. 14B); Moreover, No significant differences were detected for CMS rats compared with control rats in the number of entries and in the time spent in the closed arms (F= 1.17 ; p =0.334; Fig. 14C), (F= 2.11 ; p =0.078; Fig. 14D).The number of entries and the time spent in the open arms were significantly affected by Harmine or Amitriptyline treatment.
30 Figure 14. Effects of CMS procedure on the number of entries into the open arms (A) the time spent in the open arms (B) the number of entries into the closed arms (C) and the time spent in the closed arms (D) in the elevated plus maze test in rats repeatedly treated with Harmine (Har; 15 mg/kg, i.p.) and Amitriptyline (Amy; 20 mg/kg, i.p.). Bars represent means± SEM (n = 10). Ns: No significant difference p >0, 05,* p<0, 05, ** p<0, 01 vs. control saline; # p<0.05, ## p<0.01 vs. CMS saline, according to ANOVA post-hoc Tukey test.
3.3.3. Anxiolytic Activity in Open Field (OPF) Test
Fig. 15 showed the behavior of rat in the open Field test. Statistical analysis revealed that CMS rats spent a few time in the center of the field compared with the control (F= 5.10; p =0.001; Fig. 15A). By contrast, in the peripheral part of the arena, CMS rats treated with saline spent significantly more time compared to control group (F= 2.47; p =0.044; Fig. 15B). By contrast Fig. 15C, D, E and G showed that 30-day of chronic stressful stimuli did not alter the number of crossings (F= 0.90; p =0.485; Fig. 15C), neither the number (F= 0.78; p =0.567; Fig. 15D) nor the time of rearings (F= 1.39; p =0.242; Fig. 15E) and defecation (F= 0.83; p =0.537; Fig. 15G) displayed by all groups. This indicated that neither CMS nor Har or Amy treatments affected horizontal and vertical activity.
Self-grooming time illustrated in (Fig. 15F) respectively. Rats subjected to the CMS paradigm and treated with saline, displayed decreased grooming time (F= 2.49; p =0.042; Fig. 15F) compared with non-stressed rats injected with saline. Interestingly, CMS rats repeatedly treated with Harmine or Amitriptyline reversed the decrease of self-grooming time.
33 Figure 15. Effects of CMS procedure on emotional rat behaviors repeatedly treated with Harmine (15 mg/kg, i.p.) and Amitriptyline (20 mg/kg, i.p.) in the open-field on test. (A) the time spent in the central zone;(B) the time spent in the peripheral zone; (C) crossings number; (D) rearings number; (E) rearings time (F) grooming time; (G) defecation . Bars represent means ± SEM, (n꞊10). Ns: No significant difference p >0, 05,*P<0.05, **P<0.01 vs. control saline; #P<0.05 vs. CMS saline, according to ANOVA post-hoc Tukey test.
3.3.4. Anxiolytic Activity in Light Dark Box (LDB) Test
As depicted in (Fig. 16) stressed rats treated with saline decreased the number of entries (F= 2.60; p =0.035; Fig. 16A), also the time spent in the light compartment compared with control rats treated with saline (F= 2.47; p =0.044; Fig. 16B).Statistical analysis revealed that CMS rats chronically treated with Harmine or Amitriptyline reversed in the same manner the decrease of the number and the time spent in the light compartment induced by 30 days of chronic mild stress in rats. Altogether, these effects are indicative of anxiolytic-like behavior of Harmine on CMS rat.
34 Figure 16. Effects of the chronic administration of Harmine (15 mg/kg, i.p.) and Amitriptyline (20 mg/kg, i.p.) on (A) the number of entries in light compartment and (B) the time spent in light area (sec) in rats subjected to the Light Dark Box test .Bars represent means ± SEM (n =10).* P <0.05 vs. control saline; # P<0.01 vs. CMS saline, according to ANOVA post hoc Tukey’s test.
3.5 Variation of Hormonal Parameters 3.5.1 Plasma ACTH Level
The stress was assessed by plasma ACTH hormone levels which illustrated in Fig. 17. Rats subjected to the CMS procedure, and treated with saline, displayed increased ACTH (F=3.32; p =0.011) hormone levels compared with non-stressed rats injected with saline. The treatment with Harmine or Amitriptyline reversed the increase of circulating ACTH hormone levels in CMS rat.
35 Figure 17. Effects of CSM procedure on adrenocorticotropic hormone (ACTH) circulating levels in rats repeatedly treated with Harmine (15 mg/kg, i.p.) and Amitriptyline (20mg/kg, i.p.). Bars represent means ±SEM. (n =10). ** P <0.01 vs. control saline; # P<0.05 vs. CMS saline,according to ANOVA post hoc Tukey’s test.
3.5.2 Immunoglobulin’s Level
Comparison of immunoglobulin levels between all the groups in (Fig .18). It was also found to be significantly (p˂0.05). Rats subjected to the CMS paradigm, and treated with saline, displayed increased of IgG (F=2.55; p =0.038; Fig .18A) without affecting the IgM (F=0.89; p =0.496; Fig .18B) immunoglobulin levels compared with non-stressed rats injected with saline. However, the treatment with Harmine or Amitriptyline reversed the increase of IgG circulating levels in CMS rats.
36 Figure 18. Effects of CSM procedure on immunoglobulin’s (A) IgG, (B) IgM levels in rats repeatedly treated with Harmine (15mg/kg, i.p.) and Amitriptyline (20 mg/kg, i.p.). Bars represent means ±SEM. (n =10).*P <0.05 vs. control saline; # P<0.05 vs. CMS saline, according to ANOVA post hoc Tukey’s test.
37 4. DISCUSSION
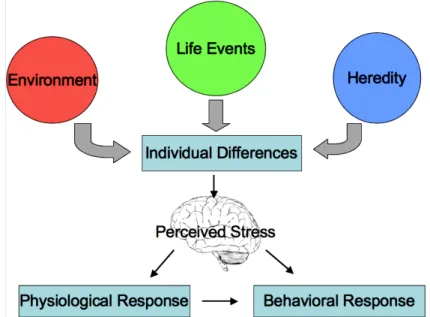
Environmental factors, such as stress, can impact the neurobehavioral profile of an organism and precipitate a depression-like syndrome. Numerous studies have shown that similar alterations accompany depression in humans as well as in rodents after exposure to a variety of mild stressors (CMS). (Connor & Leonard, 1998; Grippo & Johnson, 2002; Peng et al., 2000)(Fig. 19).
Figure 19. Individual differences in stress. Stress does not affect each individual the same way. A stimulus that may be stressful to one individual may not be stressful to another. Environment, life events, and genetics play a role in an individual’s tolerance for stress. When an individual perceives a stimulus as stressful a physiological and behavioral response will be displayed. (Atchley, 2011).
In the present study, weassessed the potential antidepressant- like activity of Harmine using a well-validated animal model of depression, the CMS model in rats (Papp et al., 2003; Liu et al., 2013). CMS is often associated with disruption in appetite or weight gain, which is easily measured in rodents. This is in accordance with the data of (Liu et al., 2013).
In this research, the body weight gain of stressed animals did not maintain a marked reduction and did not display a significant change. Several studies have also reported a lack of significant
![Figure 2. Chemical structure of Harmine (7-methoxy-1-methyl-9H-pyrido [3, 4-b] indole) (Wang et al., 2015)](https://thumb-eu.123doks.com/thumbv2/123doknet/2019155.3316/24.892.259.633.136.441/figure-chemical-structure-harmine-methoxy-methyl-pyrido-indole.webp)