O
pen
A
rchive
T
OULOUSE
A
rchive
O
uverte (
OATAO
)
OATAO is an open access repository that collects the work of Toulouse researchers and
makes it freely available over the web where possible.
This is an author-deposited version published in :
http://oatao.univ-toulouse.fr/
Eprints ID : 18467
To link to this article : DOI:10.1073/pnas.1613007114
URL :
http://dx.doi.org/10.1073/pnas.1613007114
To cite this version : Smith, William P.J. and Davit, Yohan and
Osborne, James and Kim, Wook and Foster, Kevin and Pitt-Francis,
Joe Cell morphology drives spatial patterning in microbial
communities. (2016) Proceedings of the National Academy of
Sciences, vol. 114 (n° 3). pp. E280-E286. ISSN 1091-6490
Any correspondence concerning this service should be sent to the repository
administrator:
[email protected]
Cell morphology drives spatial patterning
in microbial communities
William P. J. Smitha, Yohan Davitb, James M. Osbornec, Wook Kimd,1, Kevin R. Fosterd,2, and Joe M. Pitt-Francisa,2
aDepartment of Computer Science, University of Oxford, Oxford OX1 3QD, United Kingdom;bInstitut de M ´ecanique des Fluides de Toulouse (IMFT),
Universit ´e de Toulouse, Centre National de la Recherche Scientifique (CNRS), Institut National Polytechnique de Toulouse (INPT), Universit ´e Paul Sabatier (UPS), F-31400 Toulouse, France;cSchool of Mathematics and Statistics, University of Melbourne, VIC 3010, Australia; anddDepartment of Zoology,
University of Oxford, Oxford OX1 3PS, United Kingdom
The clearest phenotypic characteristic of microbial cells is their shape, but we do not understand how cell shape affects the dense communities, known as biofilms, where many microbes live. Here, we use individual-based modeling to systematically vary cell shape and study its impact in simulated communities. We compete cells with different cell morphologies under a range of conditions and ask how shape affects the patterning and evo-lutionary fitness of cells within a community. Our models predict that cell shape will strongly influence the fate of a cell lineage: we describe a mechanism through which coccal (round) cells rise to the upper surface of a community, leading to a strong spatial structuring that can be critical for fitness. We test our predictions experimentally using strains of Escherichia coli that grow at a sim-ilar rate but differ in cell shape due to single amino acid changes in the actin homolog MreB. As predicted by our model, cell types strongly sort by shape, with round cells at the top of the colony and rod cells dominating the basal surface and edges. Our work suggests that cell morphology has a strong impact within micro-bial communities and may offer new ways to engineer the struc-ture of synthetic communities.
biofilms | cell morphology | biophysics | self-organization | synthetic biology
S
ingle-celled microorganisms such as bacteria display signif-icant morphological diversity, ranging from the simple to the complex and exotic (1–3). Phylogenetic studies indicate that particular morphologies have evolved independently multiple times, suggesting that the myriad shapes of modern bacteria may be adaptations to particular environments (4–6). Microbes can also actively change their morphology in response to environ-mental stimuli, such as changes to nutrient levels or predation (7, 8). However, understanding when and why particular cell shapes offer a competitive edge remains an unresolved question in microbiology.Previous studies have characterized selective pressures favor-ing particular shapes (7, 9–11): for example, highly viscous envi-ronments may select for the helical cell morphologies observed in spirochete bacteria (12). Thus far, these studies have predom-inantly focused on selective pressures acting at the level of the individual cell. However, many species live in dense, surface-associated communities known as biofilms, which are fundamen-tal to the biology of microbes and how they affect us—playing major roles in the human microbiome, chronic diseases, antibi-otic resistance, biofouling, and waste-water treatment (13–17). As a result, there has been an intensive effort in recent years to understand how the biofilm mode of growth affects microbes and their evolution (18, 19), but we know very little of the importance of cell shape for biofilm biology.
In biofilms, microbial cells are often in close physical con-tact, making mechanical interactions between neighboring cells particularly significant. Recent studies have suggested that rod-shaped cells can drive collective behaviors in microbial groups because of their tendency to align their orientations with nearby
cells and surfaces (20, 21). The resulting orientational order affects how cell groups expand in microfluidic channels and enables motile cells to swarm together in raft-like collectives (22, 23). Aligned cells are also subject to buckling interactions, which fold neighboring cell groups into one another to form fractal-like interdigitations (21, 24), and differences in cell sizes may drive depletion effects that lead to genetic demixing (25). These studies suggest that, by influencing biomechanical inter-actions between microbes, shape may have far-reaching con-sequences for the properties and prospects of a cell within a community.
Individual-based modeling has emerged as a powerful way to study biofilms. These models serve as a testing ground to study how phenotypes, including adhesion, antibiotics, and extracel-lular polymeric substances (EPSs), affect individual strains and biofilms as a whole (26–31). However, the majority of individual-based models do not allow cell shape to be altered (32). We have therefore developed a flexible simulation framework that allows us to incorporate cell shape alongside cell division, physical inter-actions, and metabolic interactions via nutrient consumption. Our analyses identify a mechanism by which different cell shapes can self-organize into layered structures, thereby providing par-ticular genotypes with preferential access to favorable positions in the biofilm. We test our model predictions with experiments in which mutant Escherichia coli strains of different shapes are
Significance
Microbial communities contain cells of different shapes, and yet we know little about how these shapes affect community biology. We have developed a computational model to study the effects of microbial shape in communities. Our model predicts that shape will have strong effects on cells’ posi-tioning, and, consequently, their survival and reproduction. Rod-shaped cells are better at colonizing the base of the com-munity and its expanding edges, whereas round cells dom-inate the upper surface. We show that the same patterns occur in colonies of Escherichia coli, using strains with dif-ferent shapes. Our work suggests that cell shape is a major determinant of patterning and evolutionary fitness within microbial communities.
cultured together in colonies. Our work shows that differences in cell shape are central to both spatial architecture and fitness within microbial communities.
Results
To explore the consequences of bacterial cell shape within the biofilm environment, we used two approaches: computer simula-tions with an individual-based hybrid model (IbM) framework and experiments in which differently shaped bacteria are cul-tured together on agar plates.
Here, we introduce the model and its predictions, before going on to describe the experiments that we subsequently devised and performed to test it.
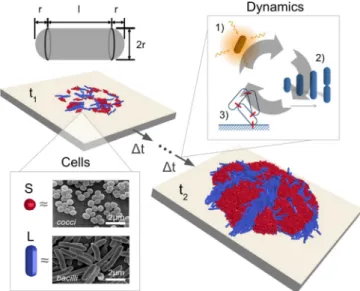
Individual-Based Modeling.Our IbM framework considers micro-bial communities as collections of elongating cells on a hard surface (Fig. 1, times t1 and t2). Cells absorb diffusing nutri-ents from their surroundings to grow and divide, causing the community to expand in space (Fig. 1, “Dynamics”). All cells are represented as capsules of segment length l and radius r (Fig. 1, Top); bacillar and coccal cell shapes are modeled using short (S) or long (L) capsules, whose geometries approximate those of Staphylococcus aureus and E. coli, respectively (Fig. 1, “Cells”) (24, 33). Although simple, these morphologies are ubiq-uitous and frequently found together in bacterial communities (4, 7).
Overall, our model is similar in structure to previous mod-els based on spherical cells (26–28), except that we can now also study communities containing nonspherical cell shapes. Although this extension requires the underlying mathematical formulation to be more detailed, our model is conceptually only incrementally more complex and, therefore, an appropriate min-imum model for investigating the influences of cell shape in
Fig. 1. To simulate the growth of a mixed-species bacterial colony on a hard surface, we use a mixed-morphotype hybrid model. Bacterial cells are represented using rigid elastic capsules of variable length l and fixed radius r (Top Left); coccal and bacillar cells are approximated respectively using long (L) and short (S) capsules (“Cells”). Micrographs depict S. aureus (Top) and Escherichia coli (Bottom) bacteria. Biofilm growth is driven by three primary processes (“Dynamics”): cells absorb nutrients from their surroundings (pro-cess 1) to grow and divide (pro(pro-cess 2), and repulsive interactions between growing cells lead to the expansion of the colony in three dimensions (pro-cess 3). By sequentially updating the cell configuration according to these rules, we simulate the development of colony structure from an initial inocu-lum of cells (time t1) to a mature biofilm (time t2). Micrographs provided by the Public Health Image Library (34) and Rocky Mountain Laboratories (35).
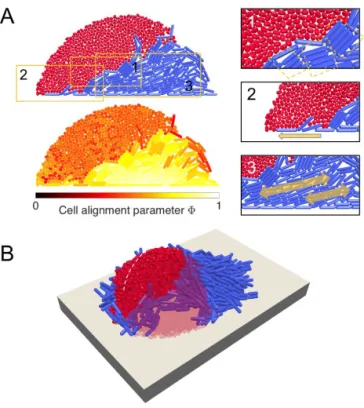
Fig. 2. Cell morphology affects self-organization in simulations of expo-nential biofilm growth. (A) Sections of 2D biofilms grown from 1:1 mixtures of red- and blue-labeled strains form different spatial patterns depending on whether the strains have a coccal (short, S) or rod-like (long, L) morphol-ogy. (B) Volume-weighted histograms of cell z coordinates (P(z)) show that SL mixtures develop a layered structure in both 2D and 3D colonies, with S cells sitting above L cells. In SS and LL control simulations, this layering is absent. (C) Three-dimensional simulations, in which cell positions and ori-entations are no longer confined to the xz plane, produce spatial patterns similar to those shown in 2D. There were 20 simulations per case.
microbial communities. Further details on the framework are provided inSI Appendix.
Cell Shape Drives Spatial Patterning Within Colonies. We first used our model framework to simulate the growth of vertical biofilm sections in two and three dimensions. In the 2D simulations, we used very thin domains so that cells were forced to grow as a monolayer; 3D simulations lift this constraint and allow full freedom of movement. Initial conditions and domain boundary treatments are described in Materials and Methods. As a first approximation, we allowed all cells to grow exponentially at a maximal growth rate µmax, representing a scenario where
nutri-ent perfusion in the biofilm is complete and spatially homoge-neous. Later in this study, we remove this assumption to model competitive interactions between different cell shapes.
To investigate the impact of cell shape on biofilm growth, we grew colonies using three 1:1 combinations of S and L cell shapes, as shown at the top of Fig. 2 (SL, SS, and LL mixtures). We found that different spatial structures emerged, depending on the cell shapes that were present. SL cell mix-tures spontaneously developed a layered structure, with groups of red S cells lying atop blue L cells. By contrast, SS mixtures tended to produce smooth, vertical boundaries between adja-cent strain groups, with no layering. LL colonies produced a third type of spatial patterning, developing fractal-like interdigitations between adjacent cell groups, as reported in previous modeling studies (24, 32).
For these three cases, representative end-state snapshots of 2D colonies are shown in Fig. 2A, whereasMovie S1shows these colonies growing side-by-side. In Fig. 2B, we plot histograms of cell z coordinates for the two strains: here, P(z ) corresponds to the biovolume distribution along the z axis, normalized by total colony volume. This distribution quantifies the tendency for SL colonies to develop layered structures; by contrast, the
NAS
PLUS
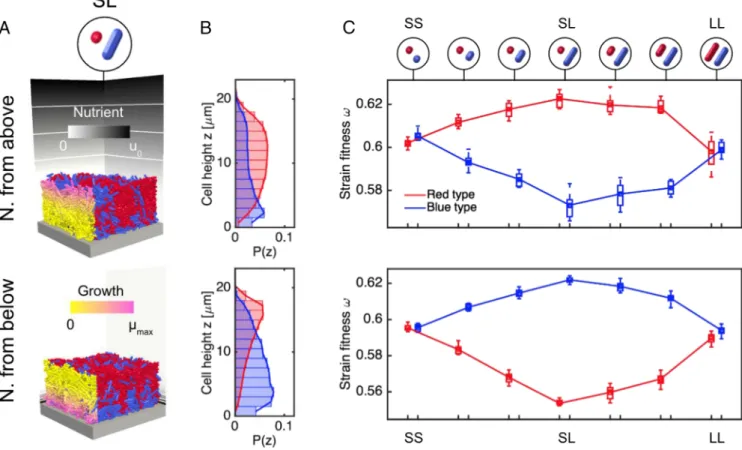
Fig. 3. Cell morphology influences strain fitness within colonies. (A) Competition between different cell shapes is simulated by growing biofilm sections under nutrient-limited conditions. Nutrients are supplied either from above the colony (first row) or from below (second row). Cells on the left side of the colony are colored by their growth rate, showing that rapid cellular growth is limited to a thin layer at the top or at the base of the colony, in the two scenarios, respectively. Contours on the nutrient field (background) correspond to u/u0= 0.25, 0.50 and 0.75. (B) Volume-weighted histograms (P(z)) of
cell heights in nutrient-limited SL colonies show similar layering effects to those created under homogeneous growth conditions, with S cells (red) growing atop L cells (blue). (C) Bar plots of strain fitness show that coccal morphologies outcompete rod-like morphologies in scenarios where nutrients are delivered from above the colony, but the reverse is true when nutrients are delivered from below. There were 10 simulations per case.
vertical strain distributions seen in SS and LL control colonies are identical, confirming the absence of layering. This effect can be reproduced in 3D simulations, where cell centers and axes are not confined to the xz plane (Fig. 2 B and C).
In SI Appendix, we discuss further simulations carried out to interrogate the mechanism of the layering effect (SI Appendix, Figs. S1–S7 and Movie S2). We hypothesize that layering occurs because groups of rod-shaped cells form wedge-like structures, which, guided by the basal surface, collectively burrow beneath groups of coccal cells. The necessary group structure is, in turn, produced by steric interactions between neighboring cells and the basal surface, which produce nematic ordering in rod-shaped cells but not in coccal cells.
We also report tests that verify that the layering effect is robust with respect to changes in simulation boundary conditions (SI Appendix, Fig. S9), relative cell size (SI Appendix, Fig. S7A), simulation parameters such as the rate of division noise injec-tion (SI Appendix, Fig. S7B), and changes in initial cell align-ment (SI Appendix, Fig. S7B). However, we find that layering is completely dependent on the presence of the basal plane, con-firming its importance in the layering mechanism (SI Appendix, Fig. S7B).
Overall, these observations suggest that individual cell shape is capable of driving significant structural changes in the wider biofilm environment—and, in particular, that combina-tions of differently shaped cells can drive the formation of lay-ered structures, as reported previously in multispecies biofilms (36–38).
Shape-Driven Layering Alters Strain Fitness.Next, we examined the consequences of layering phenomena on strain competition within the biofilm environment. Because biofilms are typically characterized as highly heterogeneous environments, systematic differences in the positioning of bacterial strains could lead to significant differences in their fitness, offering a competitive advantage to particular cell morphotypes (39–41).
To examine this hypothesis, we repeated our 2D and 3D biofilm growth simulations under nutrient-limited conditions. Instead of allowing all cells to grow at the same rate as before, we coupled each cell’s growth rate µi to the local concentration
uof a rate-limiting nutrient field, evaluated at that cell’s centroid
pi. As in previous studies (26, 28, 42, 43), we model this coupling
using the Monod equation µi = µmaxu(pi)/(K + u(pi)), where
µmaxand K are the maximum specific cell growth rate and the
uptake saturation constant, respectively. By imposing different boundary conditions on the nutrient reaction-diffusion equation, we created opposing perfusion scenarios: one in which nutrient was supplied from above the colony and another in which sup-ply came from below. In each simulation, we measured the fit-ness of each strain, !strain, by computing the number of division
events per unit time, !strain = log2(Vstrain(tend)/Vstrain(0))/tend.
Here, Vstrain(tend) refers to the total cell volume of a strain at
the endpoint of the simulation tend. The results of these
simu-lations are shown in Fig. 3. Nutrient field parameters are listed inSI Appendix, Table S3; these are chosen so as to create thin growth layers of similar thicknesses in the two perfusion sce-narios. In both cases, the Damk¨ohler number D (the ratio of
nutrient uptake rate to diffusion rate; Materials and Methods) was set to 0.01.
Fig. 3A provides example snapshots of both simulation scenarios, showing colonies grown from 1:1 SL cell mixtures after 12 h of growth. Cells in the bulk are colored by type as before, but cells on the left face of the colony are colored by their growth rate, indicating that rapid cellular growth is limited to a thin layer at the top or at the base of the colony, in the two scenar-ios respectively. In Fig. 3B, we plot histograms of cell heights in these colonies, showing that S and L cell strains still adopt a lay-ered structure when grown together under nutrient-limited con-ditions. InSI Appendix, Fig. S8, we provide corresponding images and histograms for SS and LL mixtures, prepared in the same way. In Fig. 3C, we explore the relationship between cell shape and strain fitness in the two nutrient competition scenarios. Here, we grow colonies not only of SS, SL, and LL cell strain mix-tures but also using mixmix-tures of intermediate cell aspect ratios. The top row of Fig. 3B provides a pictorial representation of the cell shapes used. Between the SS and SL cases, the birth aspect ratio of the blue strain is increased through the values 1.1, 1.5, 2.0, and 3.0. Correspondingly, the fitness of S cells increases at the expense of L cells, up to a maximum at the SL case. Next, between the SL and LL cases, the aspect ratio of the red strain is increased in the same way, and the fitness differential is reduced to ⇠0. When the nutrient conditions are reversed, so too is the strain fitness, this time in favor of L cells.
Importantly, our simulations confirm the hypothesis that strain layering effects can, under idealized conditions, translate into differences in strain fitness. When nutrients are delivered from above the colony, S cells receive preferential nutrient access at the expense of L cells below. S cells are correspondingly afforded an increased growth rate and gain a fitness boost relative to the SS and LL cases where no layering exists. As a result, the number of S cells present in the upper layer of the colony is enhanced, as shown by the cell height histograms in Fig. 3B. In cases where nutrients are delivered from below the colony, the fates of S and L cells in SL mixtures are reversed.
In both cases, we examined the effects of varying the nutrient availability inSI Appendix, Figs. S10 and S11, demonstrating that layering occurs irrespective of nutrient availability, but that this patterning translates into fitness differences only when the nutri-ent supply becomes limiting.Movie S3shows an example of a 2D colony of S and L cells, growing with limited nutrient supply from above.
Experimental Tests of Shape-Driven Patterning. Having shown that cell shape can affect community development and composition with our model, we then sought to test our predictions experi-mentally. Studying cell shape empirically is challenging, because differently shaped strains will typically be physiologically dif-ferent as well, introducing confounding effects. However, the
E. coli mutants recently identified and described by Monds et al.
(44) provide a solution to this impasse. Strains in this library are genetically identical except for a point mutation in the gene cod-ing for the cytoskeletal protein MreB. Critically, these mutations cause substantial and stable changes in cell aspect ratio, with-out significantly affecting exponential cell growth rates, which allows cells of different shapes to be cultured together in set proportions. [For example, the specific growth rate µ is 0.519 ± 0.015h 1for the ancestral (WT) strain and 0.516 ± 0.007 h 1 for the mutant REL606mreB A53T (44).]
To test the predictions of our model in vitro, we labeled the strains with fluorescent proteins and grew bacterial colonies using binary combinations of three different E. coli strains: the WT REL606 strain (referred to here as WT) and mutant strains REL606mreB A53S (AS) and REL606mreB A53K (AK). Cells of these three strains exhibit mean aspect ratios of 4.44, 3.55, and 2.50 respectively (44); Fig. 4, Inset shows individual cells of each
these strains for visual comparison. Colonies were grown using each possible pairing of these three strains, labeled with red flu-orescent protein (RFP) or GFP markers, before being imaged using epifluorescence and confocal laser scanning microscopy. The images shown are in pseudocolor, with the fluorescence sig-nal from GFP-labeled cells shown in blue. Further details are provided in Materials and Methods.
Cell Morphology Drives Patterning in E. coli Colonies. The E.
coli colonies reproduced several key predictions of our model.
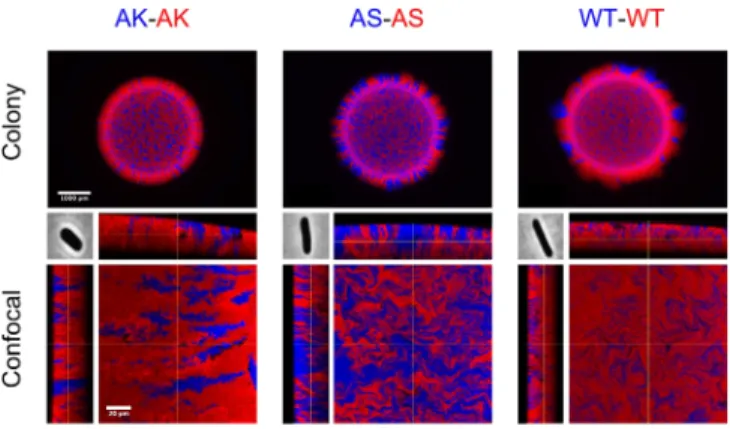
Firstly, colonies composed of only one morphotype (AK-AK, AS-AS, WT-WT) showed that degree of interstrain (red-blue) mixing is strongly dependent on cell aspect ratio. Fig. 4 shows epifluorescent images of complete colonies (top row) and con-focal images of colony edge sections (bottom row). Similarly to Fig. 2 (SS column), AK-AK colonies show smooth interstrain boundaries, whereas WT-WT mixtures reproduce the fractal-like interdigitations seen in the model (Fig. 2, LL column), again recapitulating the findings of previous studies (24). The diate AS cell shape (Fig. 4, center column) produces an interme-diate level of mixing, generating fractal-like patterns as in the WT case, but with a lower fractal dimension. InSI Appendix, Fig. S12, we show additional colony images for other shape com-binations, demonstrating that cell shape can affect the composi-tion of the colony edge.
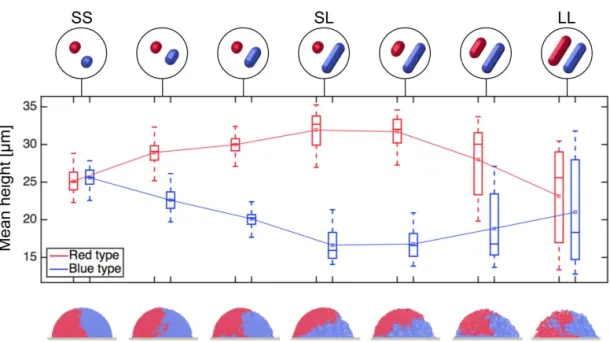
Our experiments also verify that mixing long and short cell strains together can result in the emergence of layered structures, with shorter cells lying on top of longer cells. In Fig. 5A, we show that WT cells (shown in blue) displace shorter AK cells (red) from the base of the colony. This effect is visible both from side projec-tions of confocal z-stacks (Fig. 5A, top row) and from horizontal slices taken at increasing depths in the colony. Because nutrients are supplied from the agar below the colony, we also see an over-growth of rod cells at the colony base, as predicted by the second modeling scenario shown in Fig. 3. Reversing the color labels pro-duces the same result (Fig. 5B), demonstrating that layering is not an artifact produced by the fluorescent labeling scheme.
Fig. 4. Fluorescently labeled E. coli strains with different cell morphologies
are grown together in solid culture, as an experimental test of morphotype-patterning relationships. The top row compares colonies composed of WT E. coli with those of actin homolog mutants mreBA53S(AS) and mreBA53K
(AK), which differ in cell aspect ratio (Center Inset) but grow at the same rate. At higher magnification, representative confocal images of edge sec-tions of each colony are shown alongside orthogonal projecsec-tions (bot-tom row). These images corroborate the predictions of our simulations: WT colonies show complex, fractal-like mixing between red and blue cell groups, whereas AK colonies show smoother group boundaries extending vertically through the colony. AS colonies display intermediate behavior, showing patterning of lower fractal dimension than in WT colonies. Images were taken after 48 h of growth in each case. (Scale bars: top row, 1 mm; bottom row, 20 µm.) Phase-contrast cell images (of width 3.5 µm) were taken with permission from ref. 44.
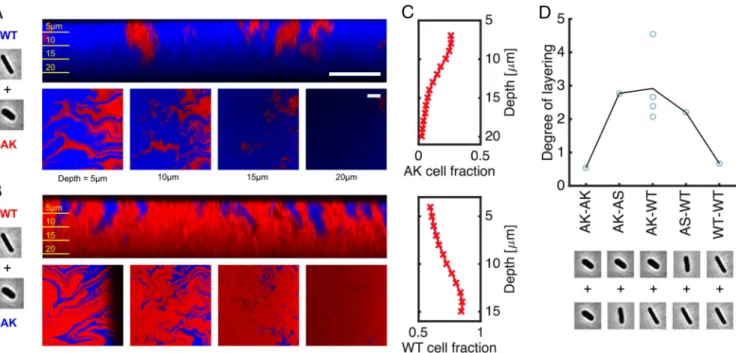
Fig. 5. Mixed-morphotype colonies reproduce the layering phenomena predicted by simulations. (A) Pseudocolor confocal images show that GFP-labeled
WT E. coli (shown in blue) are able to burrow beneath shorter, wider AK mutants (red), leading to the WT cells’ enrichment at the base of the colony. (B) The same is true when fluorescent labels are reversed. Images correspond to vertical colony sections (A and B, top row) and horizontal slices taken at successive depths (A and B, bottom row). (C) We quantify layering effects by measuring the volume fraction of GFP-labeled cells as a function of depth in the colony, using automated image segmentation (Materials and Methods). (D) The gradients of these traces, corresponding to the percentage gain (or loss) of GFP signal per unit depth, are compared for various binary shape combinations. Cell micrographs in A, B, and D are taken with permission from ref. 44. (Scale bars: 20 µm.) Confocal images and data taken after 48 h of growth.
In Fig. 5C, we use automated image analysis to quantify the layering effect. By counting the number of blue pixels in each layer of the stack (Materials and Methods), we estimate the vol-ume fraction of AK (top row) or WT (bottom row) cells as a function of depth in the colony. These traces show an approxi-mately linear reduction in the AK cell fraction (and correspond-ing increase in WT fraction) within the first 15 µm below the colony surface, which is in agreement with the cell arrangements predicted in Figs. 2 and 3.
Finally, we repeated this analysis with images taken from colonies of other morphotype combinations, including the con-trol colonies shown in Fig. 4. In each case, we quantified inter-strain layering using the average slope of the GFP fraction traces, such as those shown in Fig. 5C, using linear fitting. Example image segmentations, along with the complete set of GFP frac-tion traces, are provided inSI Appendix, Fig. S13. The degree of layering for each type of mixture is shown in Fig. 5D. As pre-dicted by the model, we observe a strong relationship between differences in cell shape and the degree of layering in the colony across these different genotypes. Our experiments, therefore, support multiple predictions of our model (Figs. 4 and 5). More-over, this support came without needing to tune conditions; we performed the experimental tests after the modeling. This observation suggests that the effects we report in this study are robust to experimental conditions and may be common to many existing experimental systems that use mixtures of different cell shapes.
Discussion
We have used simulations and experiments to show that cell shape can be a determinant of both spatial patterning and com-position within a microbial community. In particular, we find that mixtures of rod-shaped and coccal cells can produce layered colony structures, as observed previously in both biotic and abi-otic environments (36, 45). This result extends our
understand-ing of the functional value of cell shape, both as a competitive phenotype in the biofilm context and as a means for bacteria to influence their environment through collective action.
From an evolutionary perspective, our work suggests that the biofilm environment may select for particular cell shapes in spe-cific environments because of the ways in which they collec-tively influence biofilm architecture. Given the predominance of the biofilm environment for microbial life (18, 19), any selective effect produced might be expected to have a strong impact on the evolution of bacterial morphology. In natural biofilms, rapid cell growth is often limited to the upper regions of a biofilm (28, 41), which will select for coccal morphologies. Indeed, this selective pressure provides a rationale for morphological transitions asso-ciated with biofilm development (46–48) and may partly explain the ubiquity of the coccal morphology despite disadvantages, such as decreased nutrient absorption area (7).
In reality, microbial communities are far more intricate than the description used in our simulations. Like all mod-els, our framework makes simplifying assumptions: we deliber-ately neglect the role of cell motility, detachment, and shear forces from the liquid surrounding the colony (42, 43, 49). Our representation of EPS secretions—a hallmark of microbial biofilms—is purely implicit, whereas the inclusion of explicit EPS particles has been shown to influence colony structure in previ-ous studies (25, 41). Our model also neglects adhesive interac-tions, which could inhibit the layering effect if coccal cells were irreversibly attached to the basal surface.
However, these omissions allow a degree of realism to be traded for additional control and tractability. Rather than attempting to reproduce the exact dynamics of colony growth, our simulations instead predict the rich dynamics that can emerge when nonspherical cell shapes are introduced to existing modeling paradigms (28, 50). The fact that these predictions are corroborated by our experiments demonstrates the usefulness of this approach.
Our predictions highlight the need for further empirical and theoretical studies to examine mixed-shape colonies in more detail, treating cell shape as a physical variable instead of an incidental attribute. Bacterial strains such as those developed by Monds et al. (44) will be instrumental to this process, because they allow cellular shape to be varied in isolation of other con-founding variables. Likewise, investigating how the predictions of previous theoretical studies are altered by the inclusion of mor-phological variability will help fully characterize the influences of cell shape in microbial communities. More generally, our work may also suggest new roles for shape and growth anisotropy in other biological systems—ultimately, shape may prove to be an important physical parameter not just for collectives of microbes but also for the morphogenesis of developing tissues and cancer tumors (51, 52).
Finally, although our study considers only antagonistic interac-tions between microbes, the patterning mechanisms we discuss could also influence more cooperative relationships. Metabolic exchanges between species are often associated with a layered structure in biofilms (36–38, 53–55), which suggests that shape-mediated self-organization could be used by experimenters to promote desirable colony structures. Furthermore, our results show that cell shape can affect the degree of strain mixing within the colony, which could in turn be used to control selective pressures for or against certain social strategies. For instance, because mixtures of coccal cells produce less genetic mixing than mixtures of rod-shaped cells, cooperative strategies such as enzyme secretion may become more evolutionarily stable (28). Our findings could therefore help to engineer more productive or stable synthetic microbial consortia, by selecting for commu-nity architectures that affect the interactions between strains and species (14).
Conclusions
Microorganisms of different shapes commonly grow together in their dense and genetically diverse communities, known as biofilms. We have used modeling and experiments to study the impact of cell morphology on biofilm architecture and competi-tion. By building a simulation framework incorporating different cell shapes, we have predicted, described, and examined mecha-nisms of self-organization and spatial patterning driven by micro-bial morphology. We have also documented the same patterns emerging in real bacterial colonies. Our work suggests that cell shape is a major neglected determinant of patterning and evolu-tionary fitness within microbial communities.
Materials and Methods
IbM Simulations. Simulations were performed using 2D and 3D domains. In both cases, domains were surrounded by hard walls to approximate repul-sive mechanical forces from the basal surface and surrounding sections of the biofilm. InSI Appendix, Fig. S9, we show that the hard boundary approx-imation reproduces the effects of periodic boundary conditions, which are more realistic but computationally more demanding. In 2D simulations, the centroids and axes of 3D capsules were confined to a plane of base length Lx = 300 µm, whereas 3D simulations used a cuboidal domain with base dimensions Lx= Ly = 40 µm. Simulations were initialized using an inocu-lum of cells arranged randomly on the base of the domain, with cell axis vectors drawn randomly in the 3D case. Each inoculum consisted of a 1:1 mixture of two bacterial strains, marked with red and blue color labels for lineage tracking.
In total, ⇡3,000 model simulations were performed on two NVIDIA Tesla C2075 6GB GDDR5 PCIe workstation graphics cards for simulations without
nutrient fields and on two NVIDIA Quadro K5000 4GB GFX graphics card for simulations including them. To account for the stochastic noise terms in our model (SI Appendix), we increased simulation sample sizes until our measurements converged, using the convergence criterion
||hXiN hXiN 1||l2/||hXiN||l2< ✏TOL, [1]
where hXiNdenotes a mean vector of measurements for a sample size N, and ✏TOLis a convergence tolerance set to 5%; ||·||l2represents the Euclidean norm operation.
Simulations were visualized and checked using Paraview 4.3.1, and the postprocessing of results was carried out using Matlab 2015a. Further details on the IbM framework, including model equations and assumptions, are provided inSI Appendix.
Bacterial Strains and Plasmids. E. coli REL606 is the parent (WT) strain (56), referred to here as A53. A53K (REL606mreBA53K) and A53S (REL606mreBA53S)
were previously constructed from REL606 with the respective nonsynony-mous mutation at the 53rd amino acid residue of the MreB protein (44). A53K exhibits the shortest and widest cellular morphology, and A53S is intermediate, compared with A53. Importantly, all three strains share the same specific growth rate and differ only marginally in lag phase time (44). We introduced plasmids pmaxRFP or pmaxGFP (Amaxa/Lonza) into all three strains for epifluorescence and confocal microscopy. For routine cul-turing in liquid, cells were grown shaking at 250 rpm in LB (Thermo-Fisher Scientific) at 37 C. For plate cultures, cells were grown on Davis minimal (DM) medium (57), supplemented with 15 g · L−1agar and either glucose
(175 µg · mL−1) or lactose (210 µg · mL−1) as previously described (44) at
37 C. All media were supplemented with kanamycin at 50 µg · mL−1to
maintain plasmids.
Overnight cultures were serially diluted in PBS, mixed together in a 1:1 ratio, and then spotted in either 1- or 10-µL volumes on the sur-face of DM plates. We observed no significant difference between glu-cose or lactose supplementation; data reported in this study are from glucose-supplemented plates spotted at 1-µL volume. For each combina-tion of cell strains and fluorescent labels, control experiments using reverse labeling were also carried out. Two days following inoculation, mixed-culture colonies were imaged by epifluorescence and confocal laser scan-ning microscopy as previously described (41, 57).
Confocal Image Analysis. Following collection, confocal image stacks were enhanced in FIJI by setting pixel saturation to 1% and by normalizing sig-nal to the full intensity range. Images were then segmented using the Matlab bioformats plugin, according to the following procedure. For each stack, incomplete or excessively dark images were excluded by removing any layer in which more than 1% of pixels had intensities less than 12% of the maximum, measured in composite grayscale images created by combin-ing red and green channel data. These thresholds were chosen manually to optimize the segmentation accuracy. To ensure a sufficient number data points for curve fitting later on, confocal stacks with fewer than six images remaining were removed from the analysis outright. In each of the remaining images, the number of GFP-labeled cells was estimated by counting the number of pixels in the green channel data with intensi-ties above a threshold, computed for each individual layer using Otsu’s method (58).
ACKNOWLEDGMENTS. We thank Carolina Tropini for suggesting the use
of mutant E. coli cells and Kerwyn Huang for providing the strains. We also thank NVIDIA donating the two Tesla C2075 graphics cards and Michel Quintard for providing access to the computing resources at Insti-tut de M ´ecanique des Fluides de Toulouse. We thank Tim Rudge and Niall Murphy for their help with CellModeller and Mack Durham, Jonas Schluter, Dianne Newman, and two anonymous reviewers for helpful comments on the manuscript. W.P.J.S. is supported by an Engineering and Physical Sci-ences Research Council studentship (Grant EP/G03706X/1), and K.R.F. is sup-ported by European Research Council Grant 242670. Both W.P.J.S. and K.R.F. received funding from the Calleva Research Centre for Evolution and Human Science (Magdalen College, Oxford).
1. Starr MP, Skerman VBD (1965) Bacterial diversity: The natural history of selected mor-phologically unusual bacteria. Annu Rev Microbiol 19:407–454.
2. Vos P, et al. (2011) Bergey’s Manual of Systematic Bacteriology: The Fir-micutes (Springer Science & Business Media, Dordrecht, The Netherlands), Vol 3.
3. Cabeen MT, Jacobs-Wagner C (2005) Bacterial cell shape. Nat Rev Microbiol 3(8): 601–610.
4. Siefert JL, Fox GE (1998) Phylogenetic mapping of bacterial morphology.
Microbiol-ogy 144 (Pt 10):2803–2808.
5. Tamames J, Gonzalez-Moreno M, Mingorance J, Valencia A, Vicente M (2001) Bring-ing gene order into bacterial shape. Trends Genet 17(3):124–126.
6. Kysela DT, Randich AM, Caccamo PD, Brun YV (2016) Diversity takes shape: Under-standing the mechanistic and adaptive basis of bacterial morphology. PLoS Biol 14(10):e1002565.
7. Young KD (2006) The selective value of bacterial shape. Microbiol Mol Biol Rev 70(3):660–703.
8. Justice SS, Hunstad Da, Cegelski L, Hultgren SJ (2008) Morphological plasticity as a bacterial survival strategy. Nat Rev Microbiol 6(2):162–168.
9. Young KD (2004) Bacterial shape. Mol Microbiol 49(3):571–580.
10. Young KD (2007) Bacterial morphology: Why have different shapes? Curr Opin
Micro-biol 10(6):596–600.
11. Young KD (2010) Bacterial shape: Two-dimensional questions and possibilities. Annu
Rev Microbiol 64:223–240.
12. Nakamura S, Adachi Y, Goto T, Magariyama Y (2006) Improvement in motion effi-ciency of the spirochete Brachyspira pilosicoli in viscous environments. Biophys J 90(8):3019–3026.
13. McLoughlin K, Schluter J, Rakoff-Nahoum S, Smith AL, Foster KR (2016) Host selection of microbiota via differential adhesion. Cell Host Microbe 19(4):550–559. 14. Coyte KZ, Schluter J, Foster KR (2015) The ecology of the microbiome: Networks,
competition, and stability. Science 350(6261):663–666.
15. Wolcott RD, Ehrlich GD (2008) Biofilms and chronic infections. JAMA 299(22): 2682–2684.
16. Stewart PS, Costerton JW (2001) Antibiotic resistance of bacteria in biofilms. Lancet 358(9276):135–138.
17. Klapper I, Dockery J (2010) Mathematical description of microbial biofilms. SIAM Rev 52(2):221–265.
18. Costerton JW, Lewandowski Z, Caldwell DE, Korber DR, Lappin-Scott HM (1995) Microbial biofilms. Annu Rev Microbiol 49:711–745.
19. Hall-Stoodley L, Costerton JW, Stoodley P (2004) Bacterial biofilms: From the natural environment to infectious diseases. Nat Rev Microbiol 2(2):95–108.
20. Volfson D, Cookson S, Hasty J, Tsimring LS (2008) Biomechanical ordering of dense cell populations. Proc Natl Acad Sci USA 105(40):15346–15351.
21. Boyer D, et al. (2011) Buckling instability in ordered bacterial colonies. Phys Biol 8(2):026008.
22. Cho H, et al. (2007) Self-organization in high-density bacterial colonies: Efficient crowd control. PLoS Biol 5(11):e302.
23. Copeland MF, Weibel DB (2009) Bacterial swarming: A model system for studying dynamic self-assembly. Soft Matter 5(6):1174–1187.
24. Rudge TJ, Federici F, Steiner PJ, Kan A, Haseloff J (2013) Cell polarity-driven instabil-ity generates self-organized, fractal patterning of cell layers. ACS Synth Biol 2(12): 705–714.
25. Ghosh P, Mondal J, Ben-Jacob E, Levine H (2015) Mechanically-driven phase separa-tion in a growing bacterial colony. Proc Natl Acad Sci USA 112(17):E2166–E2173. 26. Picioreanu C, van Loosdrecht MCM, Heijnen JJ (1998) Mathematical modeling of
biofilm structure with a hybrid differential-discrete cellular automaton approach.
Biotechnol Bioeng 58(1):101–116.
27. Kreft J-U (2004) Biofilms promote altruism. Microbiology 150(Pt 8):2751–2760. 28. Nadell CD, Foster KR, Xavier JB (2010) Emergence of spatial structure in cell groups
and the evolution of cooperation. PLoS Comput Biol 6(3):e1000716.
29. Schluter J, Foster KR (2012) The evolution of mutualism in gut microbiota via host epithelial selection. PLoS Biol 10(11):e1001424.
30. Nadell CD, et al. (2013) Cutting through the complexity of cell collectives. Proc Biol
Sci 280(1755):20122770.
31. Estrela S, Brown SP (2013) Metabolic and demographic feedbacks shape the emer-gent spatial structure and function of microbial communities. PLoS Comput Biol 9(12):e1003398.
32. Storck T, Picioreanu C, Virdis B, Batstone DJ (2014) Variable cell morphology approach for individual-based modeling of microbial communities. Biophys J 106(9): 2037–2048.
33. Nakayama M, Shigemune N, Tsugukuni T, Tokuda H, Miyamoto T (2011) Difference of EGCg adhesion on cell surface between Staphylococcus aureus and Escherichia coli visualized by electron microscopy after novel indirect staining with cerium chloride. J
Microbiol Methods 86(1):97–103.
34. Matthew J, Arduino JC (2007) Staphylococcus aureus SEM (image 6486). Accessed July 7, 2016.
35. Rocky Mountain Laboratories, NIAID, NIH (2006) Escherichia coli SEM. Accessed July 7, 2016.
36. Christensen BB, Haagensen JAJ, Heydorn AJ, Molin S (2002) Metabolic commensal-ism and competition in a two-species microbial consortium. Appl Environ Microbiol 68(5):2495–2502.
37. Hansen SK, Rainey PB, Haagensen JAJ, Molin S (2007) Evolution of species interactions in a biofilm community. Nature 445(7127):533–536.
38. Elias S, Banin E (2012) Multi-species biofilms: living with friendly neighbors. FEMS
Microbiol Rev 36(5):990–1004.
39. Wimpenny J, Manz W, Szewzyk U (2000) Heterogeneity in biofilms. FEMS Microbiol
Rev 24(5):661–671.
40. Nadell CD, Xavier JB, Foster KR (2009) The sociobiology of biofilms. FEMS Microbiol
Rev 33(1):206–224.
41. Kim W, Racimo F, Schluter J, Levy SB, Foster KR (2014) Importance of positioning for microbial evolution. Proc Natl Acad Sci USA 111(16):E1639–E16347.
42. Picioreanu C, Van Loosdrecht MCM, Heijnen JJ (2000) Effect of diffusive and convec-tive substrate transport on biofilm structure formation: a two-dimensional modeling study. Biotechnol Bioeng 69(5):504–515.
43. Kreft JU, Wimpenny JWT (2001) Effect of EPS on biofilm structure and function as revealed by an individual-based model of biofilm growth. Water Sci Technol 43(6):135–141.
44. Monds RD, et al. (2014) Systematic perturbation of cytoskeletal function reveals a linear scaling relationship between cell geometry and fitness. Cell Rep 9(4): 1528–1537.
45. Nava GM, Friedrichsen HJ, Stappenbeck TS (2011) Spatial organization of intestinal microbiota in the mouse ascending colon. ISME J 5(4):627–638.
46. Serra DO, Richter AM, Klauck G, Mika F, Hengge R (2013) Microanatomy at cellular resolution and spatial order of physiological differentiation in a bacterial biofilm.
MBio 4(2):e00103–e00113.
47. Bergkessel M, Basta DW, Newman DK (2016) The physiology of growth arrest: Uniting molecular and environmental microbiology. Nat Rev Microbiol 14(9):549–562. 48. Hendrickx L, Hausner M, Wuertz S (2003) Natural genetic transformation in
monocul-ture Acinetobacter sp. strain BD413 biofilms. Appl Environ Microbiol 69(3):1721–1727. 49. Picioreanu C, et al. (2007) Microbial motility involvement in biofilm structure
forma-tion - a 3D modelling study. Water Sci Technol 55(8-9):337–343.
50. Xavier JB, Foster KR (2007) Cooperation and conflict in microbial biofilms. Proc Natl
Acad Sci USA 104(3):876–881.
51. Heisenberg CP, Bella¨ıche Y (2013) Forces in tissue morphogenesis and patterning. Cell 153(5):948–962.
52. Basan M, Elgeti J, Hannezo E, Rappel W-J, Levine H (2013) Alignment of cellular motil-ity forces with tissue flow as a mechanism for efficient wound healing. Proc Natl Acad
Sci USA 110(7):2452–2459.
53. Sekiguchi Y, Kamagata Y, Nakamura K, Ohashi A, Harada H (1999) Fluorescence in situ hybridization using 16S rRNA-targeted oligonucleotides reveals localization of methanogens and selected uncultured bacteria in mesophilic and thermophilic sludge granules. Appl Environ Microbiol 65(3):1280–1288.
54. Wilmes P, et al. (2009) Natural acidophilic biofilm communities reflect distinct organ-ismal and functional organization. ISME J 3(2):266–270.
55. Brenner K, Arnold FH (2011) Self-organization, layered structure, and aggregation enhance persistence of a synthetic biofilm consortium. PLoS One 6(2):e16791. 56. Lenski RE, Rose MR, Simpson SC, Tadler SC (2016) Long-term experimental evolution
in Escherichia coli. I. Adaptation and divergence during 2,000 generations. Am Nat 138(6):1315–1341.
57. Kim W, Levy SB, Foster KR (2016) Rapid radiation in bacteria leads to a division of labour. Nat Commun 7:10508.
58. Otsu N (1975) A threshold selection method from gray-level histograms. Automatica 11(285-296):23–27.
Supporting Information
Movie S1. In this movie, we compare growing 2D colonies composed of SL, SS, and LL cell shapes (top, middle, and bottom rows, respectively), as described
in Fig. 2. The movie was prepared using Paraview visualization software.
Movie S1
Movie S2. This movie shows a growing 2D colony composed of S (red) and L (blue) cell shapes, demonstrating the development of a wedge-shaped L cell
group, as described in SI Appendix, Fig. S1. The movie was prepared using Paraview visualization software.
Movie S2
Movie S3. In this movie, we show the development of 2D colony composed of S (red) and L (blue) cell shapes, growing under limited nutrient conditions.
As described in Fig. 3 and SI Appendix, Fig. S10, shape-driven layering leads to a growth advantage for red S cells, whose nutrient access is improved by being higher up in the colony. The movie was prepared using Paraview visualization software.
Other Supporting Information Files
SI Appendix (PDF)Supporting Information
SI Text
Nematic ordering drives layering.To investigate the
mecha-nism of cell layering in SL shape mixtures, we grew 2-D colonies from an inoculum of two cells placed a fixed dis-tance apart. We also removed the lateral mechanical walls at
x= 0, Lxto exclude any influence on nematic alignment, so
that colony expansion would be restricted only by the basal surface. Simulations using this simplified setup suggest that layering is driven by several interacting processes, summarized in FigureS1.
Fig. S1. Layering in SL mixtures is driven by the formation of wedge-like arrangements
of L cells, which force S cells upward. A: 2-D simulations show that wedges result from steric interactions between cells, which produce high levels of cell-cell and cell-plane alignment in L cells, but not S cells. The tendency for L cells to align together has several effects that are absent in S cell groups, viz: rod cells align in cohesive, staggered files (Box 1), which are more robust to growth forces than unaligned spherical cells. Rods near the base of the colony (Box 2) are forced into alignment with the substrate plane, forming a narrow wedge tip at the red-blue clonal boundary. Rod cells to the right of this tip grow laterally (Box 3), driving the wedge under the red cell group. B: These effects are also reproduced in 3-D simulations. Cell growth rates are homogeneous, as in Figure 2.
In Figure S1-A we show two end-state snapshots of the same 2-D SL colony, coloring cells either by their type or by the value of a local pairwise orientational order parameter , adapted from previous studies [1]. i is defined as
i= J
ÿ
jœJ
ci,jÏi,j, [1]
where Ïi,j = 1 ≠ 2fiarccos |ˆai· ˆaj| measures the degree of
alignment between a pair of cell orientation vectors ˆai
and ˆaj, and ci,j is a Gaussian weighting factor given by
ci,j= exp
1
≠|pi≠pj|
2’2
2
, where pi and pj are the respective
cell positions. J refers to the set of neighboring cells within range 2’ of the focal cell i, where ’ = 5 µm. The value of measured at a focal cell increases when neighboring cells become aligned with that cell, reaching 1 when all neighbors are perfectly aligned.
As shown in FigureS1-A, steric interactions between neigh-boring cells in the red S-cell group are weak, and nematic ordering is correspondingly low. The lack of nematic ordering means that the group expands isotropically, as cells are not elongating or dividing in any particular direction. As a result, groups of S cells form smooth, symmetric heaps. By contrast, the level of nematic ordering in groups of L cells is very high, due to significant steric interactions between neighboring cells, as reported in several previous publications [1–3]. As a result, the growth of the colony is initially highly anisotropic, and the group becomes asymmetric and directional. This growth cell growth anisotropy has been reported previously in both experimental [4] and theoretical studies [5,6].
We propose that the different group structures created by S and L cell shapes interact to produce layered biofilm architectures. The flatter, directed L cell groups form wedge-like structures that can slide underneath S cell groups, driving the latter upwards, as shown in FigureS1-A-1 and Movie S2. The basal plane is a vital component of this process: it prevents S cells from being displaced downwards, and increases the degree of nematic ordering in L cells close to the plane, redirecting L group growth into the S group. As shown in Figure S1-A-2, L cells are able to burrow beneath S cells because their orientations are templated to this plane: through nematic ordering, L-cell growth remains concertedly lateral, whereas S cells rapidly lose any co-planar orientation and are easily displaced upwards. Figure S1-A-3 shows that L cells behind the leading edge of the wedge also assist the layering process by providing an expansion force to drive the tip sideways under the S group. Similar behavior is observed in analogous 3-D simulations, as shown in FigureS1-B.
Variation of layering with cell shape differential.Further tests
support this mechanistic description of colony layering. In Figures S2andS3, we examine how layering, measured by the difference in mean heights for red and blue cells, varies in time as the colony grows, and as a function of the initial spacing between the two strains. We show that strain height differentials always develop at the point of collision between groups of differently-shaped cells, suggesting that layering is the result of interactions occurring at the group level. FigureS4 shows that the results of the simplified 2-D setup are replicated in 3-D, and Figure S5demonstrates a smooth relationship between layering and cell shape difference.
Layering requires collective group structure.We also report
L-cell group is artificially disrupted by random mixing, which temporarily removes the height differential (FigureS6). After mixing, slow recovery of the height differential coincides with the reformation of group structure. If cell layering emerged from interactions between individual S and L cells, then the height differential would be expected to strongly increase following mixing, as this would greatly increase the number of individual contacts between S and L cell shapes. Instead we see the opposite effect, again supporting the hypothesis that sorting results from strain group interactions.
Robustness of layering effects.FigureS7shows that the
lay-ering effect is robust with respect to changes in relative cell size (FigureS7-A), to simulation parameters such as the rate of division noise injection (FigureS7-B), and to changes in initial cell alignment (FigureS7-B). However, we find that layering is completely dependent on the presence of the basal plane (FigureS7-B).
Other shape mixtures.Our mechanistic description of the
group interactions leading to layering can also explain our observations about patterns formed by SS and LL shape mix-tures (shown in Figure 2). In SS colonies, a smooth vertical boundary is formed because cell orientations are unordered, so that growth forces are not exerted against the neighbor-ing group in a concerted manner. By contrast, when L cell groups meet, neighboring cells groups concertedly grow into one another, leading to fractal-like interdigitations [7].
From these findings, we conclude that cell layering is an emergent patterning effect driven by interactions between differently-shaped cell groups. Our model predicts that groups of S and L cell shapes develop contrasting morphologies: col-lections of S cells expand evenly to form round groups, whereas L cells form more directed groups that lie flatter on surfaces.
Mechanical boundary conditions.The simulation domains
shown in Figures 2 and 3 are bounded by hard walls on the bottom and sides, which represent the constraining forces imposed by the basal surface and surrounding sections of the colony. In the latter case, the hard wall assumption is expected to introduce boundary artifacts, because a) cell movement is blocked altogether rather than being simply constrained, and b) rod cells template their alignment to the vertical walls as they would to the horizontal surface.
Accordingly, we used the precaution of excluding cells close to side walls from our analyses (cells within 50 µm of a side wall in the 2-D case, and within 2 µm in 3D). We also repeated walled simulations using periodic boundary conditions (Fig-ureS9), which recreate the lateral compressive forces without using hard walls. We found that layering dynamics in periodic simulations were very similar to those in Figure 2.
Further, the simulations described in FiguresS1-S7were carried out without using lateral walls, eliminating potential boundary effects. As shown in Figures S1 and S4, these simulations recreate the same patterning effects as seen in the bounded simulations in Figure 2, and produce an analogous layering effect – implying that hard boundaries do not exert a strong influence on the patterning dynamics.
SI Materials and Methods
Here we describe the physical basis for our IbM frame-work. The model is a hybridization of CellModeller, a
high-performance open-source bacterial physics engine [7,8], and FEniCS, a finite element modeling library [9,10], joined using a custom python interface. The source code for this frame-work is available online [11]; tables of model variables and parameters are provided in Tables S2andS3respectively.
Bacterial cell shapes.Together, groups of capsule cells
com-prise the structure of simulated colony, shown growing on a surface in Figure 1 (center). Each cell is represented by a rigid, elastic capsule, having fixed radius r, variable segment length
l, position p = (px, py, pz)€, and orientation ˆa = (ax, ay, az)€.
Cells are assumed to be immotile, moving only as a result of elastic repulsion. We model extracellular polymeric substances, which behave as viscous fluids on cellular growth timescales [12], by overdamping cell motion.
The capsule representation allows cell shape to be parame-terized using a single number: the aspect ratio AR = 1 + l/2R. S-type cells have an initial aspect ratio AR0= 1.1, increasing
to a final value ARf = 1.7 at division, whereas L-type cells
have AR0 = 3.0 and ARf = 5.7. Perfectly spherical cells
(AR0 = 1.0) lack a principal axis, which we use to compute
spatial relationships between cells. As such, we approximate spherical morphologies with “pseudo-spherical” capsules of
AR0= 1.1.
Colony growth dynamics.We assume colony growth to be
driven by three processes: nutrient diffusion and uptake, cell growth and division, and mechanical interactions between cells (Figure 1, ‘Dynamics’, steps 1, 2, and 3 respectively). To model the dynamics of these processes, we assume biomass accumulation to be the single dominant timescale, so that mechanical and chemical relaxation can be uncoupled from the growth scheme [13,14]. This allows the state of the model to be updated in three consecutive stages for each simulation timestep:
1. Computing the nutrient field to pseudo-steady state, given the current cell configuration;
2. Growing and dividing cells, given local nutrient concen-trations;
3. Computing cell movement using an energy optimization method, given a non-equilibrium cell configuration. Here we discuss equations and parameters relating to each of these steps.
Nutrient fields.To compute the nutrient field u = u(x, y, z) for
a given cell configuration [p1, . . . ,pN], we solve the
reaction-diffusion equation (RDE)
DÒ2u= 1 “flµmax 1 u u+ K 2 Ï(p1, . . . ,pN), [2]
in dimensionless form, in keeping with previous studies [15,16]. Here, D, “, fl, µmax, K and Ï correspond to the nutrient
diffu-sivity, the biomass yield per unit solute, the biomass density, the maximum specific nutrient uptake rate, the half-saturation concentration, and the local cell volume fraction, respectively. RDE solution behavior is governed by two dimensionless pa-rameter groupings: the Damköhler number D = flµl2/Du
0“,
and the saturation number ÷ = K/u0, where u0represents the
nutrient concentration in the bulk liquid above the colony. So-lutions to the RDE are approximated with Newton’s method,
implemented using the finite element library FEniCS [10]. So-lutions are evaluated on custom-made meshes with a mesh parameter of hn, and using a solver tolerance ‘n. To
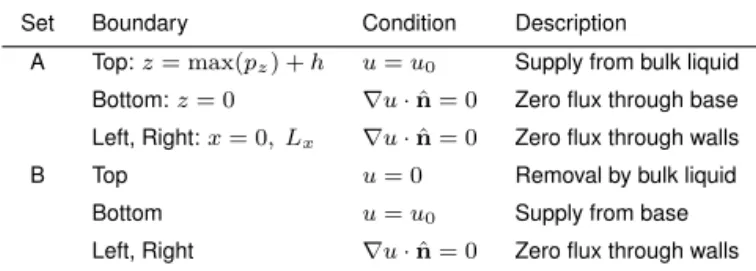
simu-late different colony perfusion regimes, we ran biofilm growth simulations using two sets of boundary conditions, given in TableS1.
Cell growth and division.Each cell’s volume Viincreases
expo-nentially through elongation, from initial volume V0, according
to the equation ˙Vi = µiVi. Cell volumes are updated
itera-tively using the discretized form V = µiVi t, where t
represents the simulation timestep and µithe cell growth rate.
Cells divide lengthwise into two identical daughter cells once they reach volume 2V0 + ›V, where ›V represents uniform
random noise in the cell cycle. Each daughter’s axis vector
ai is perturbed slightly by a noise term with weight ›a, to
represent spatial imperfections in the division process. A cell’s growth rate is coupled via a Monod equation to the local concentration of the nutrient field u, evaluated at the cell’s center pi, so that µi= µmaxu(pi)/(K + u(pi)). The
parame-ters µmaxand K have the same value for all cells, so that any
two cells experiencing the same nutrient concentration grow at the same rate independent of their shape.
Cell movement.Following the cell growth phase, the cell
con-figuration is returned to a quasi-stationary mechanical equilib-rium using a energy minimization algorithm. Any pair of cells whose surfaces are within 0.01 µm of each other are deemed to be overlapping, and therefore subject to mutual repulsion. Overlaps between neighboring cells are identified and summa-rized in a contact matrix A and a distance vector d, along with a regularizing matrix M representing the energetic cost of cell movement. Regularization is weighted by a scalar factor
–. Then, cell impulses p satisfying the equation
!A€A + –M"p = ≠A€d, [3]
are calculated using an iterated conjugate gradients method, such that the application of the impulses moves the cells back to an equilibrium configuration whilst minimizing cell displacement, to within an absolute tolerance ‘c. New overlaps
created by movement are resolved sequentially, adding sets of impulses together until either their application produces no additional detectable overlaps, or until the iteration count exceeds the maximum iteration number Miter. This scheme is
described in further detail in previous publications [7,8].
Table S1. Nutrient field boundary conditions used in this study Set Boundary Condition Description
A Top:z= max(pz) + h u= u0 Supply from bulk liquid
Bottom:z= 0 Òu · ˆn = 0 Zero flux through base Left, Right:x= 0, Lx Òu · ˆn = 0 Zero flux through walls
B Top u= 0 Removal by bulk liquid
Bottom u= u0 Supply from base
Left, Right Òu · ˆn = 0 Zero flux through walls
SI Tables
Boundary conditions for nutrient field modeling are shown in TableS1. In this table, ˆn corresponds to the unit vector
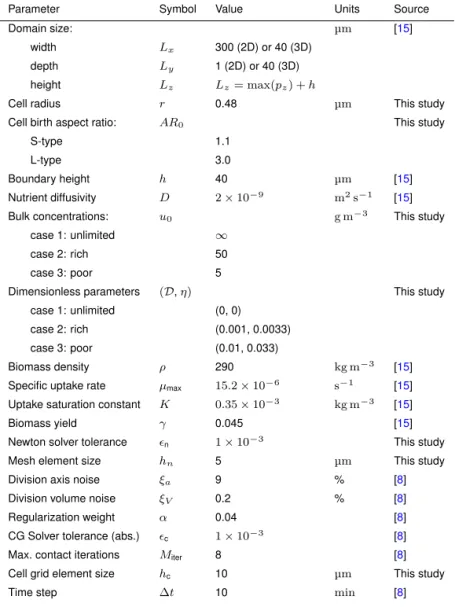
normal to the boundary wall in each case. The variables and parameters used in our individual-based model are listed, along with their symbols and units, in TablesS2andS3respectively. Note that the dimensionless Damköhler (D) and saturation (÷) numbers are actually groupings of other parameters, as described above. Parameter sources are cited where applicable. Bibliography.
1. Volfson D, Cookson S, Hasty J, Tsimring LS (2008) Biomechanical ordering of dense cell populations. Proc. Natl. Acad. Sci. U. S. A. 105(40):15346–51.
2. Cho H et al. (2007) Self-organization in high-density bacterial colonies: Efficient crowd control. PLoS Biol. 5(11):2614–2623.
3. Boyer D et al. (2013) Buckling instability in ordered bacterial colonies. Phys. Biol. 487(7405):109–113.
4. Drescher K et al. (2016) Architectural transitions in <i>Vibrio cholerae</i> biofilms at single-cell resolution. Proc. Natl. Acad. Sci. p. 201601702.
5. Rabani A, Ariel G, Be’er A (2013) Collective motion of spherical bacteria. PLoS One 8(12):e83760.
6. Storck T, Picioreanu C, Virdis B, Batstone DJ (2014) Variable cell morphology approach for individual-based modeling of microbial communities. Biophys. J. 106(9):2037–48. 7. Rudge TJ, Federici F, Steiner PJ, Kan A, Haseloff J (2013) Cell Polarity-Driven Instability
Generates Self-Organized, Fractal Patterning of Cell Layers. ACS Synth. Biol. 2(1):705–414. 8. Rudge TJ, Steiner PJ, Phillips A, Haseloff J (2012) Computational modeling of synthetic
mi-crobial biofilms. ACS Synth. Biol. 1(8):345–52.
9. Logg A, Wells GN (2010) Dolfin. ACM Trans. Math. Softw. 37(2):1–28. 10. Alnæs MS et al. (2015) The FEniCS Project Version 1.5. 3(100):9–23. 11. Smith WPJ (2016) Cellmodeller4 branch. [Online; accessed July 13, 2016].
12. Klapper I, Rupp CJ, Cargo R, Purvedorj B, Stoodley P (2002) Viscoelastic fluid description of bacterial biofilm material properties. Biotechnol. Bioeng. 80(3):289–296.
13. Picioreanu C, Van Loosdrecht MCM, Heijnen JJ (2000) Effect of diffusive and convective sub-strate transport on biofilm structure formation: A two-dimensional modeling study. Biotechnol. Bioeng. 69(5):504–515.
14. Klapper I, Dockery J (2010) Microbial Biofilms. 52(2):221–265.
15. Picioreanu C, van Loosdrecht MC, Heijnen JJ (1998) Mathematical modeling of biofilm struc-ture with a hybrid differential-discrete cellular automaton approach. Biotechnol. Bioeng. 58(1):101–16.
16. Nadell CD, Foster KR, Xavier JB (2010) Emergence of spatial structure in cell groups and the evolution of cooperation. PLoS Comput. Biol. 6(3):1–9.
Table S2. Model variables used in this study
Variable Symbol Units
Cartesian coordinates x, y, z µm
Cell volume fraction field „
Nutrient field u kg m≠3
For each celli
position vector pi= (px, py, pz)€ µm orientation unit vector ˆai= (ax, ay, az)€ µm
segment length li µm
volume Vi= filir2+43fir3 µm3 local nutrient concentration ui= u(pi) kg m≠3 growth rate µi= µmaxui/(K + ui) s≠1
Table S3. Model parameters used in this study
Parameter Symbol Value Units Source
Domain size: µm [15]
width Lx 300 (2D) or 40 (3D) depth Ly 1 (2D) or 40 (3D) height Lz Lz= max(pz) + h
Cell radius r 0.48 µm This study
Cell birth aspect ratio: AR0 This study
S-type 1.1
L-type 3.0
Boundary height h 40 µm [15]
Nutrient diffusivity D 2 ◊ 10≠9 m2s≠1 [15]
Bulk concentrations: u0 g m≠3 This study
case 1: unlimited Œ
case 2: rich 50
case 3: poor 5
Dimensionless parameters (D,÷) This study case 1: unlimited (0, 0)
case 2: rich (0.001, 0.0033) case 3: poor (0.01, 0.033)
Biomass density fl 290 kg m≠3 [15]
Specific uptake rate µmax 15.2 ◊ 10≠6 s≠1 [15]
Uptake saturation constant K 0.35 ◊ 10≠3 kg m≠3 [15]
Biomass yield “ 0.045 [15]
Newton solver tolerance ‘n 1 ◊ 10≠3 This study
Mesh element size hn 5 µm This study
Division axis noise ›a 9 % [8]
Division volume noise ›V 0.2 % [8]
Regularization weight – 0.04 [8]
CG Solver tolerance (abs.) ‘c 1 ◊ 10≠3 [8]
Max. contact iterations Miter 8 [8]
Cell grid element size hc 10 µm This study
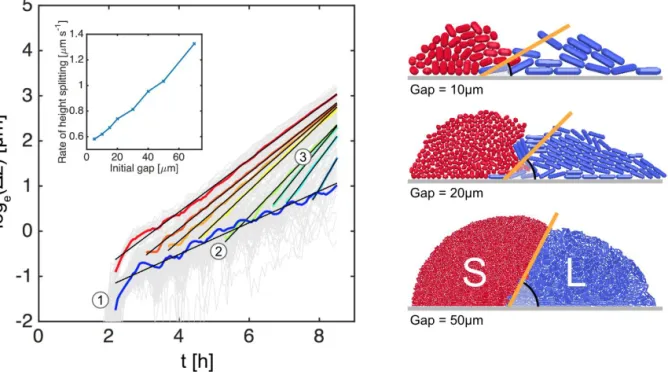
Fig. S2. Simplified 2-D simulations allow the physical mechanism of cell sorting to be explored. A: 2-group simulations using SL, SS and LL colonies form layered, smooth
and interdigitated cell distributions respectively. Traces of mean cell height quantify the layering effect over time in SL colonies; black arrows indicate snapshot times. 100 simulations per case. B: Changing the initial gap between the cells alters the size of the groups at the time at which they meet. In all cases, a difference in the mean strain heights ( z) begins to develop as soon as the groups collide, regardless of the group size. Example snapshots of colliding groups are shown for initial gaps of 5, 20 and
50 µm(inset); collision times are marked on the graph by triangles of the corresponding color. Upon collision, the rate of splitting is increased. 20 simulations per case; cell growth rates are homogeneous.
Fig. S3. Further analysis of the 2-group cell sorting experiments shown in Figure 3-B show that the cell layering rate increases with group size. Three separate process
contribute to the growth of a strain height differential z: an initial jump (1) precedes a shallow, sustained climb (2), followed by a steeper climb as soon as the S and L cell groups collide (3). Fitting lines to these traces shows that the rate of height splitting after collision increases with initial gap (inset), suggesting that the strain sorting mechanism is dependent on group size. This observation supports the hypothesis that cell sorting is driven by group structure: increases to the initial gap change the shape of L cell groups at the point of collision, from shallow wedges (Gap = 10µmcase) to steeper wedges (Gap = 50µmcase). As the wedge gradient increases, so too does the rate of spitting. Trace color legend identical to that shown in FigureS2. 20 simulations per case; cell growth rates are homogeneous.
Fig. S4. Repeats of 2-group colony growth simulations in 3 dimensions reproduce the spatial patterning seen in 2-D (FigureS2-A). (A) shows overhead views of 3-D colonies (first column), grown using the SS (first row), SL (second row) and LL (third row) shape combinations. 2-D slices taken through these colonies (yellow boxes, left column) show similar colony shapes and cell strain distributions to 2-D simulations of the same overall height (yellow boxes, right column). Snapshots shown are representative in each case, and dashed lines indicate the slice plane orientation. (B) quantifies the comparison using the mean cell height metric, showing that the cell sorting effect is common to both 3-D and 2-D geometries. Data collected at same timepoints as in (A); boxes and whiskers show interquartile and absolute ranges, respectively. 20 simulations per case; initial gap of 6µm. Cell growth rates are homogeneous.
Fig. S5. Simulations using intermediate cell shapes show smooth transitions in strain height differentials between the SS, SL and LL cases discussed in FigureS2-A. As the aspect ratio of the blue strain is increased, the height differential rises (SS to SL). Then, increasing the aspect ratio of the red strain in the same way extinguishes the height differential but leads to greater height variance (SL to LL). Solid lines denote means; boxes and whiskers show interquartile and absolute ranges, respectively. Data and snapshots taken after 8hof growth in 2-group simulations. 100 repeats per case; cell growth rates are homogeneous.
Fig. S6. The cell layering mechanism relies on group structure. Repeats of simplified 2-group simulations (FigureS1) show that the strain height differential zdoes not fully recover following random mixing events at 4.9, 5.6, 6.5 or 7.1h. At these times, strains are mixed by randomly changing each cell’s strain identity with probability 0.5, so that approximately half the S strain population (red) converts to the L-type morphology (blue) and vice-versa. Shortly after mixing, the height differential begins to rise gradually as small groups of L shapes reform surface-hugging group structures, as shown in the inset colony snapshot (8hgrowth, following a mixing event at 4.9h). These observations can be used to exclude the possibility that strain layering emerges at the individual level - in this case, mixing events would generate more S-L contacts, resulting in a rapid recovery of the height differential. Bold lines and shaded areas correspond to mean values and 95% confidence intervals respectively. All simulations use an initial gap of 6µm. 20 simulations per case; cell growth rates are homogeneous.
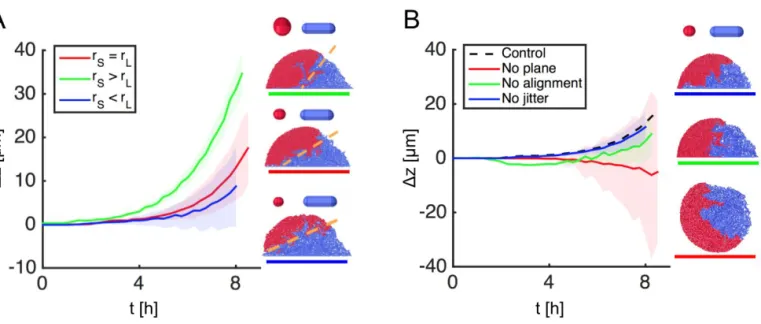
Fig. S7. Additional 2-group simulations provide further support for the layering mechanism proposed in FigureS1. (A): the layering effect, characterized by time traces of mean strain height difference z, has a weak dependence on relative cell size, as demonstrated with simulations using modified S-type cells of different radii but identical aspect ratios (AR0= 1.1). Smaller cells burrow more easily beneath larger ones regardless of shape, which can either attenuate sorting (rS> rLcase) or enhance it
(rS< rLcase) relative to the original (rS= rLcase). (B): Sorting is robust to changes in division orientation noise (no jitter), and to initial cell orientation (no alignment), but
is extinguished when the basal plane is removed. Bold lines and shaded areas correspond to mean values and 95% confidence intervals respectively. All simulations use an initial gap of 5µm. 20 simulations per case; cell growth rates are homogeneous.