This is an accepted manuscript of an article published by Elsevier in Case Studies on Transport Policy on June 14 2014, available at http://dx.doi.org/10.1016/j.cstp.2014.06.003
This manuscript version is made available under de CC-BY-NC-ND 4.0 license http://creativecommons.org/licenses/by-nc-nd/4.0/
Please cite as:
Carrier, M., Apparicio, P., Séguin, A.-M., & Crouse, D. (2014). Ambient air pollution
concentration in Montreal and environmental equity: Are children at risk at school? Case Studies on Transport Policy, 2(2), 61-69. doi:10.1016/j.cstp.2014.06.003
Title: Ambient air pollution concentration in Montreal and environmental equity: Are
children at risk at school?
Journal: Case Studies on Transport Policy
Authors and affiliations
Mathieu Carrier, PhD candidate* - Corresponding author
385 rue Sherbrooke Est, Montréal (Québec), Canada
H2X 1E3
[email protected]
(514) 499-8249
Philippe Apparicio, PhD
385 rue Sherbrooke Est, Montréal (Québec), H2X 1E3
[email protected]
Anne-Marie Séguin, PhD
385 rue Sherbrooke Est, Montréal (Québec), H2X 1E3
[email protected]
Dan Crouse, PhD
805 rue Sherbrooke Ouest, Montréal (Québec), H3A 0B9
McGill University
[email protected]
Référence complète de l’article
Carrier, M., Apparicio, P., Séguin, A.-M. et Crouse, D. 2014. Ambient air pollution
concentration in Montreal and environmental equity: Are children at risk at school?, Case Studies on Transport Policy, 2, 2, 61-69.
ABSTRACT
The analysis of ambient air quality in the environments around elementary schools is an important issue, as children are at school for a large part of the day. This article has two objectives: first, to compare the proportion of major roads and NO2 concentration levels in city
blocks where there are schools with the situation in the rest of the Island of Montreal; and second, to see whether there are significant differences in these pollution indicators according to the levels of socioeconomic deprivation at these schools.
Montreal’s 319 elementary schools were geocoded in a geographic information system (GIS). Two types of pollution indicators based on the types of roads and NO2 concentrations were
calculated within a 200-metre radius of each city block centroid on the Island of Montreal and of the main building of each elementary school.
Elementary schools, regardless of their level of socioeconomic deprivation, are located in city blocks where there are fewer major roads than in, and generally similar concentrations of NO2
to, the rest of the Island of Montreal. However, NO2 concentrations near elementary schools
are positively and significantly associated with levels of deprivation at these schools.
This study highlights an issue of environmental equity, in showing that students from socioeconomically disadvantaged backgrounds tend to attend elementary schools located in more polluted environments.
Keywords: Environmental equity, elementary schools, air pollution, deprivation,
transportation policies, geographic information systems.
Highlights
Elementary schools are located in city blocks where there are fewer major roads
NO2 concentrations near schools are positively associated with levels of deprivation
at these schools
Schools with a higher index of deprivation tend to be located in the most polluted areas
1. Introduction
Pollutant emissions are one of the major pollutants in urban areas and affect people’s quality of life on a number of levels (Briggs et al., 2008; Brunekreef and Holgate, 2002; Hoek et al., 2002). Air pollution also contributes to health inequalities, and the authorities must develop adequate social inclusion policies towards the most vulnerable populations to these pollutants. Vehicular exhaust is the main source of harmful particles that have a detrimental impact on health, especially nitrogen oxides (NOx) (Cesaroni et al., 2008; Crouse et al., 2009a) and, to
a lesser extent, carbon monoxide (CO) (Houston et al., 2004; Rioux et al., 2010). Recent observations in regard to NO2 levels in the United Kingdom report that the spatial
concentrations of this pollutant have stabilized in recent years. These observations could undermine the authorities’ objective of reducing NO2 concentrations in urban areas (Carslaw
et al., 2011).
The highest concentrations of these pollutants are generally found within 200 metres of highways and major roads (Brugge et al., 2007). Studies have shown that children are more vulnerable to the effects of high concentrations of various air pollutants due to the fact that their organs and nervous systems are not fully developed (Bolte et al., 2009) and that they inhale more air per unit of body mass (Landrigan et al., 2004), and because of their limited mobility, which tends to restrict them to their residential area (Day and Wager, 2010). A number of studies around the world have also shown that children who attend schools located less than 200 metres from a major road, that is, in areas where traffic densities are high and where there are high levels of traffic-related pollutants, are more likely to develop problems associated with asthma and to have reduced lung function (Brunekreef et al., 1997; Clark et al., 2010; Gauderman et al., 2007; Jerrett et al., 2008; Kim et al., 2008). For example, Brunekreef et al. (1997) found that a residential location near major motorways in the Netherlands may lead to reduced lung function in children.
The literature on environmental and social equity has focused on the health impacts of the spatial distribution of environmental burdens, and on the lack of amenities experienced by low-income households and ethnic or racial groups in different countries (Schweitzer and Stephenson, 2007; Walker, 2011). Numerous studies have shown that low-income households tend to be located in the most polluted areas in Canada (Buzzelli and Jerrett, 2007; Crouse et al., 2009b), the United States (Chakraborty, 2006, 2009; Pastor et al., 2001), the United Kingdom (Brainard et al., 2002; Mitchell and Dorling, 2003) and New Zealand (Kingham et al., 2007). In the same vein, other studies have looked at the social impacts of transportation infrastructure (Feitelson, 2002; Hodgson et al., 2013; Thomopolous and Grant-Muller, 2013). More recently, the literature on environmental and social equity has increasingly
examined other population groups such as children and older people due to their physiological vulnerability to air pollution (Walker, 2009). Nevertheless, few studies on environmental and social equity and transportation have explored whether children are exposed to high concentrations of air pollutants (Brainard et al., 2002; Crouse et al., 2009b; Mitchell and Dorling, 2003).
This analysis focusing on Montreal has been inspired by these studies on air pollution and social impacts in transportation from the perspective of environmental and social equity. It concentrates, however, on an evaluation of air quality in the environments around elementary schools. Only a few studies in environmental and social equity have emphasized intra-group differences in terms of the exposure to air pollutants.
2. Schools, air pollution, environmental and social equity
Numerous studies have been conducted in order to evaluate the association between air quality around schools and various outcomes such as academic performance (Clark et al., 2010; Zahran et al., 2009), mental health (Evans, 2003) and respiratory problems (McConnell et al., 2010; Pastor et al., 2006). In that perspective, the characterization of the socioeconomic status of children attending schools located in areas that are most affected by traffic-related air pollution has become a topic of considerable interest in the literature on environmental and social equity because of the amount of time that children spend at school (Sampson, 2012). A number of U.S. studies have shown that children from low-income backgrounds and Hispanic or African-American communities are more likely to attend schools that are located near major roads and in the most polluted areas. In California, Green et al. (2004) showed that public schools located within 150 metres of a major road with daily traffic of over 50,000 vehicles were more frequently attended by ethnic minorities (Hispanics and Blacks) and students from low-income households. In other American cities, Chakraborty and Zandbergen (2007) and Stuart and Zeager (2011) in Tampa Bay, and Wu and Batterman (2006) in Detroit found that schools with a high level of deprivation were positively associated with a proximity to major roads and a higher concentration of nitrogen dioxide (NO2). A recent study by Amram
et al. (2011) on large Canadian urban areas notes that 22% of schools in the most deprived quintile at the census tract level are located less than 75 metres from a major road, compared with 13% of schools in the least deprived quintile. Moreover, a study in Malmo, Sweden shows that children under 15 years of age from low-income households are more exposed to higher concentrations of NO2 in their home and school environments (Chaix et al., 2006).
3. Research objectives
The literature has emphasized the finding that children from low-income households or of low socioeconomic status are more likely than those from more well-off households to attend schools that are located near major roads, where concentrations of pollutants are higher (Amram et al., 2011; Chakraborty and Zandbergen, 2007). This situation is an important issue for understanding health inequalities and developing appropriate social inclusion policies for transportation, as children are vulnerable to pollutants in their environment in two ways. On the one hand, the incomplete development of their organs and nervous systems increases their risks of developing various health problems if they are exposed to high concentrations of pollutants. On the other hand, because children—and especially children from low-income backgrounds—are less mobile, they are more likely to stay in their residential environments. To our knowledge, no study on environmental and social equity has compared the levels of traffic-related pollutants in the environments around schools with the levels in a larger control area. The emphasis has often been placed on the differences in pollutant concentrations between schools according to their socioeconomic composition. This study has two objectives. It first attempts to determine whether Montreal elementary schools are located in city blocks that are more polluted than in the rest of the Island of Montreal. We then develop an assessment of environmental and social equity by establishing whether the most disadvantaged elementary schools show higher pollution indicators than schools in more well-off areas.
4. Methodology
A number of methodological issues have been raised in the literature in order to determine, with considerable precision, the existence of environmental inequities for a given population group. Among the important criteria for a rigorous evaluation of environmental and social equity, Walker (2010) emphasizes the issue of the choice of the scale of analysis. In concrete terms, this spatial division has to be as fine as possible in order to obtain a good degree of variability of the indicator of exposure to the environmental nuisance across the spatial units in the area under study. This concept of the modifiable areal unit problem (MAUP) has largely been addressed in the literature in environmental and social equity (Bowen, 2002; Schweitzer and Stephenson, 2007), and recently in the literature on transportation (Wang et al., 2011). An inadequate choice of the scale of analysis could lead to errors and misinterpretations, as reported in Bowen (2002). Walker (2010) also considers it appropriate to compare the levels
of exposure to the nuisance examined in the target group with the levels for a control group, in order to establish whether these levels are in fact higher in the target group. Consequently, in the context of this study, it is important to select the appropriate spatial division and control groups in order to determine whether or not the elementary schools are located in more polluted environments.
4.1 Study area, targeted groups and scale of analysis
This study focuses on the Island of Montreal, which has 1.88 million inhabitants and covers 499 km2. This territory is part of the Montreal census metropolitan area (CMA), which is the
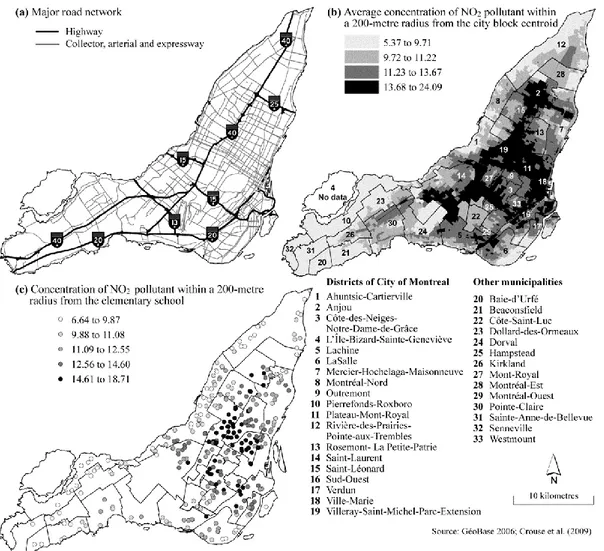
second most populous metropolis in Canada (with 3.92 million inhabitants). We have only considered the Island of Montreal because air pollution data were only available in that geographic area. More specifically, this study focuses on the environment around Montreal’s 319 public elementary schools, excluding schools in Île-Bizard (with a population of 17,950 inhabitants), where no air pollution measurements had been taken (Figure 1).
We selected two control groups—children between 5 and 12 years old, and the total population—the numbers of which were extracted by Statistics Canada from the 2011 census, at the dissemination area (DA) level. The DA is the most accurate unit of analysis on which socioeconomic data are available. Generally, 400 to 700 people reside in a DA, and this spatial unit corresponds to a small area composed of one or more neighbouring blocks (Statistics-Canada, 2011). Concretely, the selection of these two control populations allowed us to compare pollution indicator values between the environments around public elementary schools and residential areas across the entire Island of Montreal. The selection of the control population of children between 5 and 12 years old also enabled us to compare the spatial concentrations of air pollution indicators around the schools and around the residential areas. We were thus able to see whether pollution levels for children were higher at school than in their home environment. This also allowed us to determine the potential NO2 exposure for
children in this age group as they spent most of their day at school and in their residential area.
Figure 1. Study area: Schools, major road networks and pollution indicators
Checking for environmental and social inequities for a given population group requires that analyses be performed at a fine geographic scale, as pollution levels can vary greatly at the scales of a neighbourhood, a census tract or a dissemination area. We therefore decided to use the city block, the finest spatial unit provided by Statistics Canada, as our basis for generating pollution indicators. It should be noted that Statistics Canada only provides data on the total population and the number of dwellings at the city block level. To address this issue, we estimated the numbers of 5 to 12 year-olds consistent with the approach recently put forward by Pham et al. (2012), as follows:
𝑡
𝑖= 𝑡
𝑎𝑇
𝑖𝑇
𝑎where ti represents the estimated population of the 5 to 12 year-old group in the city block, ta is the group’s population in the dissemination area, and Ti and Ta are the total population in
One of the main limitations of this method is related to the assumption of a homogenous distribution for a demographic group at the city block and dissemination area levels. To validate the robustness of the interpolation, we did the same exercise but with data interpolated from the census tract level to the DA level, as suggested by Maantay et al. (2007) and as also done by Pham et al. (2012). The correlation between the interpolated values and those provided by Statistics Canada for the 5 to 12 year-old group at the DA level is 0.87, which is comparable to the results of Maantay et al. (2007) and Pham et al. (2012).
4.2 Geocoding of elementary schools
We developed our list of public elementary schools from the data available on the websites of the five school boards covering the territory of the Island of Montreal. We then validated this list with data from the Québec Ministry of Education, Recreation and Sports. After this, the schools were geocoded in a GIS (ArcGIS version 10.1) according to their postal codes, and a correction was finally effected to ensure that the points for the schools were placed in the centre of each main building by using the online high-resolution imagery basemaps of ArcGIS (ESRI, 2011). The Google Maps website was also used to validate this process for each of the 319 schools.
4.3 Determination of socioeconomic deprivation levels for elementary schools
The authority in charge of school tax on the Island of Montreal (Le comité de gestion de la taxe scolaire de l’île de Montréal, or CGTSIM) has established the socioeconomic deprivation levels (or “underprivileged status”) of all elementary schools located on the Island of Montreal (CGTSIM, 2013). To set these levels, the CGTSIM first develops an “overall underprivileged index,” by using four variables from the 2006 Canadian census data collected by Statistics Canada and establishing the respective weight of these variables in the index calculation as follows: low income (50%), mother’s education (16.67%), female lone-parent families (16.67%) and parents’ economic activity (16.67%). The index is applied to 470 zones determined by the CGTSIM and located on the Island of Montreal. Using the postal code for his or her home address, each student is assigned a value for the “index of underprivileged status” associated with one of the 470 zones where he or she lives. The overall underprivileged index can vary from 0 (absence of deprivation) to 100 (all of the students live in an area with a high level of socioeconomic deprivation). The CGTSIM then assigns an index of underprivileged status to each elementary school by adding all the values of the students’
indices and dividing this by the total number of students in the school. This index ranges from 0.47 to 44.69 (mean = 15.58 and SD = 9.36), that is, from a low to a high level of deprivation.
4.4 Air pollution indicators
The operations involved in constructing the pollution indicators were carried out in ArcGIS (ESRI, 2011). All of the values for these indicators were calculated both for the areas around— and within 200 metres of—elementary schools and all city block centroids on the Island of Montreal. Two types of pollution indicators were developed.
The first pollutant estimation measurements were created by using a spatial database from 2006 of all the streets on the Island of Montreal (Geobase) where various indicators of major road lengths were calculated in the areas within a 200-metre radius of the elementary schools and city blocks. The distance of 200 metres was chosen as the effects of air pollutants are rarely felt beyond this distance. Brugge et al. (2007) have reported that the spatial concentrations of air pollutants from highways rapidly decline from 0 to 200 metres. These buffer zones were demarcated around the centroid of the area occupied for residential purposes in each city block on the Island of Montreal. These estimation measurements represent a proxy of air pollution following from the postulate that pollution levels should be higher near major roads and highways. The length of major roads simply corresponds to the sum of the lengths of all road sections associated with their hierarchies (as secondary roads or highways) in each buffer zone. The indicators developed are related to: 1) the length of the highway network within the 200-metre radius around schools and city block centroids; 2) the length of secondary roads—collector, arterial and express roads; and 3) the length of highways and secondary roads.
For the second type of pollution indicators, we used a series of data created by a team of McGill University researchers who had measured NO2 concentrations during the months of
May, August and December 2006 at 133 locations on the Island of Montreal (Crouse et al., 2009a). A pollution map for the entire island was then generated by using land-use regression at a fine spatial resolution (Crouse et al., 2009b). This technique consists in constructing a regression equation with the observations at the 133 points sampled for the concentration of a pollutant as the dependent variable, and a whole series of independent variables, especially the proximity to major roads and highways, the length of sections of road near the sampling location, traffic flows, residential density, and the presence of industrial facilities (Crouse et al., 2009a; Ryan and LeMasters, 2007). Once a robust regression model has been obtained (with a high R2), the equation is applied to the entire territory. Using the map of pollutant
emissions thus developed, we then calculated the average NO2 value within a 200-metre
radius of each elementary school on the Island of Montreal and of each city block centroid. However, we also need to remember that the NO2 concentrations are derived from the results
of land-use regression modelling using data observed over a period of three different months. But this may mask considerable variations in such concentrations according to the day of the week and the time of day. In sum, it is important here to distinguish between the notions of the concentration of a pollutant and an individual’s exposure to pollutants. The latter is related to the period of time spent in an environment and the quantity of pollutants to which the individual is exposed (Janssen and Mehta, 2006).
4.5 Statistical analyses
In order to determine whether there are environmental and social inequities affecting public elementary schools with higher levels of socioeconomic deprivation, we employed four types of statistical analyses widely used in studies on environmental and social equity (Apparicio et al., 2010; Briggs et al., 2008; Kingham et al., 2007). We also decided not to conduct regression modelling because we wanted to place the emphasis on comparing air pollutant concentration levels and the length of major roads between the students enrolled in the elementary schools and the two control groups.
In keeping with our first objective, the first two statistical analyses were designed to show whether the schools were located in city blocks that were more polluted than in the rest of the Island of Montreal through: 1) a comparison of the univariate statistics for the pollution indicators weighted by the number of students enrolled in elementary schools, the total population, and the number of 5 to 12 year-olds per city block; and 2) a t-test to compare the mean values of the pollution indicators calculated within 200 metres of city blocks that have an elementary school weighted by the number of enrolled students, and for city blocks without an elementary school weighted by the number of 5 to 12 year-olds.
Next, in line with our second objective, we performed two other statistical analyses to determine whether the most disadvantaged elementary schools showed higher pollution indicators than the more well-off elementary schools. Thirdly, we calculated Spearman correlation coefficients between the elementary schools’ socioeconomic deprivation levels and the pollution indicators calculated within 200 metres of these schools. Due to the fact that the association between the level of deprivation index for elementary schools and the pollution indicators might not be linear, we conducted a fourth statistical analysis. We conducted a t-test analysis to compare the mean values of the pollution indicators for the extreme quintiles
(first and last quintiles) of the school deprivation index, an exercise conducted, among others, by Kingham et al. (2007) and Briggs et al. (2008). These analyses were performed in SAS version 9.2 (SAS Institute Inc).
5. Results
Descriptive statistics for the pollution indicators on the Island of Montreal
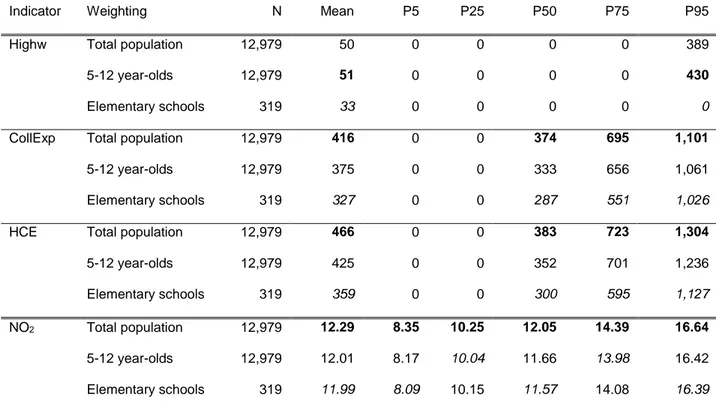
The univariate statistics for the four pollution indicators weighted by the total population as reported in the 2011 Canadian census, the number of 5 to 12 year-olds and the number of students enrolled in public elementary schools at the city block level are presented in Table 1. An analysis of these statistics shows that the level of NO2 and the length of major roads are
not as great when they are weighted by the number of students enrolled in elementary schools. The difference is even larger for all the pollution indicators when we compare the number of students enrolled in elementary schools and the total population. So we find that elementary-level students go to schools where there is a slightly lower concentration of NO2 (mean = 11.99
parts per billion (ppb) and median = 11.57 ppb, compared with 12.29 ppb and 12.05 ppb for the total population) and where there are shorter major roads and highway sections (mean = 359 m and median = 300 m, compared with 466 m and 383 m for the total population). It was not however unexpected to find a much smaller gap between the statistics obtained for the number of 5 to 12 year-olds and the number of students enrolled in elementary schools. These first results show that elementary schools tend to be located in areas that are less polluted by NO2, and with shorter lengths of major roads in comparison with the total population of the
Island of Montreal. Finally, it is worth noting that all the values of the air pollutants around elementary schools shown in Figure 1 are below the threshold set by the World Health Organization (WHO) (Forastiere et al., 2006).
Table 1. Univariate statistics for the pollution indicators within a distance of 200 metres from the city
block centroid weighted by the total population, the number of 5 to 12 year-olds, and the number of students enrolled in public elementary schools
Indicator Weighting N Mean P5 P25 P50 P75 P95
Highw Total population 12,979 50 0 0 0 0 389
5-12 year-olds 12,979 51 0 0 0 0 430
Elementary schools 319 33 0 0 0 0 0
CollExp Total population 12,979 416 0 0 374 695 1,101
5-12 year-olds 12,979 375 0 0 333 656 1,061
Elementary schools 319 327 0 0 287 551 1,026
HCE Total population 12,979 466 0 0 383 723 1,304
5-12 year-olds 12,979 425 0 0 352 701 1,236
Elementary schools 319 359 0 0 300 595 1,127
NO2 Total population 12,979 12.29 8.35 10.25 12.05 14.39 16.64
5-12 year-olds 12,979 12.01 8.17 10.04 11.66 13.98 16.42 Elementary schools 319 11.99 8.09 10.15 11.57 14.08 16.39 Highw: length of highways by city block (in metres); CollExp: length of collector, arterial and express roads by city block; HCE: length of highways, collector, arterial and express roads by city block; NO2: mean concentration of NO2 by
city block.
P5= 5th percentile; P25= first quartile; P50= median; P75= third quartile; P95= 95th percentile. Bold typeface indicates
the strongest values for each statistical measurement; italics, the weakest.
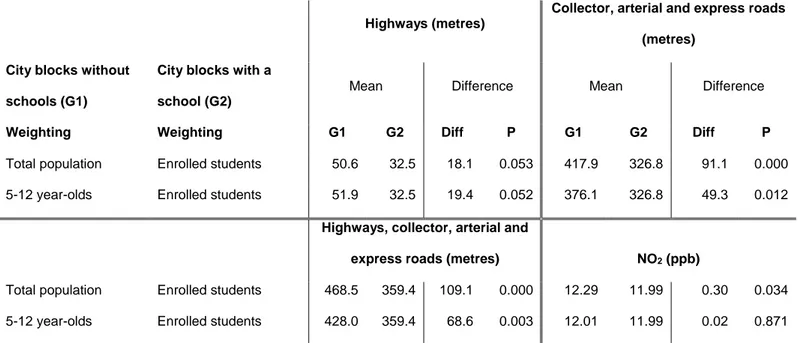
Comparison between the mean pollutant values for elementary schools and city blocks
We performed a t-test to compare the mean values for the four pollution indicators at the level of city blocks with or without an elementary school weighted by various count variables. For city blocks without a school, the pollution indicators are weighted by the number of 5 to 12 year-olds and the total population. For city blocks with a school, the pollution indicators are weighted by the number of students enrolled in elementary schools (Table 2).
At a 0.05 threshold of significance, city blocks with public elementary schools show shorter average lengths of nearby highways and collector, arterial and express roads and lower average NO2 concentrations when compared with Montreal city blocks weighted by the
number of 5 to 12 year-olds and the total population. However, the difference in the average NO2 concentrations is not significant between city blocks with elementary schools and other
elementary schools are located in city blocks showing levels of NO2 pollution indicators that
are slightly lower than those for the rest of the Island of Montreal, and where there are shorter lengths of major roads and highways nearby. Consequently, the results of this second analysis point in the same direction as the previous analysis, in showing an advantageous geographic location for the elementary schools in comparison with city blocks without such schools.
Table 2. Comparison of the mean values of the pollution indicators within 200 metres of city block
centroids without a public elementary school weighted by the total population and the number of 5 to 12 year-olds, and of the pollution indicators for city blocks with a public elementary school weighted by the number of enrolled students
Highways (metres)
Collector, arterial and express roads (metres)
City blocks without schools (G1)
City blocks with a school (G2)
Mean Difference Mean Difference
Weighting Weighting G1 G2 Diff P G1 G2 Diff P
Total population Enrolled students 50.6 32.5 18.1 0.053 417.9 326.8 91.1 0.000 5-12 year-olds Enrolled students 51.9 32.5 19.4 0.052 376.1 326.8 49.3 0.012
Highways, collector, arterial and
express roads (metres) NO2 (ppb)
Total population Enrolled students 468.5 359.4 109.1 0.000 12.29 11.99 0.30 0.034 5-12 year-olds Enrolled students 428.0 359.4 68.6 0.003 12.01 11.99 0.02 0.871 If the variances of the two groups are unequal (with P<0.05), the Satterthwaite variance estimator is used for the t-test; otherwise, the pooled variance estimator is used.
Correlation between the pollutants and the school deprivation index
Spearman correlation coefficients were calculated to see whether there were significant linear relationships between the Montreal elementary schools’ socioeconomic deprivation index and the four pollution indicators weighted by the number of students (Table 3). First, only one correlation was found to be moderate—that is, the correlation between the elementary schools’ socioeconomic deprivation index, weighted by the number of students, and the NO2
concentration (r=0.410; 95% CI: 0.314 to 0.497)—thus revealing an environmental and social inequity in terms of the schools that students from disadvantaged backgrounds attend. Next, an increase in the elementary schools’ level of socioeconomic deprivation was also tied to an increase in the length of major roads in their immediate environment, but this relationship was relatively weak (r=0.118; 95% CI: 0.008 to 0.224). The other correlations between the elementary schools’ level of deprivation and the pollution indicators were found to be weak
and not significant at a 0.05 threshold. In sum, socially deprived students are more likely to attend schools located in the most polluted areas, especially in terms of NO2 concentrations.
Table 3. Spearman correlation coefficients between the pollution indicators within 200 metres and the
level of deprivation of public elementary schools
Level of deprivation of elementary schools
Length of major roads near the city block
Land-use regression
Highw CollExp HCE NO2
0.027 0.118** 0.107* 0.410***
* P<0.10. ** P<0.05. *** P<0.01. N=319.
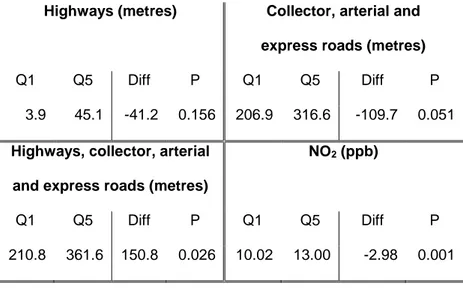
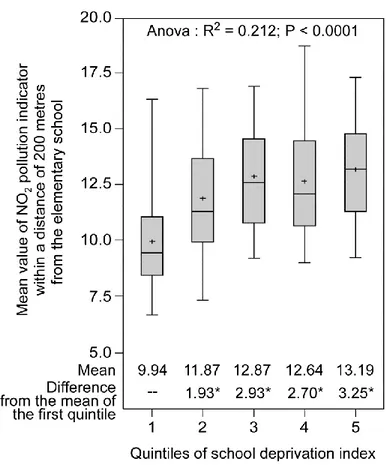
Comparison of mean pollutant values between the first and fifth quintiles of the school deprivation index
The findings of the analysis shown in Table 4 indicate that the elementary schools in the most deprived quintile tend to be located in areas with longer lengths of highways and collector, arterial and express roads compared with schools in the least deprived quintile. However, these differences between the means are not statistically significant for highways at a threshold of 0.10. Moreover, the mean NO2 concentration for the fifth quintile of socioeconomic
deprivation of elementary schools is 13.00 ppb, compared with 10.02 ppb for the first quintile, which represents a difference of 2.98 ppb in the concentration of this pollutant. So this points to a situation of environmental and social inequity, in indicating that the students attending the schools that present the greatest deprivation are more exposed to air pollution. This finding is further confirmed by an analysis of the boxplots shown in Figure 2.
Table 4. Comparison of the mean values of the pollution indicators within 200 metres between the first
and last quintiles of the school deprivation index weighted by the number of enrolled students
Highways (metres) Collector, arterial and express roads (metres)
Q1 Q5 Diff P Q1 Q5 Diff P
3.9 45.1 -41.2 0.156 206.9 316.6 -109.7 0.051
Highways, collector, arterial and express roads (metres)
NO2 (ppb)
Q1 Q5 Diff P Q1 Q5 Diff P
Figure 2. Boxplot of the NO2 pollution indicator according to the quintiles of deprivation of elementary
schools
6. Discussion
Two main findings have come out of our study in terms of the concentration of pollutants within a 200-metre radius of elementary schools. The first finding is encouraging, in that all the elementary schools, regardless of their level of socioeconomic deprivation, tend to be located in city blocks that are characterized by having shorter total lengths of major roads nearby than the city-wide average. Additionally, the average concentrations of NO2 around elementary
schools are lower than those around all city blocks on the Island of Montreal weighted by the total population. This first finding is however tarnished by the existence of a situation of environmental and social inequity when we introduce the level of socioeconomic deprivation of the various elementary schools. A higher level of socioeconomic deprivation for elementary schools is associated with an increase in NO2 levels in their immediate environment, as
indicated by the Spearman correlation coefficients. Moreover, schools in the last quintile of deprivation are located in areas where the NO2 concentration (mean = 13.00 ppb) is higher
than for schools located in more well-off areas (mean = 10.02 ppb). Moreover, the level of NO2
(mean = 12.29 ppb). The results of this study, showing that the most deprived schools are located in environments that are significantly more polluted, are in line with the findings of earlier studies on the same topic in Detroit (Wu and Batterman, 2006), Tampa Bay (Chakraborty and Zandbergen, 2007; Stuart and Zeager, 2011), and other Canadian cities (Amram et al., 2011). But just how important is this situation in terms of the health risks for students attending schools where the concentrations of pollutants are the highest? A further analysis allows us to evaluate the health risks for students going to schools where there are higher levels of air pollutants. The World Health Organization (WHO) has determined that annual concentrations of NO2 should not exceed 40 μg/m-3 (Forastiere et al., 2006). The mean
concentration of this pollutant is 13.00 ppb in the environments around Montreal schools in the last quintile of deprivation, and the maximum value for all the schools is 18.7 ppb, which are respectively equivalent to 24.44 and 35.16 μg/m-3, that is, a lower level than the threshold
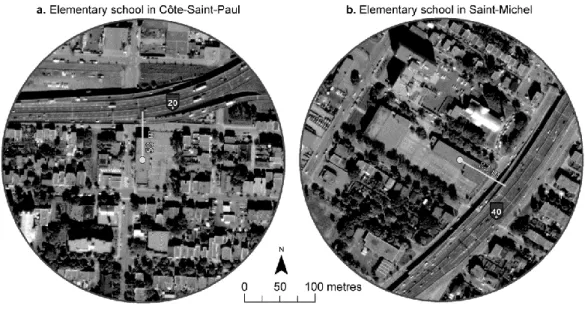
set by the WHO. It should however be noted that 11 elementary schools are located less than 200 metres from a highway, as shown in Figure 3, and that seven of them are in the fourth and fifth quintiles of deprivation.
Figure 3. Examples of two public elementary schools located less than 200 metres from a highway
Potential solutions for tackling air pollution inequities at school
This section examines two possible avenues for solutions designed to ensure, on the one hand, that new elementary schools are not located in areas with the highest concentrations of pollutant emissions, or, on the other, that mitigation measures are taken to reduce the disadvantages associated with the most problematic locations. The first potential solution is a normative approach prohibiting the building of new schools near major traffic arteries. The second approach, based on one of the conceptions of equity in transportation policies,
consists in developing compensatory measures for elementary schools affected by the highest levels of environmental nuisances stemming from road transportation.
In light of these health risks, six American states have set tighter urban planning standards in regard to the development of sensitive-use facilities such as schools and playgrounds near major traffic arteries. Moreover, only six states require environmental assessments in school siting processes (Sampson, 2012). The State of California has adopted the strictest planning norms. Since 2003, this state has prohibited the building of “new school sites within 500 feet (166 metres) of the edge of the closest traffic lane of a freeway or busy traffic corridor” (California, 2003).
To our knowledge, in Canadian provinces, unlike the situation in the U.S., no urban planning standards appear to have been set up governing the building of new elementary schools. The Canadian approach seems to instead emphasize the making of recommendations. For example, in British Columbia (Canada), the Ministry of Environment has recommended the keeping of a buffer zone of 150 metres between major roads and sensitive-use facilities such as schools or hospitals (Environment, 2006). In the same vein, in line with current Québec provincial legislation on urban planning, Montreal’s master plan must “identify the thoroughfares whose present or planned presence in a place results in land occupation near this place being subject to major restrictions for reasons of public safety, public health or general welfare” (Quebec, 2013). The council of a municipality may then adopt a zoning by-law to “regulate or prohibit all or certain land uses, taking into account the proximity of a place where the present or planned presence or carrying out of an immovable or an activity results in land occupation being subject to special restrictions for reasons of public safety, public health or general welfare” (Quebec, 2013).
A normative approach as in California—that is, the setting of a minimum distance of no less than 200 metres—could be adopted in Québec’s urban planning regulations to prohibit the location of sensitive-use facilities near major traffic arteries, given the potential risk to the health of local children. A ministerial decree could thus be issued in Québec to ensure that, in all municipalities, no sensitive-use facility could be built at a certain distance from a major traffic artery in view of the public health risks. These municipalities would then be obliged to include in their zoning by-laws the prohibition against targeted uses at a specific distance from a section of highway or major traffic artery in order to comply with the government’s decision. Finally, the City of Montreal has recently conducted experiments aimed at reducing the speed limits on the arterial network. A speed reduction would considerably reduce air pollutant emissions and road traffic noise levels. This project could be specifically implemented at a certain distance from all elementary schools during class hours.
Consideration of the social impacts associated with road transportation projects has been a particular focus of attention in the recent literature in order to ensure that the benefits and costs linked to transport infrastructures are equitably distributed between population groups. The notion of compensatory equity is increasingly being taken into account in methods of evaluating the social impacts of transportation projects (Geurs et al., 2009; Thomopolous et al., 2009). The overall idea is that individuals disproportionately affected by a transportation project should be compensated by those benefiting the most from the project (Thomopolous et al., 2009). An approach of this kind could be relevant in mitigating impacts related to road transportation around elementary schools. Putting this into practice could, for example, take the form of mitigation measures under the responsibility of public authorities in order to improve air quality near elementary schools associated with Island of Montreal school boards where the highest levels of pollutants are observed. These investments could be used to build noise barriers and plant trees and to carry out greening measures in schoolyards. These actions would be beneficial in, among other things, helping to reduce noise pollution, to absorb a portion of pollutant emissions and to lessen the heat-island effect (Akbari et al., 2001).
7. Conclusion and limitations
Finally, we want to emphasize the importance of performing this kind of analysis with different indicators of exposure to pollution prior to suggesting the existence of a situation of environmental and social inequity. If, for example, in the context of this study, we had only used indicators associated with the length of major roads and highways, we could have maintained that the situation of environmental and social inequity in regard to disadvantaged public elementary schools in Montreal was not very marked. But when we then performed further analyses using the NO2 indicator, we were able to highlight more substantial inequities.
In order to further refine our results and to more systematically deal with the question of exposure, additional studies could be carried out. On the one hand, for a sample of schools, pollution monitors could be placed in schoolyards during class times. On the other hand, a sample of students could be equipped with monitors to determine their levels of exposure to pollutants throughout the day during a given time period. We could then establish whether the children’s levels of exposure were higher in their home or school environments.
Finally, this study emphasizes two important elements in the assessment of transportation-related environmental and social equity for children. On the one hand, this study indicates the importance of comparing the situation of a particular group with that of a control population (i.e. children at school compared with children at home). On the other hand, the performing of
intra-group comparisons according to the level of deprivation, as advocated by Collins et al. (2011), constitutes a recent advance in studies in environmental and social equity.
8. References
Akbari, H., Pomerantz, M., Taha, H. (2001) 'Cool surfaces and shade trees to reduce energy use and improve air quality in urban areas', Solar Energy, 70(3), pp. 295-310.
Amram, O., Abernethy, R., Brauer, M., Davies, H., Allen, R. (2011) 'Proximity of public elementary schools to major roads in Canadian urban areas', International Journal of Health Geographics, 10(68), pp. 1-11.
Apparicio, P., Cloutier, M.-S., Séguin, A.-M., Ades, J. (2010) 'Accessibilité spatiale aux parcs urbains pour les enfants et injustice environnementale : exploration du cas montréalais', Revue Internationale de Géomatique, 20(3), pp. 363-389.
Bolte, G., Tamburlini, G., Kohlhuber, M. (2009) 'Environmental inequalities among children in Europe - evaluations of scientific evidence and policy implications', European Journal of Public Health, 20(1), pp. 14-20.
Bowen, W. (2002) 'An analytical review of environmental justice research: what do we really know ?', Environmental Management, 29(1), pp. 3-15.
Brainard, J., Bateman, I., Lovett, A., Fallon, P. (2002) 'Modelling environmental equity: access to air quality in Birmingham, England', Environment and Planning A, 34(4), pp. 695-716. Briggs, D., Abellan, J., Fecht, D. (2008) 'Environmental inequity in England: small area associations between socio-economic status and environmental pollution', Social Science and Medicine, 67(10), pp. 1612-1629.
Brugge, D., Durant, J., Rioux, C. (2007) 'Near-highway pollutants in motor vehicle exhaust: A review of epidemiologic evidence of cardiac and pulmonary health risks', Environmental Health, 6(23), pp. 1-12.
Brunekreef, B., Holgate, S. (2002) 'Air Pollution and Health', Lancet, 360(9341), pp. 1233-1242.
Brunekreef, B., Janssen, N., Hartog, J., Harssema, H., Knape, M., van Vliet, P. (1997) 'Air pollution from truck traffic and lung function in children living near motorways', Epidemiology, 8(3), pp. 298-303.
Buzzelli, M., Jerrett, M. (2007) 'Geographies of susceptibility and exposure in the city: environmental inequity of traffic-related air pollution in Toronto', Canadian Journal of Regional Science, 30(2), pp. 195-210.
California, S.o. (2003) 'State Bill Number 352'.
Carslaw, D., Beevers, S., Tate, J., Westmoreland, E., Williams, M. (2011) 'Recent evidence concerning higher NOx emissions from passenger cars and light duty vehicles', Atmospheric Environment 45(39), pp. 7053-7063.
Cesaroni, G., Badaloni, C., Porta, D., Forastiere, F., Perucci, C.A. (2008) 'Comparison between various indices of exposure to traffic-related air pollution and their impact on respiratory health in adults', Occup Environ Med, 65(10), pp. 683-690.
CGTSIM (2013) 'Classification des écoles primaires et classification des écoles secondaires selon leur indice de défavorisation'.
Chaix, B., Gustafsson, S., Jerret, M., Kristerson, H., Lithman, T., Boalt, A., Merlo, J. (2006) 'Children's exposure to nitrogen dioxide in Sweden: investigating environmental injustice in an egalitarian country', Journal of Epidemiology and Community Health 60(3), pp. 234-241. Chakraborty, J. (2006) 'Evaluating the environmental justice impacts of transportation improvement projects in the US', Transportation Research Part D, 11, pp. 315-323.
Chakraborty, J. (2009) 'Automobiles, air toxics, and adverse health risks: environmental inequities in Tampa Bay, Florida', Annals of Association of American Geographers, 99(4), pp. 674-697.
Chakraborty, J., Zandbergen, P.A. (2007) 'Children at risk: measuring racial/ethnic disparities in potential exposure to air pollution at school and home', Journal of Epidemiology and Community Health 61(12), pp. 1974-1979.
Clark, N.A., Demers, P.A., Karr, C.J., Koehoorn, M., Lencar, C., Tamburic, L., Brauer, M. (2010) 'Effect of early life exposure to air pollution on development of childhood asthma', Environmental Health Perspectives, 118(2), pp. 284-290.
Collins, T., Grineski, S.E., Chakraborty, J., McDonald, Y. (2011) 'Understanding Environmental Health Inequalities through Comparative Intracategorical Analysis: Racial/ethnic Disparities in Cancer Risks from Air Toxics in El Paso County, Texas', Health & Place, 17(1), pp. 335-344.
Crouse, D., Goldberg, M., Ross, N. (2009a) 'A prediction-based approach to modelling temporal and spatial variability of traffic-related air pollution in Montreal, Quebec', Atmospheric Environment 43(32), pp. 5075-5084.
Crouse, D., Ross, N., Goldberg, M. (2009b) 'Double burden of deprivation and high concentrations of ambient air pollution at the neighbourhood scale in Montreal, Canada', Social Science & Medicine, 69(6), pp. 971-981.
Day, R., Wager, F. (2010) 'Parks, streets and “just empty space”: the local environmental experiences of children and young people in a Scottish study', Local Environment: The International Journal of Justice and Sustainability, 15(6), pp. 509-523.
Environment, B.C.M.o. (2006) 'Environmental Best Management Practices for Urban and Rural Land Development in British Columbia'.
ESRI (2011) 'ArcGIS Desktop: Release 10', Environmental Systems Research Institute, Redlands, CA.
Evans, G. (2003) 'The built environment and mental health', Journal of Urban Health, 80(4), pp. 536-555.
Feitelson, E. (2002) 'Introducing environmental equity dimensions into sustainable transport discourse: issues and pitfalls', Transportation Research Part D, 7(2002), pp. 99-118.
Forastiere, F., Peters, A., Kelly, F., Holgate, S.T. (2006) 'Nitrogen dioxide', Air quality guidelines : global update 2005, WHP, Copenhagen, Denmark.
Gauderman, J., Vora, H., McConnell, R., Berhane, K., Gilliand, F., al., e. (2007) 'Effect of exposure to traffic on lung development from 10 to 18 years of age: a cohort study', Lancet, 369(9561), pp. 571-577.
Geurs, K., Boone, V., Van Wee, B. (2009) 'Social impacts of transport: Literature review and the state of the practice of transport appraisal in the Netherlands and the United Kingdom', Transport Reviews, 29(1), pp. 69-90.
Green, R.S., Smorodinsky, S., Kim, J.J., McLaughlin, R., Ostro, B. (2004) 'Proximity of California public schools to busy roads', Environmental Health Perspectives, 112(1), pp. 61-66.
Hodgson, S., Namdeo, A., Araujo-Soares, V., Pless-Mulloli, T. (2013) 'Towards an interdisciplinary science of transport and health: a case study on school travel', Journal of Transport Geography, 2, pp. 70-79.
Hoek, G., Brunekreef, B., Goldbohm, S., Fischer, P., Van Den Brandt, P.A. (2002) 'Association between mortality and indicators of traffic-related air pollution in the Netherlands: a cohort study', Lancet, 360(9341), pp. 1203-1209.
Houston, D., Wu, J., Ong, P., Winer, A. (2004) 'Structural disparities of urban traffic in southern California: implications for vehicle-related air pollution exposure in minority and high-poverty neighborhoods', Journal of Urban Affairs, 26(5), pp. 565-592.
Janssen, N., Mehta, S. (2006) 'Human exposure to air pollution', Quality guidelines: global update 2005, World Health Organization (WHO), Copenhague, Danemark.
Jerrett, M., Shankardass, K., Berhane, K., al. (2008) 'Traffic-related air pollution and asthma onset in children: a prospective cohort study with individual exposure measurement', Environmental Health Perspectives, 116(10), pp. 1433-1438.
Kim, J.J., Huen, K., Adams, S., al., e. (2008) 'Residential traffic and children’s respiratory health', Environmental Health Perspectives, 116(9), pp. 1274-1279.
Kingham, S., Pearce, J., Peyman, Z. (2007) 'Driven to injustice? Environmental justice and vehicle pollution in Christchurch, New Zealand', Transportation Research Part D, 12(4), pp. 254-263.
Landrigan, P., Kimmel, C., Correa, A. (2004) 'Children’s health and the environment: Public health issues and challenges for risk assessment', Environ Health Perspect, 112, pp. 57-65. Maantay, J.A., Maroko, A.R., Hermann, C. (2007) 'Mapping population distribution in the urban environment: The cadastral-based expert dasymetric system (CEDS)', Cartography and Geographic Information Science, 34(2), pp. 77-102.
McConnell, R., Islam, T., Shankardass, K. (2010) 'Childhood incident asthma and traffic-related air pollution at home and school', Environ Health Perspect, 118(7), pp. 1021-1026. Mitchell, G., Dorling, D. (2003) 'An environmental justice analysis of British air quality. ', Environment and Planning A 35(5), pp. 909-929.
Pastor, M., Morello-Frosch, R., Sadd, J. (2006) 'Breathless: schools, air toxics, and environmental justice in California', Policy Studies Journal, 34(3), pp. 337-362.
Pastor, M., Sadd, J., Hipp, J. (2001) 'Which came first? Toxic facilities, minority move-in and environmental justice', Journal of Urban Affairs, 23(1), pp. 1-21.
Pham, T.-T.-H., Apparicio, P., Séguin, A.-M., Landry, S., Gagnon, M. (2012) 'Spatial distribution of vegetation in Montreal: An uneven distribution or environmental inequity?', Landscape and Urban Planning, 107(3), pp. 214-224.
Quebec (2013) 'Loi sur l'aménagement et l'urbanisme', Gazette officielle du Québec.
Rioux, C., Gute, D., Brugge, D., Peterson, S., Parmenter, B. (2010) 'Characterizing urban traffic exposures using transportation planning tools: an illustrated methodology for health researchers', Journal of Urban Health 87(2), pp. 167-188.
Ryan, P., LeMasters, G. (2007) 'A Review of Land-use Regression Models for Characterizing Intraurban Air Pollution Exposure', Inhalation Toxicology, 19(1), pp. 127-133.
Sampson, N. (2012) 'Environmental justice at school: understanding research, policy, and practice to improve our children's health', Journal of School Health, 82(5), pp. 246-252. SAS Institute Inc 'SAS version 9.3', Cary, NC, USA.
Schweitzer, L., Stephenson, J. (2007) 'Right answers, wrong questions: environmental justice as urban research', Urban Studies, 44(2), pp. 319-337.
Statistics-Canada (2011) '2011 Census data'.
Stuart, A., Zeager, M. (2011) 'An inequality study of ambient nitrogen dioxide and traffic levels near elementary schools in the Tampa area', Journal of Environmental Management, 92(8), pp. 1923-1930.
Thomopolous, N., Grant-Muller, S. (2013) 'Incorporating equity as part of the wider impacts in transport infrastructure assessment: An application of the SUMINI approach', Transportation, 40, pp. 315-345.
Thomopolous, N., Grant-Muller, S., Tight, M.R. (2009) 'Incorporating equity considerations in transport infrastructure evaluation: Current practice and a proposed methodology', Evaluation and Program Planning, 32(4), pp. 351-359.
Walker, G. (2009) 'Beyond distribution and proximity: exploring the multiple spatialities of environmental justice', Antipode, 41(4), pp. 614-636.
Walker, G. (2010) 'Environmental justice, impact assessment and the politics of knowledge: The implications of assessing the social distribution of environmental outcomes ', Environmental Impact Assessment Review, 30, pp. 312-318.
Walker, G. (2011) 'Environmental justice: concepts, evidence and politics', in Routledge (ed), New York.
Wang, C., Quddus, M., Ryley, T., Enoch, M., Davison, L. (2011) 'Spatial models in transport: a review and assessment of methodological issues', Transportation Research Board 91st Annual Meeting Washington DC.
Wu, Y.-C., Batterman, S.A. (2006) 'Proximity of schools in Detroit, Michigan to automobile and truck traffic', Journal of Exposure Science and Environmental Epidemiology 16(5), pp. 457-470.
Zahran, S., Mielke, H., Weiler, S., Berry, K., Gonzales, C. (2009) 'Children’s blood lead and standardized test performance response as indicators of neurotoxicity in metropolitan New Orleans elementary schools', Neurotoxicology, 30(6), pp. 888-897.