Scheduling flows over LEO constellations on LMS channels
Bastien Taurani
1, Emmanuel Lochin
1, J´
erˆ
ome Lacan
1,
Fabrice Arnal
2, Mathieu Gineste
2, Nicolas Kuhn
31
ISAE-SUPAERO Universit´
e de Toulouse T´
eSA, Toulouse, France
2Thales Alenia Space, Toulouse, France
3
Centre National d’Etudes Spatiales, Toulouse, France
Abstract
Satellite systems typically use physical and link layer reliability schemes to compensate the significant channel impairments, especially for the link between a satellite and a mobile end-user. These schemes have been introduced at the price of an increase in the end-to-end delay, high jitter or out-of-order packets. This is show to have a negative impact both on multimedia and best-effort traffic, decreasing the Quality of Experience (QoE) of users. In this paper, we propose to solve this issue by scheduling data transmission as a function of the channel condition. We first investigate existing scheduling mechanisms and analyze their performance for two kinds of traffic: VoIP and best-effort. In the case of VoIP traffic, the objective is to lower both latency and jitter, which are the most important metrics to achieve a consistent VoIP service. We select the best candidate among several schedulers and propose a novel algorithm specifically designed to carry VoIP over LEO constellations. We then investigate the performance of the scheduling policies on Internet-browsing traffic carried by TCP, where the goal is now the maximize the users’ goodput, and select the best candidate in this case.
1
Introduction
The context of this work concerns the emerging satellite constellations like O3B or Oneweb which aim to provide high-speed Internet access across the globe. Satellite industry historically focuses on designing quasi-error-free links for improving the usage of the scarce radio resource but this objective induces constraints on the end-to-end protocols. Indeed, such systems use TCP connections in a very specific context : variable and quite long delays and potential packet losses on the last satellite. The increasing amount of constellation projects rarely come along with end-to-end evaluations and the need for the deployment of proxies in such situation. Moreover, the emergence of on-board processing in LEO payloads opens the room for a better repartition of the satellite resource in accordance with the propagation characteristics and quality of service needs. The distribution of such function in the last-hop segment opens the room for more flexibility in the satellite segment for requires investigations of the adequate load balancing algorithm and the impact on end-to-end protocols.
Low Earth Orbit (LEO) satellite constellations allow to provide internet access to isolated or rural areas anywhere on earth. Different kinds of traffic can be transmitted through these constellations: best-effort, VoIP (Voice over IP) or video. LEO delays are in the same order of magnitude than on terrestrial networks, but the high channel constraints, mostly on Land Mobile Satellite (LMS) channels [7, 25], imply the need of efficient reliability mechanisms. However, their use has an impact on the end-to-end transmission delay and jitter.
To cope with the high channel impairments experienced by the LMS channel, reliability mechanisms have been introduced [29, 12, 24]. One of the most efficient is Hybrid Automatic Repeat reQuest (HARQ), which combines forward error-correction codes and link layer retransmission. This mechanism is introduced on the LMS link between the last satellite on the packet route and the ground receiver. We consider in this paper type II HARQ, which is commonly deployed inside physical layers. Depending on the channel quality at the moment of the transmission, the duration of the decoding of a packet on the ground receiver might vary and the cost in terms of capacity (linked to the redundancy ratio) might also vary on the LMS link. At last but not least, this obviously also increases the jitter of the communication.
When several users are transmitting data over a LMS channel, they compete for capacity over the same link which becomes the bottleneck of the network. If no scheduling policy is enabled, all packets are queued in a FIFO manner and dequeued without taking into account the quality of the channel before transmission. This problem is not new, scheduling transmission to optimize the use of the LMS link has been deeply tackled by the satellite networking community [30, 17, 8]. In particular in [16, 15], different metrics to schedule the packets, such as the throughput or the waiting time of the enqueued packets are investigated. Depending on
the application chosen, VoIP carried by UDP or Internet browsing carried by TCP, we assess which scheduler is more fitted for each case, to optimize user QoE.
We review in the following a set of potential scheduling mechanisms that could be used considering the service we seek to obtain for each flow. This state of the art leads us to the choice of Proportional Fairness, due to the way this scheduler optimizes the channel capacity. During our evaluations, realized with the network simulator ns-2 where supplmentary capabilities have been added, we observed that for VoIP traffic, a queuing management should be conjointly considered with the scheduling. Thus our proposal, Controlled Delay Scheduler (CoDeS), is based on the joint use of a scheduler and a queue management scheme.
In Section 3, we detail the scenario used in our simulations, the LMS reliability scheme and the networking conditions. We also present the different schedulers tested. In Section 5, we present and analyze the results measured on the most important metrics such as throughput, latency, losses and jitter, in case of VoIP traffic. Then in Section 6, we propose CoDeS and present the benefits obtained in this context, and those obtained with TCP traffic, corresponding to Internet browsing.
2
State of the art
2.1
Satellite environment
The number of satellites is constantly increasing, being good solutions for various applications such as earth observation, military purposes, or telecommunications. Telecommunication satellites enable several applications such as telephone, television, or Internet access. Lower costs and better performance have led to the deployment of more than 2000 communication satellites.
For transmissions between two points on earth via one or several LEO satellites, the use of the standard Internet protocols is unavoidable, as the end-points ignore the presence of space links. In this context, LEO satellite constellations are adapted to the TCP/IP stack, due to the low delays, comparable to terrestrial ones, and the low attenuation between the satellite and the ground due to the low altitude. This leads to smaller power needed by the satellites and the terminals, and smaller antennas [9]. Then, the low launch cost of a satellite, which is cheaper and more efficient, makes the deployment of a constellation feasible.
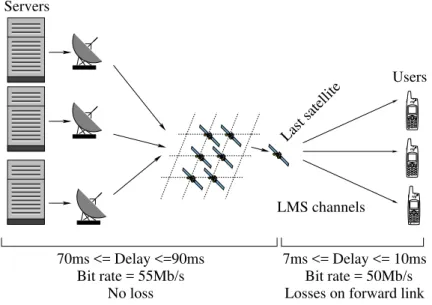
To ensure a better performance, constellations can use Inter-Satellite Links (ISL) [32] to allow commu-nications between a satellite and its closest neighbors. In this case, a satellite can transfer data to the previous and next satellites on a same plane and to the closest satellites on the neighbors planes, creating a global grid around the earth, as shown in Figure 1.
00 00 00 00 00 11 11 11 11 11 00 00 00 00 00 00 11 11 11 11 11 11 00 00 00 00 00 11 11 11 11 11 00 00 00 00 00 00 11 11 11 11 11 11 00 00 00 00 00 11 11 11 11 11 00 00 00 00 00 00 11 11 11 11 11 11 00 00 00 00 00 11 11 11 11 11 00 00 00 00 00 00 11 11 11 11 11 11 0000 00 00 00 11 11 11 11 11 00 00 00 00 00 00 11 11 11 11 11 11 00 00 00 00 00 11 11 11 11 11 00 00 00 00 00 00 11 11 11 11 11 11 00 00 00 00 00 11 11 11 11 11 00 00 00 00 00 11 11 11 11 11 0000 0000 1111 1111 Servers Users Last satellite No loss 70ms <= Delay <=90ms 7ms <= Delay <= 10ms LMS channels
Losses on forward link Bit rate = 50Mb/s Bit rate = 55Mb/s
Figure 1: Communication via a satellite constellation with ISL However, LEO satellite constellations bring out new problems specific to this topology: • a high delay variation due to the satellites movements and route changes;
• a high error rate, mainly on the link between the last satellite on the message path and the ground receiver. Thus, the travel through the atmosphere, the receiver environment and possible interference generate errors that need to be recovered. In the case of a mobile receiver on the ground, we can represent this link with a Land Mobile Satellite (LMS) channel [18, 7, 25]. The LMS channel is the bottleneck
of the network due to its error rate making its capacity lower than the other links, and where the most attention is needed.
The LMS channel cannot be easily represented, this channel is very different from the links between satellites and the links on the ground: the elevation angles are within a large range of values, and is highly correlated with the position of the ground receiver. The channels can be grouped in different categories depending on the receiver location and movements: urban, suburban, rural or open for example. In this paper, we use attenuation time series provided by CNES1, which follow the model presented in [25].
2.2
On channel capacity and Mutual Information
In our study on mobile satellite communications, we consider an LMS channel to model this environment. We explain in this section hhow we compute the capacity of this channel.
Channel capacity quantifies the maximum achievable transmission rate of a system communicating over a band-limited channel, while maintaining an arbitrarily low error probability. It corresponds to the maximum of the mutual information between the input and output of the channel, where the maximization is done with respect to the input distribution. Mutual information is one of the main metric introduced in Information Theory by C. Shannon which basically corresponds to the maximum useful throughput of a link. This metric was used in the HARQ technique chosen in our scenario [3] and further detailed Section 3.2 to estimate the average number of bits that must be sent at each transmission to allow the receiver to decode the codeword with a targeted probability.
One of the reference propagation models for LMS channel is a statistical model based on a three state Markov chain [26]. This model considers that the received signal originates from the sum of two components: the direct signal and the diffuse multipath. The direct signal is assumed to be log-normally distributed with mean α (decibel relative to LOS (Line Of Sight)) and standard deviation Ψ (dB), while the multipath component follows a Rayleigh distribution characterized by its average power, M P (decibel relative to LOS). This model is called Loo distribution [19][10].
The problem is tackled in a different manner in [13] where the authors propose a predictive model for video traffic in the context of SATCOM systems. The proposed system lays on a predictive backpressure algorithm that estimates future packets arrival to efficiently schedule outgoing packets with the constraint to minimize the waiting time of packets after they enter the queue. In [14], the same authors propose an interesting idea which operates to a load balancing between LEO and GEO links using GEO relays. Similarly, several studies have focused on maximizing overall SATCOM system capacity and this is indeed a key aspect, but for SATCOM providers, end-users Quality of Experience (QoE) when standard unicast internet applications are used is a key metric. As previously said, the increasing amount of constellation projects rarely come along with end-to-end evaluations and the need for the deployment of proxies in such situation while this study aims at filling this gap.
Finally for the modelling of the LMS channel in our simulations, we use attenuation time series using a propagation simulator based on the three state channel [26][19] provided by CNES. Using this tool we calculate the distribution of the probability to obtain an attenuation in the channel for a given environment.
2.3
Services provided by LEO constellations
LEO satellite constellations permit deployment of VoIP services. This kind of traffic is very sensitive to the latency and the jitter. Following ITU-T G114 [2], the maximum acceptable delay for toll quality satellite links is 400 ms (note this value is a maximum, a fair compromise is to be around 200 ms). However, a high jitter cannot be tolerated and must be minimized [2]. Similarly, losses cannot be higher than 3 % without decreasing the transmission quality and the user satisfaction. The challenge is to find a solution to minimize losses and jitter, while allowing to maximize the throughput for each user.
To deploy such a service, one possible solution could have been to use a Call Admission Control (CAC) [5]. However, the high variability of the channel over time makes CAC not suitable. Ensuring each user to always have a minimum capacity guaranteed would involve to continuously monitor the channel to assess a kind of worst case of the channel capacity. In our case, the channel can in rare occasions reach an attenuation of 60 dB, and taking this worst case as a reference would imply a very low number of users that can share the channel, which would result in an under-utilization of the link capacity. Our proposal makes a compromise between the number of users sharing the channel with average good conditions, and the use of the LMS channel capacity.
To characterize the transmission quality, we compute the Mean Opinion Score (MOS), giving information on the user satisfaction. Basically, the MOS is computed as follows [1]:
R = R0− Is− Id− Ie+ A (1)
where:
• R0is the basic SNR (Signal Noise Ratio); • Isis the simultaneous impairment factor; • Id is the delay impairment factor; • Ieis the equipment impairment factor;
• A is the advantage factor. It is linked to users who can accept a lower quality taking into account the context of the transmission. With the use of satellite communications, this factor is set at 20 [1].
Then the MOS is computed from the R-factor following (2):
M OS = 1 + 0.035R + 7.10−6R(R − 60)(100 − R) (2)
LEO constellations are also suited for best-effort traffic, carried by TCP. Thus, the objectives are now: 1. a good delivery of every packets without any error;
2. to maximize the transmission goodput (application throughput) for each user.
In that case, the choice of a scheduling policy must ensure a transmission as fast as possible of every packet on the LMS channel while avoiding out-of-order packets and TCP timeout. The schedulers chosen are presented in Section 4, and are tested with different numbers of parallel flows, simulating different loads. We also enable and disable the reordering mechanism presented in Section 3.2 to study its impact.
As it is impossible to isolate the space segment, standard TCP protocols need to be used. Thus, we study the two main TCP variants used for terrestrial transmissions:
• TCP NewReno (denoted NR in the Figures and Tables): even though this variant is less and less populating the Internet, this protocol is used as a reference case for our simulations and its basic functionalities make its behavior easier to understand than more sophisticated protocols;
• CUBIC: we also consider this TCP variant since its error recovery is more aggressive than TCP NewReno and it is enabled by default in several Operating Systems: GNU/Linux, OSX systems (since 10.9) and Windows (since Windows 10 Fall Creators Update).
3
Simulation hypothesis
This section presents the satellite scenario, how we simulate the satellite environment, the different schemes that are considered throughout this paper and in particular: the reliability mechanisms on the LMS channel to deal with the high error rate and the kind of traffic used.
3.1
Constellation chosen
We have chosen Network Simulator 2 (ns-2) to simulate the satellite environment. The scenario is composed of 66 LEO satellites at an altitude of 800 km, ensuring a global coverage of any point on earth at any time. Due to the movement of the satellites and route changes, the transmission delay varies from 70 ms to 90 ms within the satellite constellation (data obtained with SaVi [34] and detailed in the following). Moreover, except on the LMS forward link, we consider an error free path, as shown in Figure 1, between the sender and the last satellite. Finally, messages are sent from the server to mobile receivers through the satellite constellation.
In our simulations, several transmissions are passing through the constellation, from different sources, to different destinations, but having always the same last satellite on their route path. The last hop is from the same satellite to different ground receivers, involving independent LMS channels. In this scenario, the last satellite and the LMS channels are the bottleneck of the network.
To mimic the topology illustrated in Figure 1, we use three nodes to represent the sender, the last satellite on the message route, and the receiver. The satellite constellation is simulated by varying the delays between the nodes. We used SaVi [34] to get the parameters of the previously described LEO satellite constellation. Then we simulate the constellation to assess the evolution of the delays between the sender and the last satellite, and between the last satellite and the ground receiver. From this point, all ns-2 simulations are played using the three nodes and the temporal traces generated. The simulations are run over a LMS channel between the last satellite and the ground gateway in an Intermediate Tree Shadowed (ITS) environment. In our simulations, we use channel model where the Doppler shift has been estimated and compensated, thus we do not need to take it
into account in this study. We vary the average quality of this channel by setting a reference Signal Noise Ratio (SNR) ranging from 7 dB to 13 dB. During the simulations, the link quality changes over the time around this SNR reference value. Each simulation lasts 100 s with a varying number of flows performing. Each flow uses the same temporal trace but with different offset values to simulate different route paths and transmission delays. In the same way, each flow uses the LMS channel with a different offset value to simulate independent channels. Moreover, we improved the confidence of the results by running several simulations starting the temporal traces at different times to obtain a consistent statistical set and analysis.
3.2
Hybrid Automatic Repeat reQuest
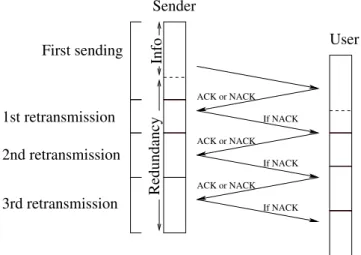
To mitigate link-layer impairments on the LMS channels, an efficient solution is to use Hybrid Automatic Repeat reQuest (HARQ) schemes. These schemes aim to compensate the high error rate characterizing such channels and optimize their usage by combining both ARQ and Forward Error Correction codes. Modern communication standards such as 3G [11] or LTE [6] are based on HARQ and show good performance. In our case of satellite transmissions, we choose a recent proposal called Adaptive-HARQ [3], which is an improvement of type II HARQ, tuned for satellite contexts. This scheme uses mutual information to compute the optimal number of bits to send at each retransmission and allows up to 3 retransmissions in case of erased packets. The principle detailed in Figure 2 is as follows: the receiver side of the HARQ link stores the bits received while a packet has not been decoded. Each time useful or redundancy bits are received, the algorithm computes whether enough data has been received to decode the packet. If not, a negative ACK is sent to the HARQ sender, asking for more redundancy bits. In the worst case, the packets are recovered at most 70ms after entering HARQ module, which corresponds to the time needed to get both the first transmission and the 3 retransmissions.
000 111 000 111 000 111 00 11 00 11 00 11 000000000000 000000000000 000000000000 000000000000 000000000000 111111111111 111111111111 111111111111 111111111111 111111111111 000000000000 000000000000 000000000000 000000000000 111111111111 111111111111 111111111111 111111111111 000000000000 000000000000 000000000000 000000000000 111111111111 111111111111 111111111111 111111111111 000000000000 000000000000 000000000000 000000000000 000000000000 111111111111 111111111111 111111111111 111111111111 111111111111 000000000000 000000000000 000000000000 000000000000 000000000000 111111111111 111111111111 111111111111 111111111111 111111111111 000000000000 000000000000 000000000000 000000000000 111111111111 111111111111 111111111111 111111111111 000000000000 000000000000 000000000000 000000000000 000000000000 111111111111 111111111111 111111111111 111111111111 111111111111 Sender User If NACK If NACK If NACK ACK or NACK ACK or NACK ACK or NACK Info Redundancy
At each reception, computes if the packet can be decoded
First sending
2nd retransmission 1st retransmission
3rd retransmission
(i.e. if it has received enough data)
Figure 2: Description of type II HARQ
The varying transmission time leads to increase the flow jitter, each additional retransmission of HARQ makes the packet decoded 20 ms later, highly degrading the quality of the communication with UDP or gen-erating DUPACK with TCP which leads to poor performance. To cope with this high jitter, a reordering mechanism has been proposed in [33], allowing the packets to be delivered in-order to the transport layer, at the price of a higher transmission delay as illustrated in [28]. This mechanism greatly improves TCP performance, by reducing the number of false positive loss detection and spurious retransmissions caused by out-of-order packets.
HARQ also exists on data transmission for mobile phones such as LTE or future 5G networks [27], where transmission delays are lower. In a satellite communication context, long delay links make difficult to transpose terrestrial solutions [23] aiming at optimizing transmissions with HARQ.
4
Our proposal: scheduling users to improve performance
When several users are transmitting from a mutual last satellite, as shown in Figure 1, if no additional mechanism is introduced, each user obtains the above decoding proportions with HARQ. As a matter of fact, an important proportion of the LMS channel is used to transmit redundancy and not useful bits. In this section, we seek to improve this number of useful bits transmitted.
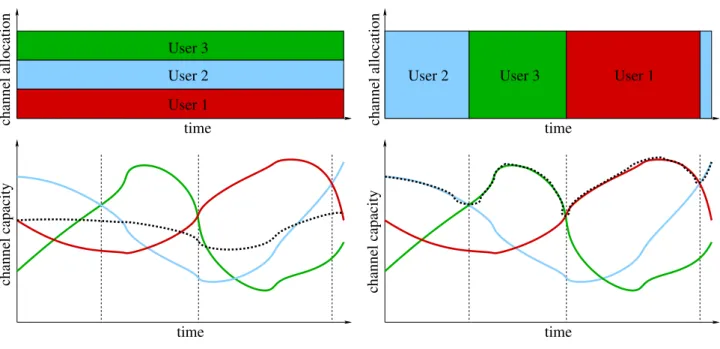
All the users, sharing the same last satellite, have different mobile receivers on ground, and then different LMS channels. Each LMS channel evolution is different and independent from the others: one user can have momentarily bad channel conditions while another has very good conditions. Thus, an idea is to favor the users when their channel condition becomes good, to optimize the use of the LMS channel capacity: more useful bits sent of the channel and less redundancy bits.
Such scheduling mechanism aims to send the packets only to the user having momentarily the best channel capacity, as shown in Figure 3. The capacity needed to decode each packet is then lower, and more useful data can transmit the link in the same time.
User 1 User 3 User 2 time time channel capacity channel allocation Before scheduling User 1 User 2 User 3 channel allocation channel capacity time time After scheduling
Figure 3: LMS channel optimization, the average capacity used for all the users is shown with the dotted curve
Algorithm Metric Traffic Computation complexity
PF [22] Throughput Best-effort Very low
M-LWDF [30] Throughput and time in buffer Real-time Low
EXP-PF [31] Throughput and time in buffer Real-time and BE Low
UBMT [17] Throughput and time in buffer All Medium
BBS and BPS [8] Throughput or time in buffer Depends on metric High Table 1: Comparison of different schedulers
Different kinds of schedulers have been introduced to optimize channel capacity and transmission delay in several communication contexts. They can use different metrics as the throughput of the link or the wait-ing time in the queue to schedule packets transmission. Some studies have already compared main existwait-ing algorithms [16, 15] in a satellite context. The main results are summarized in Table 1. This table classifies these mechanisms as a function of the metric they seek to optimize. Among them, we choose for both VoIP and best-effort transmissions, Proportional Fairness (PF) against M-LWDF and EXP-PF (although defined for real-time transmission) or generic algorithm such as BBS and BPS for several reasons:
• PF is a well-known [22] and efficient scheduling system for fairness, simple to implement and computational efficient;
• We measured the gain that can be obtained on the LMS channel in a first batch of analysis and observed that optimizing the LMS channel can lead to a throughput gain up to 60 % compared to no scheduling policy. We show in this paper that PF performs results close to this optimum, thus no other scheduler can bring a real improvement compared to PF;
• We demonstrate in the following that adding a simple queue management scheme to PF allows to efficiently handle real-time traffic.
Proportional Fairness, which uses the throughput of the channel at the moment of transmission to send the packet having the best conditions while minimizing the channel usage, is a good candidate to optimize the LMS channel capacity. Packets entering the scheduler are stored in different queues based on the user’s destination. There are as many queues as there are flows using the link. Each sending round, the scheduler selects a packet to send for all queues, following (3):
fi(r) = ri(t) ri(t)
(3) where ri(t) is the throughput of the channel at time t and ri(t) is the smoothed throughput computed using exponential moving average. All the flows having an independent LMS channel evolution, we can ensure that the throughputs are all independent over time, and thus all different. The flow i∗ elected to be transmitting is the one having the biggest fi(r) value. This value is computed as follows:
i∗= argmax(fi(r)) (4)
The channels being independent, the flow with the best value changes over time, allowing all the flows to be sent during the simulation. Furthermore, the division by ri(t) implies that a flow cannot be sent during a too long time even if its channel quality is still good, to ensure short-term fairness between the flows and prevent large latency and jitter variations to other flows.
In real systems, the estimation of the LMS channel quality is obviously not instantaneous. The scheduler should get this estimation within a small delay. We neglect to consider this additional and fixed delay in our simulations. Indeed, this delay cannot be higher than the transmission time over the LMS link (≈ 10 ms). So we can safely consider that the channel should not greatly evolve within this short time period.
We study PF performance in Section 5, then we propose in Section 6 an improvement of PF to take into account the transmission delay and make it suitable for VoIP traffic while optimizing the LMS channel capacity. We compute each queue size using the well-known formula given in [4]. The total buffer capacity is B = RT T ∗ C/√n, which is a more accurate extension of the common rule B = RT T ∗ C, and where RT T is the average Round-Trip Time of the flows, C is the bandwidth of the LMS link, and n is the number of flows sharing this link. Thus with PF, each queue has a size of B/n in order to have a total capacity of B. The number of users n can easily be computed by the scheduler by identifying the number of destinations.
We compare in this paper PF scheduler performance with other schedulers and queuing policies:
• Round Robin (RR): this scheduler does not take into account the quality of the channel when a packet is dequeued, and thus is not optimizing it. Each queue is served alternatively sending only one packet, then letting the other flows being transmitted;
• DropTail Small buffer (DT S): only one queue with FIFO policy, the size of the queue is the same than in one queue of PF or RR, i.e. B/n. Thus the global storage capacity is different from PF or RR; • DropTail High buffer (DT H): only one queue with FIFO policy, the size of the queue is B, meaning the
same total capacity than PF or RR.
5
Performance analysis
We first study the transmission performance in case of VoIP traffic, following ITU-T G114. We drive our analysis by comparing each policy in terms of queue size, latency, and considering the resulting performance. We also compute the Mean Opinion Score as a QoE metric to assess user satisfaction.
We simulated different loads by varying the number of simultaneous flows. The number of flows is ranging from 50, where the global throughput is low and the buffers are never full, to 500 where the throughput entering the LMS channel is higher than its capacity, resulting in several tail drops.
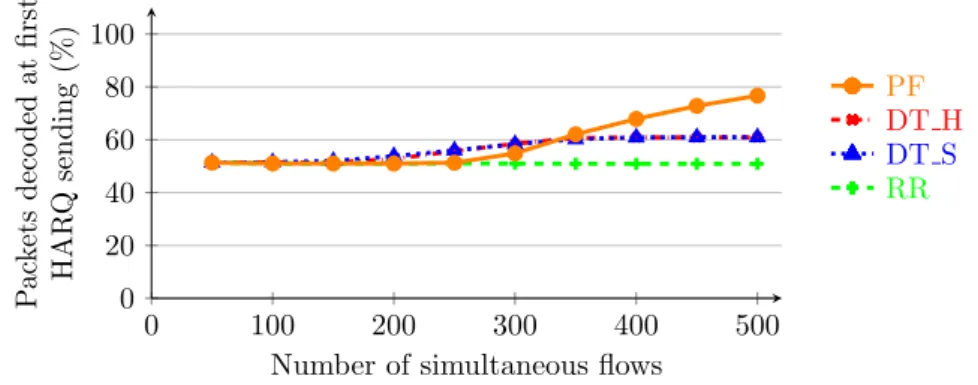
Before comparing performance of each policy, we observed that the maximum capacity of the LMS channel, which is the bottleneck of our network, is reached for a number of users between 250 and 300. For higher number of users, the number of packets dropped, either by HARQ or queue overflow, both decreases communication performance and user satisfaction. Following these experiments, we estimated the saturation point at 300 users. We first observe in Figure 4 that when the system has to manage several flows, PF achieves a better throughput than the other policies. This is due to the better performance of HARQ, a packet being sent only when its channel has a low attenuation, as seen in Figure 5. Thus, more packets are decoded at the first HARQ transmission, leading to less retransmissions and a better LMS channel capacity usage.
When the system is not at saturation, we observe that DT policies allow more often to decode packets at first try than RR or PF. However, the number of packets decoded with 1, 2 or 3 retransmissions is lower with DT, and finally the total number of packets decoded is lower as we can see in Table 2. The higher number
of retransmissions with PF and RR does not negatively impact on the transmission quality because the LMS channel is not saturated, and can handle more retransmissions.
0 100 200 300 400 500 0 10 20 30 40 50 60
Number of simultaneous flows
Throughput p er flo w (kb/s) PF RR DT H DT S
Figure 4: Throughput obtained with different policies
0 100 200 300 400 500 0 20 40 60 80 100
Number of simultaneous flows
P ac k ets deco ded at fir st HAR Q sending (%) PF DT H DT S RR
Figure 5: Percentage of packets decoded at first HARQ sending with different policies
Policy Number of retransmissions (%)
0 1 2 3 Drop
DT S 58.83 18.85 14.88 7.06 0.38 DT H 58.49 18.93 14.74 6.98 0.86 RR 50.96 25.73 19.07 3.82 2.34 PF 54.84 26.75 15.49 2.63 0.29 Table 2: HARQ performance comparison with 300 users
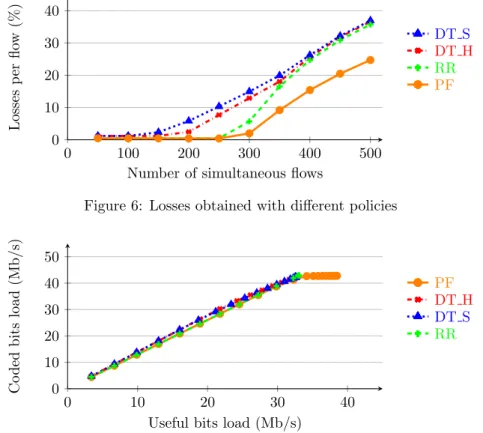
As a consequence, and as we can see in Figure 6, PF experiences less losses than other policies. As each packet uses less capacity of the LMS link, the scheduler can send more packets on this link decreasing the queue backlog. This allows more packets to be transmitted and to reduce drop due to buffer overflow.
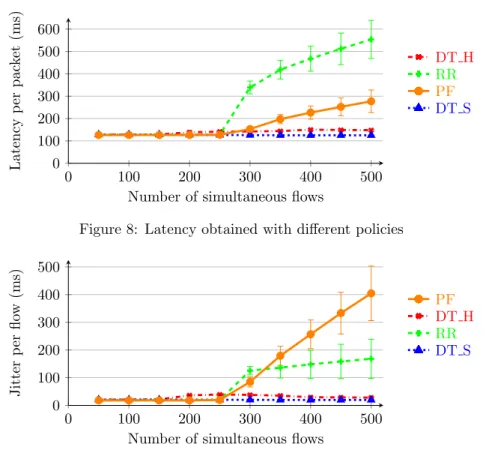
Figure 7 has been generated by plotting the coded bits load of the LMS channel, depending on the useful bits load. Each point of a curve represents a different number of parallel flows. It shows that PF performs a better usage of the LMS channel than the other policies. Thus, for a same number of coded bits, PF can transmit more useful bits (meaning less redundancy bits) and the LMS channel is optimized with this scheduling policy. Concerning the other metrics, we observe in Figure 8 that packets have a very long transmission time when using RR. Packets sent with PF need more time than DT S, but in acceptable ranges that are taking into account the context of satellite communications.
Finally the PF scheduling policy drastically increases the jitter. This increase is due to packets staying in the buffer as long as they need to have a good channel. The duration varies significantly and is unpredictable, resulting in high jitter. As a matter of fact, high jitter strongly penalizes the quality of experience in particular for VoIP users [1], and needs to be lowered if we want to use PF in our context.
To summarize, we can observe that RR policy provides very bad performance. For this one, the high buffer capacity increases the latency. Thus, when the queues are full, the packet waiting time is B times the transmission time of a packet, where B is the total buffer capacity. This latency cannot be lowered. In addition
0 100 200 300 400 500 0 10 20 30 40
Number of simultaneous flows
Losses p er flo w (%) DT S DT H RR PF
Figure 6: Losses obtained with different policies
0 10 20 30 40 0 10 20 30 40 50
Useful bits load (Mb/s)
Co ded bits load (Mb/s) PF DT H DT S RR
Figure 7: LMS channel spectral efficiency
to the fact that this policy does not optimize the LMS channel capacity by reducing the number of HARQ retransmissions, the global performance of RR makes it bad candidate in our scenario, and can already be discarded.
At first sight, DT S may appear a good candidate due to its low jitter and latency, but the high error rate, even when there are a low number of flows, highly penalizes its performance. This high number of losses is caused by the low buffer capacity. This low capacity prevents a lot of users to use the scheduler simultaneously: with 300 users, we observe already more than 15 % of losses, implying that the number of simultaneous users has to be lower than 300. On the other hand, for the same number of users, PF loses only 2 % of the packets, which remains acceptable. Moreover, DT S does not implement a scheduling policy taking into account the channel quality, limiting performance of HARQ, as presented in Table 2.
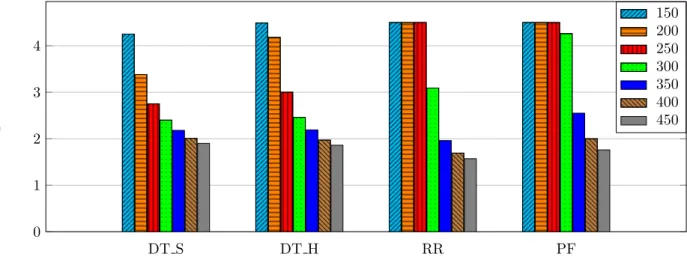
We can see in Figure 10 that the MOS is higher for PF when a low number of users are transmitting compared to DT S, which is penalized by the high error rate. PF achieves a good score up to the LMS channel saturation, with a MOS value higher than 3. We also have to keep in mind that in the context of satellite communications, the high delay always negatively impacts on the MOS, compared to terrestrial connection.
Unlike DT S, PF considerably improves the throughput but at a price of a very high jitter. Because the packets are sent on the LMS channel only when the attenuation is low, the packets may wait a long time before getting good conditions. This waiting time varies significantly, cannot be predicted, and is the main cause of this high jitter, which is highly decreasing the communication quality and the user satisfaction. This high jitter needs to be lowered if we want to use PF as a scheduling mechanism. We present in Section 6 a solution answering this problem.
6
Improving VoIP performance
6.1
Controlling the queuing delay to improve VoIP performance with CoDeS
We have seen in Section 5 that PF optimizes the LMS channel capacity, but at a price of a high delay and jitter, which decreases the user QoE. To take into account the sojourn time of the packets in the queues, we propose to add a queue management policy to PF. We call this new mechanism Controlled Delay Scheduler (CoDeS). Basically, CoDeS sets a timeout threshold value beyond which packets are dropped. Indeed, in VoIP transmissions, packets have a temporal deadline beyond which they will be discarded and not played by the VoIP receiver. Keeping outdated packets in the queues would uselessly consume buffer capacity and then LMS channel capacity during the transmission to the ground receiver. Thus, the global aim of this scheduler is
0 100 200 300 400 500 0 100 200 300 400 500 600
Number of simultaneous flows
Latency p er pac k et (ms) DT H RR PF DT S
Figure 8: Latency obtained with different policies
0 100 200 300 400 500 0 100 200 300 400 500
Number of simultaneous flows
Jitter p er flo w (ms) PF DT H RR DT S
Figure 9: Jitter obtained with different policies
to decrease both latency and jitter by dropping packets thanks to this timeout threshold, preventing buffer overflow.
6.2
Case of VoIP traffic
Improvements brought out by CoDeS compared to PF are given in Figure 11, where the timeout value has been set to 100 ms. We can observe as expected a decrease of the latency and the jitter, without impacting the other metrics. The number of losses is approximately the same than with PF, with acceptable values up to 300 users. However the cause of the drops is different. With CoDeS, packets can be dropped due to timeout, freeing space in the buffer for new packets, that would have been dropped with PF (i.e. without queuing management) due to buffer overflow. The total amount of drops is finally slightly the same with the two policies, but the mean sojourn time of the packets is lower with CoDeS.
Thus, CoDeS improves the transmission quality by lowering both delay and jitter, but does not improve LMS channel optimization compared to PF. Indeed, we only added to PF a queuing management, which has no effect on the LMS link scheduling. The value of 300 users is still the limit in our simulations beyond which any scheduling policy looses too many packets to achieve a good user QoE.
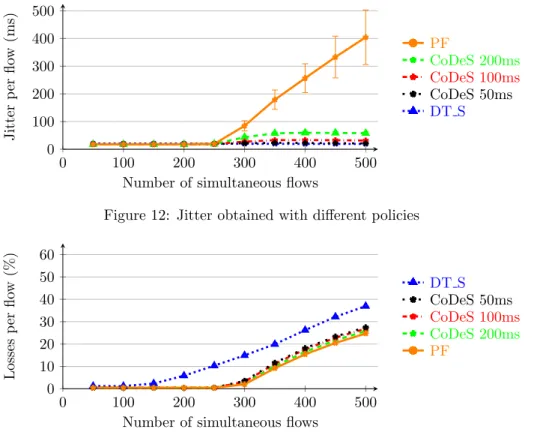
We tested CoDeS with different queue timeout values to find the best configuration. The lower the value is, the lower jitter and latency are, without impacting the other metrics, up to a minimal limit reached with a timeout around 50 ms. In Figure 12, compared to a timeout value of 100 ms, we observe as we could expect that the jitter is higher with a timeout of 200 ms. On the other hand, with lower values such as 50 ms, the number of losses slightly tends to increase, as seen in Figure 13. This increase is due to the packet drops occurring too early, totally emptying the buffers instead of keeping them full. Thus, a correct value of timeout should be set between 50 and 100 ms, to have the best compromise between jitter and losses.
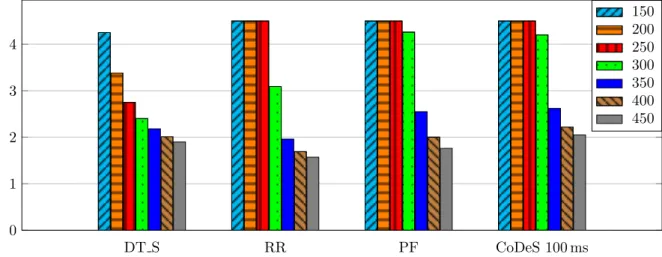
In Figure 14, we can see an increase of the MOS with CoDeS, with the timeout value of 100 ms. For the same number of flows, CoDeS slightly increases the MOS compared to PF, when the system becomes saturated. The MOS values with CoDeS are also higher than DT S, due to the low number of losses, latency and jitter. Thus, by combining scheduling policy on the LMS channel and queue management, CoDeS achieves a good QoE, while optimizing the LMS channel capacity.
6.3
Results with best-effort traffic
We have seen in the previous Section that in the case of VoIP traffic and UDP protocol, CoDeS obtains good results in terms of LMS channel capacity optimization and QoE of the users. We now study the impact of
DT S DT H RR PF 0 1 2 3 4 Mean Opinion Score 150 200 250 300 350 400 450
Figure 10: Mean Opinion Score of scheduling policies (x-axis) as a function of the number of flows given in the table caption (equiv. to the number of users)
Throughput Latency Losses Jitter Packet decoded at
1st HARQ sending 0 0.5 1 1.5 Ratio CoDeS/PF 150 200 250 300 350 400
Figure 11: Comparison of the ratio of performance between CoDeS and PF, as a function of different metrics (x-axis) with a timeout of 100 ms and for different number of flows given in the table caption (equiv. to the number of users)
the schedulers detailed before in the case of best-effort traffic, carried out by TCP, and assess if our previous conclusions are still valid.
We test the same scheduling policies than previously. We keep DT H, DT S and RR as comparison basis, and study the impact of PF and CoDeS:
• PF is totally suited of best-effort traffic, thus we study its impact on TCP performance compared to the other policies;
• CoDeS adds a drop policy in the queues based on a timeout. We need to study whether this scheme is still relevant in the case of TCP traffic.
6.3.1 Impact of scheduling on TCP without reordering
We plotted the goodput gain achieved, compared to DT H (a simple FIFO queue with the same buffer capacity than PF or RR), for each TCP user, depending on the number of parallel flows, for TCP NewReno in Figure 15 and CUBIC in Figure 16. We observe that PF obtains the best improvements in both cases, as well as Round Robin, which even sometimes beats PF when a low number of users are sharing the network. This result seems counter intuitive as RR does not optimize the LMS channel capacity usage, unlike PF, and is explained later.
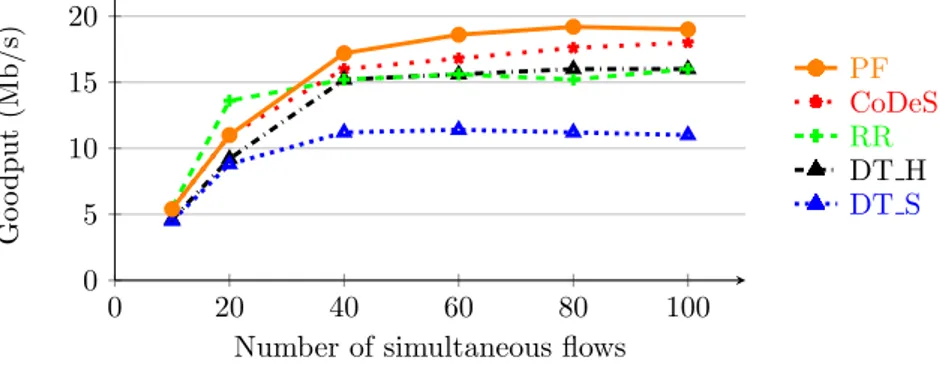
In Figure 17, showing the total goodput in the network, we can also see that PF obtains the best performance, with up to 20 Mb/s of useful bits.
We also observe in these Figures that CoDeS does not improve TCP performance. On the contrary, TCP goodput is worse with CoDeS than PF. This low performance has several reasons:
• TCP congestion control algorithm adapts its sending rate to the network capacity, and reacts to con-gestion following either a duplicate acknowledgement detection (DUPACK) or a TCP timeout (RTO).
0 100 200 300 400 500 0 100 200 300 400 500
Number of simultaneous flows
Jitter p er flo w (ms) PF CoDeS 200ms CoDeS 100ms CoDeS 50ms DT S
Figure 12: Jitter obtained with different policies
0 100 200 300 400 500 0 10 20 30 40 50 60
Number of simultaneous flows
Losses p er flo w (%) DT S CoDeS 50ms CoDeS 100ms CoDeS 200ms PF
Figure 13: Losses obtained with different policies
This behavior prevents TCP to uselessly overflow the buffers, reducing the number of packets dropped by the buffers compared to UDP, when a lot of users are transmitting. Thus, implementing a new queue management is useless or counterproductive;
• TCP is a reliable protocol, unlike UDP, and the transmission time is now less important than with VoIP traffic. Dropping a packet in the queue results in a loss detection by TCP, a retransmission and a congestion window decrease because TCP assumes there is congestion. It is more efficient now to delay the packets, at the price of more RTO, letting the transport layer adapt itself to the potential timeouts. Thus CoDeS is not suited for TCP transmissions, and PF obtains better results, while less complex. Finally, in Figure 18, we can see the results concerning the proportion of retransmissions by TCP, meaning the number of packets retransmitted divided by the total number of packets sent. We can observe that PF, RR and DT H have the lowest retransmission rate. CoDeS has a number of retransmission higher due to the queue drops by timeout, and DT S has the highest rate due to the lower buffer capacity.
We have seen in the results that RR obtains good goodput for a low number of users without optimizing the LMS channel capacity, as shown in Figure 19. The reason of this good performance is the spacing between each transmission in a same flow on the LMS channel, compared to PF which has a bursty distribution. This spacing mitigates the number of out-of-order packets received by TCP, and then the number of DUPACK and retransmissions.
We can analytically assess the impact of this spacing: considering the decoding probability depending on the number of retransmissions, we can compute the average number of bits sent per packet len:
len = 16890 bits (5)
We also know the bandwidth of the LMS channel (50 Mb/s), thus we can compute the average time needed to send a packet:
t = len
BW = 0.34 ms (6)
Finally, when n users are transmitting, each flow sends a packet every n ∗ t seconds. In case of additional time ∆t needed to decode a packet (mainly because of HARQ), TCP triggers a retransmission by DUPACK if:
DT S RR PF CoDeS 100 ms 0 1 2 3 4 Mean Opinion Score 150 200 250 300 350 400 450
Figure 14: Mean Opinion Score of scheduling policies as a function of the number of flows
0 20 40 60 80 100 0 10 20 30 40
Number of simultaneous flows
Go o dp ut gain (%) PF CoDeS RR
Figure 15: Goodput gain per user for different scheduling policies compared to DT H (NewReno)
We know ∆t is between 15 ms and 20 ms, we can then compute the number of users beyond which a DUPACK retransmission is triggered:
n ≤ ∆t
3t ≈ 19 users (8)
Thus, if we have more than 20 users transmitting, the spacing in the transmission mitigates the impact of DUPACK, improving TCP performance, and explaining the inflection point with RR around 20 users in Figure 16.
Moreover, even if a loss is detected by DUPACK, the number of packets to be retransmitted is lower with RR, leading to less capacity on the LMS channel used for spurious retransmissions. Figure 20, comparing the goodput achieved by RR with and without reordering, confirms that with more than 20 users, the goodput achieved by this scheduler without reordering equals the goodput with reordering. Thus, the impact of out-of-order packets is totally mitigated by RR beyond this number of users.
Finally, this low number of DUPACK and retransmissions with RR compensates the absence of LMS channel optimization, and RR shows performance similar to PF for a low number of users. These two schedulers can be considered as good candidates for TCP traffic, when no reordering mechanism is present conjointly with HARQ. However, with a high number of users (more than 60), PF obtains better results than RR: the channel optimization with PF becomes more significant on TCP performance than out-of-order packets mitigation with RR.
However, we saw that CoDeS does not improve TCP performance, and can be counterproductive: it does not add new mechanisms in addition to TCP congestion control, and packets drops are now very disadvantageous for TCP flows.
These results have been obtained without the reordering mechanism, and we can now assess the impact of these policies when the reordering mechanism is enabled.
6.3.2 Impact of scheduling on TCP with reordering
TCP goodput gain compared to DT H, for each scheduling policy and when the reordering mechanism is enabled, is presented in Figures 21 (TCP NewReno) and 22 (CUBIC). We can see that PF obtains the best goodput gain for the users, and that RR is not competitive anymore. Thus, the advantages brought by RR to deal with
0 20 40 60 80 100 0 10 20 30 40 50
Number of simultaneous flows
Go o dp ut gain (%) PF CoDeS RR
Figure 16: Goodput gain per user for different scheduling policies compared to DT H (CUBIC)
0 20 40 60 80 100 0 5 10 15 20
Number of simultaneous flows
Go o dp ut (Mb/s) PF CoDeS RR DT H DT S
Figure 17: Global goodput for different scheduling policies (CUBIC)
out-of-order packets are useless here, as the reordering mechanism mitigates the number of out-of-order packets, and only PF optimizes the LMS channel capacity.
We can observe in Figure 23 that PF is still achieving the best total goodput in the network compared to the other policies. DT S cannot obtain good performance because of its low buffer capacity, and DT H has results similar to RR due to the absence of channel optimization.
The proportion of retransmissions is presented in Figure 24, showing a similar proportion of retransmissions between RR and PF. However, whatever the scheduling policy, the proportion of retransmissions is higher compared to the previous section (Figure 18), when no reordering mechanism is enabled. This increase is mainly due to two main reasons:
• the reordering mechanism adds an additional delay to an already important transmission delays, increasing the number of TCP timeout and thus the number of retransmissions and spurious retransmissions, mainly for a low number of users, as shown in Figure 25 for the PF policy. This behavior can also be seen with RR;
• the main part of these retransmissions are due to congestion, corresponding to normal behavior of TCP. These are congestion losses, and TCP is designed to manage these kind of losses. This is useless to deal with the queues size, the buffer overflow would still occur and it is better to optimize the storage capacity, limited in a satellite environment.
As for the scenario without reordering, CoDeS does not show any improvement in TCP performance, and is not suited for best-effort traffic. PF remains the only scheduler optimizing the transmissions with and without reordering mechanism, due to its LMS channel optimization.
We can also note that once reaching the saturation point, the goodput per user is similar regardless of the TCP variant used or the activation of the reordering mechanism. Thus, once there are enough users to always have packets in the LMS channel queues, the congestion control algorithms do not significantly impact on the performance, because TCP performance is driven by the performance of the scheduling policy. However, when the saturation point is not reached, we can see a significant improvement with CUBIC compared to NewReno, and with the reordering mechanism, as seen in Figure 26.
6.3.3 Fairness between users
In the previous sections, we presented the mean results for all flows, but without giving any information on the fairness between these flows. A bad fairness would be prejudicial for the global performance and Quality of
0 20 40 60 80 100 0 0.1 0.2 0.3 0.4 0.5
Number of simultaneous flows
Prop ortion of pac k ets retransmitted (%) DT S CoDeS PF DT H RR
Figure 18: Proportion of packets retransmitted per flow (CUBIC)
0 20 40 60 80 100 0 0.2 0.4 0.6 0.8
Number of simultaneous flows
Prop ortion of pac k ets deco ded at the first HAR Q tran smission (%) DT S CoDeS PF RR
Figure 19: Proportion of packets decoded at the first HARQ transmission (CUBIC)
Service, as some users would have a very low goodput compared to the others, if not a lower goodput than it could have had with other scheduling policies.
In this section, we study the fairness between the users. We cannot use the Jain’s fairness index [21], because of the varying LMS channel capacity. We use instead the minimal and maximal goodput values, as well as the Standard Deviation to compare the fairness between users.
Users Min Max Mean SD
PF DT S RR PF DT S RR PF DT S RR PF DT S RR 10 0.44 0.43 0.46 0.58 0.51 0.61 0.54 0.45 0.55 0.035 0.014 0.033 20 0.45 0.41 0.56 0.60 0.47 0.72 0.55 0.44 0.68 0.028 0.012 0.027 40 0.38 0.24 0.37 0.45 0.32 0.41 0.42 0.28 0.38 0.016 0.016 0.004 60 0.27 0.15 0.25 0.35 0.21 0.27 0.31 0.19 0.26 0.017 0.014 0.003 80 0.21 0.10 0.19 0.27 0.17 0.21 0.24 0.14 0.19 0.015 0.014 0.004 100 0.16 0.07 0.15 0.23 0.14 0.17 0.19 0.11 0.16 0.017 0.012 0.004 Table 3: Statistics on the goodput between DT S, PF and RR without reordering
Table 3 shows these values for DT S and PF and RR when the reordering mechanism is disabled. We can observe that the Standard Deviation is the lowest with RR, which could be expected due to the policy that does not favor one flow compared to the others. However, PF shows a larger Standard Deviation, but the flow with the minimal goodput has almost always a better performance than the best flow with DT S or RR (the flow with the maximum goodput).
This means that even if there is less fairness between the flows with PF compared to RR or DT S, all the flows have a better performance with PF compared to the other policies. The difference between the best flow and the worst flow is between 10 % and 40 %, depending on the number of users sharing the LMS channel.
These results can be summarized in Figure 27, showing the CDF of the different policies, with 40 parallel users. We can observe the good performance of PF compared to the other policies, and also the good fairness of RR between its flows.
This conclusion still holds when the reordering mechanism is enabled, as shown in Table 4: even if the Standard Deviation is higher with PF, its performance with the worst flow is still higher than any flow from the other policies. These results are confirmed with the CDF presented in Figure 28.
0 20 40 60 80 100 0 0.2 0.4 0.6 0.8 1 1.2
Number of simultaneous flows
Go o dput (Mb/s) RR no reordering RR with reordering
Figure 20: Performance comparison of RR with and without reordering (CUBIC)
0 20 40 60 80 100 0 10 20 30 40 50 60
Number of simultaneous flows
Go o dput gain (%) PF RR CoDeS
Figure 21: Goodput gain per user for different scheduling policies compared to DT H (NewReno)
Users Min Max Mean SD
PF DT S RR PF DT S RR PF DT S RR PF DT S RR 10 0.85 0.60 0.77 1.62 0.84 1.45 1.35 0.73 1.20 0.143 0.056 0.162 20 0.75 0.25 0.61 1.01 0.53 0.78 0.91 0.46 0.74 0.054 0.041 0.032 40 0.41 0.18 0.36 0.54 0.28 0.40 0.47 0.24 0.38 0.026 0.020 0.004 60 0.27 0.07 0.25 0.35 0.20 0.27 0.31 0.15 0.26 0.020 0.020 0.005 80 0.20 0.12 0.19 0.28 0.16 0.21 0.24 0.11 0.19 0.018 0.020 0.004 100 0.16 0.03 0.15 0.22 0.12 0.17 0.19 0.08 0.16 0.013 0.015 0.004
Table 4: Statistics on the goodput between DT S, PF and RR with reordering
Finally, the last Table 5 provides a qualitative, rather subjective classification, of the whole results of this study to ease the positionning of each solution.
A note on FQ-CoDel When it comes to congestion-friendly transport protocols, other solutions mixing scheduling policies and queue management may be relevant and solutions such as FQ-CoDel [20] lays on the same principle than CoDeS. FQ-CoDel is an algorithm that combined a packet scheduler and the CoDel active queue management (AQM). The scheduler is similar to a Stochastic Fair Queuing scheme as in its default behaviour, FQ-CoDel stochastically classifies incoming packets into different queues by hashing IP fields in-formation perturbed with a random number selected at initiation time. At initialisation and by default, 1024 queues are created and each queue enables CoDel algorithm. The principle of CoDel is to drop packets de-pending on the sojourn time of each enqueued packet. CoDel switches between a ”dropping mode” and a ”non dropping mode” depending on the measured and maximum authorised sojourn times (set by default to 5 ms). Both FQ-CoDel and CoDeS have been designed with dedicated goals in mind: while FQ-CoDel focuses on prioritizing new flows without having too much impact on the old flows, CoDeS has been designed to optimize the usage of a scarce radio resource to allow more users in the system and provide a better QoE. At last, in the case of real-time traffic, we showed that the queue management presented in CoDeS has a negative impact on TCP performance. Thus, a PF scheduler performs greatly with this kind of traffic. Moreover, RR can show good results in some cases, by mitigating the impact of out-of-order packets on the transport layer.
7
Conclusion
Even if few satellite constellations survived the 90’s era, many recent satellite internet companies such as O3b, Onerweb or SpaceX offer a true alternative to terrestrial internet. These companies claim to be able to deliver
0 20 40 60 80 100 0 10 20 30 40 50
Number of simultaneous flows
Go o dput gain (%) PF RR CoDeS
Figure 22: Goodput gain per user for different scheduling policies compared to DT H (CUBIC)
0 20 40 60 80 100 0 5 10 15 20 25
Number of simultaneous flows
Go o dput (Mb/s) PF CoDeS RR DT H DT S
Figure 23: Global goodput for different scheduling policies (CUBIC)
high-speed internet access almost anywhere in the world. However this new satellite industry still focuses on designing quasi-error-free links for improving the usage of the scarce radio resource to the price of a potential increase of the jitter and delay. This objective induces constraints on the end-to-end protocols, however the increasing amount of constellation projects rarely come along with end-to-end evaluations and the need for the deployment of proxies in such situation.
The measurements presented in this study clearly highlight the impact of recovery mechanisms in terms of latency and goodput on two common internet services : VoIP and bulk data transfer. We also show that the joint use of queue management and scheduling policy may not guarantee performance improvements when the number of users drastically increase. That being said, an adequate selection of algorithms can result in higher QoE for the VoIP users and we propose two solutions, conjointly with a novel AQM scheme, to correctly schedule data transmission as a function of the channel capacity of the users. In the case of real-time traffic, we showed that the queue management presented in CoDeS has a negative impact on TCP performance while, a PF scheduler performs greatly with this kind of traffic. This illustrates that there is no one-fit-all mechanism and both protocols (UDP and TCP) must remain classified in different service classes as this is today the case on satellite gateway and more generally over the internet. Finally, the several performance measurements presented illustrate that the latency for VoIP users and the goodput for bulk data transfer users can be both improved with CoDeS and PF. In the sake of reproductibility of theses experiments, the authors made available the source code of the schemes presented.
Acknowledgment
The authors would like to thank CNES and Thales Alenia Space for funding support.
Criteria DT S DT H RR PF CoDeS
VoIP (QoE) 77 77 77 X XX
TCP (Goodput) 77 7 7 XX X
Fairness between users 7 77 XX X X
Overall efficiency 77 7 7 XX XX
0 20 40 60 80 100 0 1 2 3 4 5
Number of simultaneous flows
Prop ortion of pac k ets retransmitted (%) RR PF CoDeS DT S
Figure 24: Proportion of packets retransmitted per flow (CUBIC)
0 20 40 60 80 100 0 1 2 3 4 5 ·10−3
Number of simultaneous flows
Prop ortion of pac k ets retransmitted (%) No reordering Reordering
Figure 25: Proportion of packets retransmitted by RTO events per flow (CUBIC, PF)
References
[1] ITU T-REC-G.1020, Performance parameter definitions for quality of speech and other voiceband applica-tions utilizing IP networks.
[2] ITU T-REC-G.114 Series G: Transmission systems and media, digital systems and networks, International telephone connections and circuits, General Recommendations on the transmission quality for an entire international telephone connection, one-way transmission time, May 2003.
[3] Rami Ali Ahmad, J´erˆome Lacan, Fabrice Arnal, Mathieu Gineste, and Laurence Clarac. Enhanced HARQ for Delay Tolerant Services in Mobile Satellite Communications. The Seventh International Conference on Advances in Satellite and Space Communications 2015, pages 1–6, April 2015.
[4] Guido Appenzeller, Isaac Keslassy, and Nick McKeown. Sizing Router Buffers. SIGCOMM Comput. Commun. Rev., 34(4), August 2004.
[5] G. Ash and D. McDysan. Generic Connection Admission Control (GCAC) Algorithm Specification for IP/MPLS Networks. RFC 6601 (Experimental), April 2012.
[6] K. C. Beh, A. Doufexi, and S. Armour. Performance Evaluation of Hybrid ARQ Schemes of 3GPP LTE OFDMA System. 2007 IEEE 18th International Symposium on Personal, Indoor and Mobile Radio Com-munications, pages 1–5, Sep 2007.
[7] N. Blaunstein, Y. Cohen, and M. Hayakawa. Prediction of fading phenomena in land-satellite communica-tion links. Radio Science, 45(6), 2010.
[8] E. Chaput, M. Verloop, A. L. Beylot, and C. Baudoin. Utility function based packet scheduling over DVB-S2. 2013 IEEE International Conference on Communications (ICC), pages 4288–4292, June 2013. [9] Y. Chotikapong, H. Cruickshank, and Zhili Sun. Evaluation of TCP and Internet traffic via low Earth
orbit satellites. Institute of Electrical and Electronics Engineers Personal Communications, 8(3):28–34, Jun 2001.
[10] Chun Loo. A statistical model for a land mobile satellite link. IEEE Transactions on Vehicular Technology, 34(3):122–127, Aug 1985.
0 20 40 60 80 100 0 0.4 0.8 1.2 1.6
Number of simultaneous flows
Go o dput (Mb/s) CUBIC + reordering NewReno + reordering CUBIC + no reordering NewReno + no reordering
Figure 26: Impact of transport protocol and reordering on TCP performance, using PF
0 0.1 0.2 0.3 0.4 0.5 0.6 0.7 0.8 0.9 1 0.15 0.2 0.25 0.3 0.35 0.4 0.45 0.5 0.55 0.6 0.65 CDF Goodput (Mb/s) DT S DT H PF RR
Figure 27: CDF of goodput obtained by the users, with different scheduling policies (no reordering, 40 users)
[11] A. M. Cipriano, P. Gagneur, G. Vivier, and S. Sezginer. Overview of arq and harq in beyond 3g systems. In 2010 IEEE 21st International Symposium on Personal, Indoor and Mobile Radio Communications Work-shops, pages 424–429, Sep. 2010.
[12] Tomaso De Cola, Harald Ernst, and Mario Marchese. Application of Long Erasure Codes and ARQ Schemes for Achieving High Data Transfer Performance Over Long Delay Networks, pages 643–656. Springer US, Boston, MA, 2008.
[13] J. Du, C. Jiang, Y. Qian, Z. Han, and Y. Ren. Resource allocation with video traffic prediction in cloud-based space systems. IEEE Transactions on Multimedia, 18(5):820–830, May 2016.
[14] J. Du, C. Jiang, J. Wang, Y. Ren, S. Yu, and Z. Han. Resource allocation in space multiaccess systems. IEEE Transactions on Aerospace and Electronic Systems, 53(2):598–618, April 2017.
[15] J. B. Dup´e, E. Chaput, C. Baudoin, C. B`es, A. Deramecourt, and A. L. Beylot. Optimized GSE packet scheduling over DVB-S2. 2014 IEEE Global Communications Conference, pages 2856–2861, Dec 2014. [16] J. B. Dup´e, E. Chaput, C. Baudoin, C. B`es, A. Deramecourt, and A. L. Beylot. Rule-based packet
scheduling for DVB-S2 through generic stream encapsulation. 2014 IEEE International Conference on Communications (ICC), pages 3576–3581, June 2014.
[17] Gorry Fairhurst, Giovanni Giambene, Samuele Giannetti, Cristina Parraga Niebla, and Aduwati Sali. Cross-layer study for resource management in DVB-S2 with mobile users. 2009 International Workshop on Satellite and Space Communications, pages 257–261, 2009.
[18] F. P. Fontan, M. Vazquez-Castro, C. E. Cabado, J. P. Garcia, and E. Kubista. Statistical modeling of the LMS channel. Institute of Electrical and Electronics Engineers Transactions on Vehicular Technology, 50(6):1549–1567, Nov 2001.
0 0.1 0.2 0.3 0.4 0.5 0.6 0.7 0.8 0.9 1 0.15 0.2 0.25 0.3 0.35 0.4 0.45 0.5 0.55 0.6 0.65 CDF Goodput (Mb/s) DT S DT H PF RR
Figure 28: CDF of goodput obtained by the users, with different scheduling policies (reordering, 40 users)
[19] F. P. Fontan, M. Vazquez-Castro, C. E. Cabado, J. P. Garcia, and E. Kubista. Statistical modeling of the lms channel. IEEE Transactions on Vehicular Technology, 50(6):1549–1567, Nov 2001.
[20] T. Hoeiland-Joergensen, P. McKenney, D. Taht, J. Gettys, and E. Dumazet. The Flow Queue CoDel Packet Scheduler and Active Queue Management Algorithm. RFC 8290 (Experimental), January 2018.
[21] Rajendra K Jain, Dah-Ming W Chiu, and William R Hawe. A Quantitative Measure Of Fairness And Discrimination For Resource Allocation In Shared Computer Systems. CoRR, cs.NI/9809099, 1984. [22] F P Kelly, A K Maulloo, and D K H Tan. Rate control for communication networks: shadow prices,
proportional fairness and stability. Journal of the Operational Research Society, 49(3):237–252, Mar 1998. [23] S. R. Khosravirad, G. Berardinelli, K. I. Pedersen, and F. Frederiksen. Enhanced HARQ Design for 5G Wide Area Technology. 2016 IEEE 83rd Vehicular Technology Conference (VTC Spring), pages 1–5, May 2016.
[24] Nicolas Kuhn, Emmanuel Lochin, J´erˆome Lacan, Roksana Boreli, and Laurence Clarac. On the impact of link layer retransmission schemes on TCP over 4G satellite links. International Journal of Satellite Communications and Networking, 33(1):pp. 19–42, 2015.
[25] F. Perez-Fontan, M. A. Vazquez-Castro, S. Buonomo, J. P. Poiares-Baptista, and B. Arbesser-Rastburg. S-band LMS propagation channel behaviour for different environments, degrees of shadowing and elevation angles. Institute of Electrical and Electronics Engineers Transactions on Broadcasting, 44(1):40–76, Mar 1998.
[26] F. Perez-Fontan, M. A. Vazquez-Castro, S. Buonomo, J. P. Poiares-Baptista, and B. Arbesser-Rastburg. S-band lms propagation channel behaviour for different environments, degrees of shadowing and elevation angles. IEEE Transactions on Broadcasting, 44(1):40–76, March 1998.
[27] M. G. Sarret, D. Catania, F. Frederiksen, A. F. Cattoni, G. Berardinelli, and P. Mogensen. Improving link robustness in 5G ultra-dense small cells by hybrid ARQ. 2014 11th International Symposium on Wireless Communications Systems (ISWCS), pages 491–495, Aug 2014.
[28] G. Sarwar, E. Lochin, and R. Boreli. Mitigating the impact of packet reordering to maximize performance of multimedia applications. In 2011 IEEE International Conference on Communications (ICC), pages 1–5, June 2011.
[29] A. Sastry. Performance of Hybrid Error Control Schemes of Satellite Channels. Institute of Electrical and Electronics Engineers Transactions on Communications, 23(7):689–694, Jul 1975.
[30] Sanjay Shakkottai and Alexander L. Stolyar. Scheduling algorithms for a mixture of real-time and non-real-time data in HDR. In Jorge Moreira de Souza, Nelson L.S. da Fonseca, and Edmundo A. de Souza e Silva, editors, Teletraffic Engineering in the Internet Era, volume 4 of Teletraffic Science and Engineering, pages 793 – 804. Elsevier, 2001.
[31] Sanjay Shakkottai and Alexander L Stolyar. Scheduling for multiple flows sharing a time-varying channel: The exponential rule. Translations of the American Mathematical Society-Series 2, 207:185–202, 2002. [32] Ryutaro Suzuki and Yasuhiko Yasuda. Study on ISL network structure in LEO satellite communication
systems. Acta Astronautica, 61(7):648 – 658, 2007.
[33] Bastien Tauran, Emmanuel Lochin, J´erˆome Lacan, Fabrice Arnal, Mathieu Gineste, Laurence Clarac, and Nicolas Kuhn. Making H-ARQ suitable for a mobile TCP receiver over LEO satellite constellations. 9th EAI International Conference on Wireless and Satellite Systems (formerly PSATS), Oxford, GB, 2017. [34] Lloyd Wood. SaVi: satellite constellation visualization. First Annual Centre for Communication Systems