Any correspondence concerning this service should be sent
to the repository administrator:
[email protected]
This is an author’s version published in:
http://oatao.univ-toulouse.fr/27301
To cite this version: Geffroy, Olivier and Morère, Marie and
Lopez, Ricardo and Pasquier, Grégory and Condoret,
Jean-Stéphane Investigating the Aroma of Syrah Wines from the
Northern Rhone Valley Using Supercritical CO2-Dearomatized
Wine as a Matrix for Reconstitution Studies. (2020) Journal of
Agricultural and Food Chemistry, 68 (41). 11512-11523. ISSN
0021-8561
Official URL
DOI :
https://doi.org/10.1021/acs.jafc.0c04328
Open Archive Toulouse Archive Ouverte
OATAO is an open access repository that collects the work of Toulouse
researchers and makes it freely available over the web where possible
Investigating the Aroma of Syrah Wines from the Northern Rhone
Valley Using Supercritical CO
2
‑Dearomatized Wine as a Matrix for
Reconstitution Studies
Olivier Geffroy,
*
Marie Morère, Ricardo Lopez, Grégory Pasquier, and Jean-Stéphane Condoret
ABSTRACT:
This study aimed to investigate the key compounds involved in the aroma of French Syrah wines from the northern
Rhone valley from two vintages characterized by distinct climatic conditions. The volatile composition of the wines was assessed
through the determination of 76 molecules. After identifying the best matrix and best model for aroma reconstitution studies,
omission tests were conducted using the Pivot profile method. For both vintages, 35 molecules with odor activity values (OAVs)
above 0.5 were identified. While remarkably high levels of 2-furfurylthiol (FFT) were reported in both wines, rotundone and
3-sulfanylhexanol (3SH) enabled the strongest discrimination between the two wines. Wine dearomatized using supercritical carbon
dioxide (sCO
2) was identified as the best matrix. The best models built using this matrix were composed of molecules with OAV > 5
and OAV > 10 highlighting that this dearomatization approach can be valuable to reconstitute the aroma of wine using a small
number of molecules. For the cool vintage wine, the omission of rotundone and FFT had the greatest impact on the olfactive profile
for nonanosmic and anosmic respondents to rotundone, respectively. 3SH, whose omission decreased the rating of the “fruity”
attribute, was identified as the main contributor to the aroma of Syrah wine produced in the warm vintage.
KEYWORDS:
Syrah, wine, aroma reconstitution, omission tests, supercritical CO
2, Pivot profile
■
INTRODUCTION
With 190,000 ha under vines mainly in France (64,000 ha) and
Australia (40,000 ha), Vitis vinifera L. Syrah was the eighth
most planted cultivar in the world in 2015.
1Several hypotheses
on its origin have been proposed, including those that place it
in Iran, in the ancient viticultural area of “Shiraz/Chiraz”, or in
Sicily in Syracuse.
2However, Syrah is more likely to originate
from the French Alps area as genetic research studies have
shown that it was obtained from a spontaneous cross between
Mondeuse blanche and Dureza, two almost extinct grape
varieties from this area.
2Syrah remains a historic variety in the
Rhone Valley in France where it is usually blended with
Grenache and Mourvèdre in the southern vineyards. Red wines
from the northern part of the valley such as those made within
the protected designations of origin (PDOs) Côte-Rotie,
Saint-Joseph, Crozes-Hermitage, Hermitage, and Cornas are made
from pure Syrah.
Despite the importance of Syrah for these PDOs, little
research has been undertaken to investigate the volatiles
involved in the aroma of these wines. To the best of our
knowledge, there is only one such study, conducted by a
Japanese research group,
3which showed that wines from
Côte-Rotie, Saint-Joseph, and Crozes-Hermitage could contain
substantial levels (above 100 ng/L) of rotundone, a
sesquiterpene responsible for black pepper aroma.
4Apart
from rotundone, research studies undertaken in other
vineyards indicate that Syrah red wines contain negligible
concentrations of methoxypyrazines
5and that hydrolyzed
glycosidic precursors together with dimethyl sulfide are
responsible for the fruity, black olive and earthy, and
tobacco/cigar note characteristics of this cultivar.
6When
vinified in rosé, Syrah wines can also exhibit significant levels of
3-sulfanylhexanol (3SH) imparting grapefruit and tropical
aromas.
7The most complete and consistent work
charac-terized the key aroma compounds, through reconstitution
studies and omission tests, of ultrapremium Australian Syrah
wines sourced in the Barossa Valley and in the Margaret River
wine regions.
8Using a synthetic wine made by mixing 44
aroma compounds in concentrations measured in Syrah wines,
this study showed that compounds such as β-damascenone,
linalool, and fatty acids had a small impact on aroma. It also
highlighted that the greatest impact was observed when
omitting nonvolatile compounds such as organic acids, sugars,
minerals, and glycerol, which emphasizes the importance of the
matrix when conducting such aroma reconstitution studies.
Most of the research studies using this latter approach,
popularized by Ferreira et al.
9and inspired by Grosch and
Schieberle,
10have been carried out using hydroalcoholic
solutions with a relatively simple composition.
8,9However,
because of the large impact of the nonvolatile fraction on the
aroma perception,
8,11,12the use of a native wine that has
increase the quality of the aroma reconstitution. This
dearomatization could be achieved through rotary evaporation
followed by a resin treatment, as proposed by Lytra et al.,
13or
using supercritical carbon dioxide (sCO
2), a promising
physical extraction technique that has proved its efficiency
for the recovery of aroma from wine.
14sCO
2
is a fluid state of
carbon dioxide where it is held at or above its critical
temperature and critical pressure, which can adopt properties
midway between a gas and a liquid.
The aim of the present work was to study the key volatiles
involved in the aroma of Syrah wines from the Northern
Rhone valley from two vintages with distinct climatic
conditions using sCO
2dearomatized wine as a matrix for
reconstitution studies.
■
MATERIALS AND METHODS
Wine.Two commercial unwooded Syrah wines from the Crozes-Hermitage PDO were selected for the study in February 2018. These wines, produced by the same winery and from the same vineyard blocks located in the south part of the PDO, were from two vintages with distinct climatic conditions (cool for 2013 and warm for 2015). To characterize accurately these two vintages from a climatic point of view, daily rainfall and air temperature (minima, maxima, and mean values) from 1994 to 2017 were provided by Météo France (Toulouse, France) for the Mercurol weather station. This station is located less than 10 km from the sites where the grapes were sourced. The data were used to calculate the Huglin index15 and the
cumulative rainfall between 1 April and 30 September and between 1 January and 31 December. An informal olfactory evaluation (orthonasal and retronasal) organized with a small group of tasters confirmed that the two wines had distinct sensory features (spicy/ peppery for 2013 and fruity for 2015) and were representative of the diversity of vintage styles found within the PDO. To avoid any modification in the composition or sensory profile over the different phases of the study that ended in May 2019, the wines were stored at 4 °C. All the classical analyses performed on the wines from the identification of the best matrix experiment, either before or after the dearomatization processes, were carried out using a Winescan FT-120 (Foss France SAS, Nanterre, France). These analyses included the alcohol content (% v/v), titratable acidity (g/L tartaric acid), pH, tartaric acid (g/L), malic acid (g/L), lactic acid (g/L), volatile acidity (g/L acetic acid), and modified color intensity (MCI) calculated as the sum of absorbance at 420, 520, and 620 nm, total phenolic index (TPI), and carbon dioxide (mg/L). All determinations were carried out once, but the Winescan produced duplicate spectra and provided mean values for each parameter.
Chemicals.All chemicals used for the reconstitution studies were of analytical reagent grade (purity >95%). Dilutions, when needed, were prepared in dipropylene glycol (Sigma-Aldrich, Saint-Quentin-Fallavier, France). Rotundone was supplied by Firmenich (Geneva, Switzerland), and cis-oak-lactone together with 2,3-butanedione by Diffusions Aromatiques (Saint-Cézaire-sur-Siagne, France). Because of the difficulties of handling gaseous molecules, hydrogen sulfide (H2S) and methanethiol were used in the nanoencapsulated form
from mother solutions prepared just before use (Cara Technology Limited, Surrey, United Kingdom). 3SH and 3-sulfanylhexyl acetate were supplied by Cluzeau Info Labo (Sainte-foy-La-Grande, France). The rest of the molecules were supplied by Sigma-Aldrich (Saint-Quentin-Fallavier, France). These include ethyl hexanoate, ethyl lactate, ethyl isobutyrate, ethyl 2-methylbutyrate, ethyl isovalerate, ethyl acetate, isoamyl acetate, acetic acid, butyric acid, isobutyric acid, isovaleric acid, hexanoic acid, octanoic acid, isobutanol, isoamyl alcohol, cis-3-hexenol, methionol, 2-phenylethanol, acetaldehyde, β-damascenone, β-ionone, dimethyl sulfide, 2-furfurylthiol (FFT), benzyl mercaptan (BM), guaiacol, eugenol, ethylphenol (EP), 4-vinylguaiacol (4-VG), trans-isoeugenol, and γ-butyrolactone.
Quantitative Analysis of Aroma Compounds. Seventy-six molecules belonging to several chemical families were analyzed in the
wine using all the analytical methods routinely implemented in our laboratory, apart from 3-isobutyl-methoxypyrazine (IBMP) and 2-isopropyl-3-methoxypyrazine (IPMP), which were not analyzed. Indeed, previous research showed that IBMP and IPMP did not contribute to the aroma of Syrah wines with odor activity value (OAV) < 0.5, including those from cool climate wine regions,5,8some
weather conditions well known to be favorable to obtaining substantial levels of methoxypyrazines.
The quantitative analysis of major compounds was carried out using a validated published method.16 In accordance with this
method, 3 mL of wine containing the internal standards (IS) (2-butanol, 4-methyl-2-pentanol, 4-hydroxy-4-methyl-2-pentanone, ethyl heptanoate, heptanoic acid, and 2-octanol) and 7 mL of water were salted with 4.5 g of ammonium sulfate and extracted with 0.2 mL of dichloromethane. The extract was then analyzed by gas chromatog-raphy (GC) with flame ionization detection. The area of each analyte was normalized by that of its corresponding IS and then interpolated in the corresponding calibration plot. The plots were built by applying exactly the same analytical method as that applied to synthetic wines containing known amounts of the analytes, covering the natural range of occurrence of these compounds. Typical R2varied between 0.9938
and 0.9998.
The analysis of minor compounds was carried out using the method proposed by López et al.17In accordance with this method, 50 mL of wine, containing 25 μL of the BHA solution and 75 μL of a surrogate standard solution (3-octanone, β-damascone, heptanoic acid, and isopropyl propanoate), were passed through a LiChrolut EN (Merck, Darmstadt, Germany) 200 mg cartridge at a rate of about 2 mL/min. The sorbent was dried under nitrogen stream (purity 99.999%). Analytes were recovered by elution with 1.3 mL of dichloromethane. A volume of 25 μL of an IS solution (4-hydroxy-4-methyl-2-pentanone, 3,4-dimethylphenol and 2-octanol, both at 300 mg per g of dichloromethane) were added to the eluted sample. The extract was then analyzed by GC with ion trap mass spectrometry (MS) detection under the conditions described in the reference. This method has a satisfactory linearity with R2 higher than 0.99 in all
cases.
The analysis of highly volatile sulfur compounds was carried out using the method proposed by Ontañón et al.18based on automated
headspace solid-phase microextraction and GC-pulsed flame photo-metric detection. A volume of 4.9 mL of saturated NaCl brine was placed in a 20 mL standard headspace vial and sealed. After this, the vial was purged with a nitrogen stream of 2 bar for 1 min. Immediately after this operation, 100 μL of the wine sample, 5 μL of the ethanedial solution, and 20 μL of the IS solution (isopropyl disulfide, 1-propanethiol, 2-1-propanethiol, cyclopentanethiol, 1-hexanethiol, and [2H
6]dimethyl sulfide at 200 μg/L) were injected through the septum
with a syringe. Samples were incubated for 5 min at 35 °C and then extracted for 20 min at the same temperature. The extraction was performed with agitation at 250 rpm in cycles of 8 s on and 2 s off. Desorption took place in the injection port at 300 °C for 7 min, and analysis was carried out under the conditions listed in the reference. In all cases, the linearity of the method was satisfactory with R2
ranging from 0.9823 (H2S) to 0.9980 (methanethiol).
The analysis of polyfunctional mercaptans was carried out using the method proposed by Mateo-Vivaracho, et al.19 First, 0.2 g of ethylenediaminetetracetic acid and 0.6 g ofL-cysteine chlorohydrate
were added to 25 mL of wine. This sample mixture was then transferred to a 20 mL volumetric flask where it was spiked with 15 μL of an ethanolic solution containing 1400 μg/L of [2H
2
]-2-furfurylthiol, [2H
5]-benzyl mercaptan, and [2H5]-3-mercaptohexyl
acetate as IS. The complete volume was then transferred into a 24 mL screw-capped vial together with 0.2 g of O-methylhydroxylamine, shaken for 15 s, purged with pure nitrogen (99.999%), sealed, and incubated in a water bath at 55 °C for 45 min. Six milliliters of this incubated sample was then loaded into a 50 mg Bond Elut-ENV solid-phase extraction (SPE) cartridge (Varian, Walnut Creek, USA). Major wine volatiles were removed by rinsing with 4 mL of a 40% methanol−water solution (0.2 M) in phosphate buffer at pH 7.7. A second IS was also loaded into the cartridge by passing it through 220
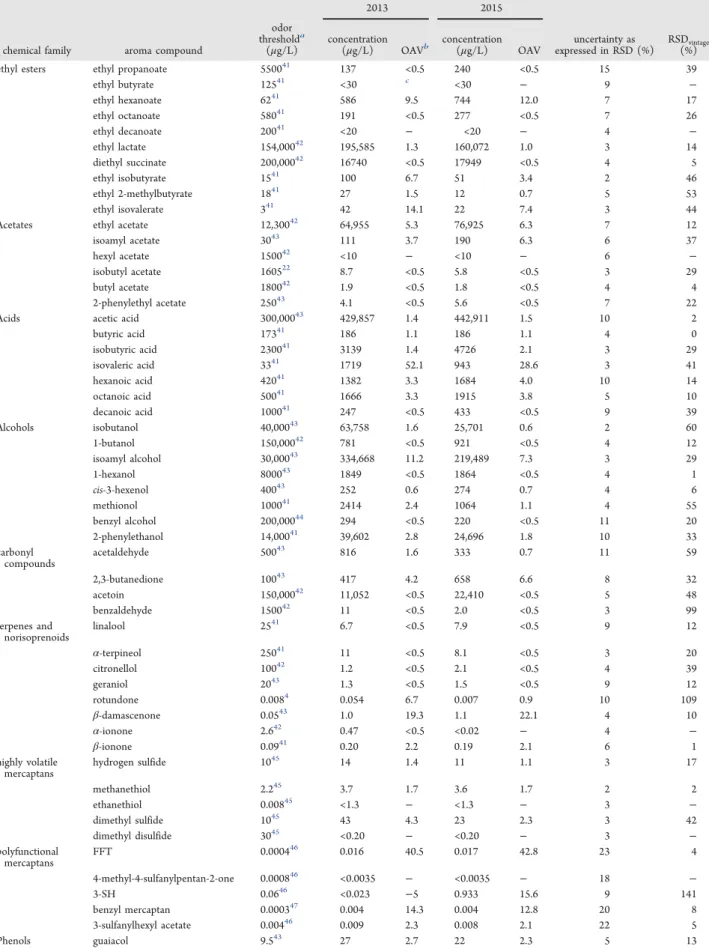
Table 1. Odor Threshold, Concentration, OAV, Accumulated Uncertainty of the Method As Expressed in RSD, %, and
Inter-Vintage RSD
vintage, % of Aroma Compounds, Grouped by Chemical Family, for the Two Crozes-Hermitage Syrah Wines
2013 2015
chemical family aroma compound
odor thresholda
(μg/L) concentration(μg/L) OAVb concentration
(μg/L) OAV expressed in RSD (%)uncertainty as RSD(%)vintage
ethyl esters ethyl propanoate 550041 137 <0.5 240 <0.5 15 39
ethyl butyrate 12541 <30 c <30 − 9 − ethyl hexanoate 6241 586 9.5 744 12.0 7 17 ethyl octanoate 58041 191 <0.5 277 <0.5 7 26 ethyl decanoate 20041 <20 − <20 − 4 − ethyl lactate 154,00042 195,585 1.3 160,072 1.0 3 14 diethyl succinate 200,00042 16740 <0.5 17949 <0.5 4 5 ethyl isobutyrate 1541 100 6.7 51 3.4 2 46 ethyl 2-methylbutyrate 1841 27 1.5 12 0.7 5 53 ethyl isovalerate 341 42 14.1 22 7.4 3 44
Acetates ethyl acetate 12,30042 64,955 5.3 76,925 6.3 7 12
isoamyl acetate 3043 111 3.7 190 6.3 6 37 hexyl acetate 150042 <10 − <10 − 6 − isobutyl acetate 160522 8.7 <0.5 5.8 <0.5 3 29 butyl acetate 180042 1.9 <0.5 1.8 <0.5 4 4 2-phenylethyl acetate 25043 4.1 <0.5 5.6 <0.5 7 22
Acids acetic acid 300,00043 429,857 1.4 442,911 1.5 10 2
butyric acid 17341 186 1.1 186 1.1 4 0 isobutyric acid 230041 3139 1.4 4726 2.1 3 29 isovaleric acid 3341 1719 52.1 943 28.6 3 41 hexanoic acid 42041 1382 3.3 1684 4.0 10 14 octanoic acid 50041 1666 3.3 1915 3.8 5 10 decanoic acid 100041 247 <0.5 433 <0.5 9 39 Alcohols isobutanol 40,00043 63,758 1.6 25,701 0.6 2 60 1-butanol 150,00042 781 <0.5 921 <0.5 4 12 isoamyl alcohol 30,00043 334,668 11.2 219,489 7.3 3 29 1-hexanol 800043 1849 <0.5 1864 <0.5 4 1 cis-3-hexenol 40043 252 0.6 274 0.7 4 6 methionol 100041 2414 2.4 1064 1.1 4 55 benzyl alcohol 200,00044 294 <0.5 220 <0.5 11 20 2-phenylethanol 14,00041 39,602 2.8 24,696 1.8 10 33 carbonyl compounds acetaldehyde 500 43 816 1.6 333 0.7 11 59 2,3-butanedione 10043 417 4.2 658 6.6 8 32 acetoin 150,00042 11,052 <0.5 22,410 <0.5 5 48 benzaldehyde 150042 11 <0.5 2.0 <0.5 3 99 terpenes and norisoprenoids linalool 25 41 6.7 <0.5 7.9 <0.5 9 12 α-terpineol 25041 11 <0.5 8.1 <0.5 3 20 citronellol 10042 1.2 <0.5 2.1 <0.5 4 39 geraniol 2043 1.3 <0.5 1.5 <0.5 9 12 rotundone 0.0084 0.054 6.7 0.007 0.9 10 109 β-damascenone 0.0543 1.0 19.3 1.1 22.1 4 10 α-ionone 2.642 0.47 <0.5 <0.02 − 4 − β-ionone 0.0941 0.20 2.2 0.19 2.1 6 1 highly volatile
mercaptans hydrogen sulfide 10
45 14 1.4 11 1.1 3 17 methanethiol 2.245 3.7 1.7 3.6 1.7 2 2 ethanethiol 0.00845 <1.3 − <1.3 − 3 − dimethyl sulfide 1045 43 4.3 23 2.3 3 42 dimethyl disulfide 3045 <0.20 − <0.20 − 3 − polyfunctional mercaptans FFT 0.0004 46 0.016 40.5 0.017 42.8 23 4 4-methyl-4-sulfanylpentan-2-one 0.000846 <0.0035 − <0.0035 − 18 − 3-SH 0.0646 <0.023 −5 0.933 15.6 9 141 benzyl mercaptan 0.000347 0.004 14.3 0.004 12.8 20 8 3-sulfanylhexyl acetate 0.00446 0.009 2.3 0.008 2.1 22 5 Phenols guaiacol 9.543 27 2.7 22 2.3 5 13
μL of solution (20 μL of 4-methoxy-α-toluenethiol, 150 μg/L in ethanol, and 200 μL water). Mercaptans retained in the cartridge were directly derivatized by passing 1 mL of an aqueous solution of DBU (6.7%) and 50 μL of a 2000 mg/L solution of PFBBr in hexane and letting the cartridge imbibe with the reagent for 20 min at room temperature (25 °C). The cartridge was then rinsed with 4 mL of a 40% methanol/water solution 0.2 M in H3PO4 and with1 mL of
water. Derivatized analytes were finally eluted with 600 μL of a solvent mixture (hexane 25% in diethyl ether), and then 10 μL of the chromatographic IS solution (octafluoronaphthalene 22.5 μg/L in hexane) was added to the extract. The eluate was finally washed with five 1 mL volumes of brine (200 g/L NaCl water solution), transferred to a 2 mL vial, and spiked with a small amount of anhydrous sodium sulfate. Four microliters of this sample was directly injected in cold splitless mode into the GC-negative chemical ionization MS system, which was operated as described in the published method. Linearity of the method (0.978 < R2< 0.999) was
satisfactory.
Rotundone was quantitated in wine using the method developed by Culleré et al.20A volume of 30 μL of the IS solution (benzyl benzoate ≈100 mg L−1in ethanol) was added to 50 mL of wine, and then this volume was loaded into a 200 mg bond ELUT PPL cartridge. The cartridges were previously conditioned with 4 mL of dichloro-methane, 4 mL of methanol, and 4 mL of a hydroalcoholic solution containing 12% (v/v) ethanol. After loading the wine, the bed was washed with 5 mL of water, 20 mL of an aqueous solution containing methanol [70% (v/v)], and 1% NaHCO3. After the cartridges were
dried, the elution was carried out with 2 mL of hexane containing 25% (v/v) of ethyl ether. Then, this extract was concentrated to 200 μL by a nitrogen stream. The area of the peak corresponding to the m/z fragment chosen for the rotundone was normalized to that of the IS. These relative areas were interpolated in the calibration curve, prepared by the SPE−GC−MS analysis of synthetic wine samples containing known amounts of rotundone and the IS. The method-ology used for the analysis of synthetic wine samples was the same as
the proposed method for the real wine samples. This method showed satisfactory linearity (R2= 0.9974) in red wine.
All determinations were carried out once, except for highly volatile sulfur compounds, which were determined in duplicate and for which mean values were considered. Such duplicates enable to detect occasional errors in the analysis that can occur because of the high volatility of these compounds. The response factors for the aroma compounds quantitated in the two Crozes-Hermitage wines are shown inTable S1.
Accumulated uncertainty of the analytical methods, expressed as relative standard deviation (RSD), is shown in Table 1 for each quantitated aroma compound. For each aroma compound, the RSD between the two vintages (RSDvintage) was calculated and the OAV
was determined by dividing the concentration of the compound by its odor threshold in water or in the hydroalcoholic solution. When the concentration of an analyte was below its limit of quantitation, its OAV was not determined.
Identification of the Best Matrix. A first experiment was carried out to identify the best matrix for aroma reconstitution. Two synthetic wines with two levels of alcohol content (SW 10% and SW 12.5%) were prepared by mixing tartaric acid (2 g/L), lactic acid (1.5 g/L), glycerol (8 g/L), and absolute ethanol to get a final concentration of 10% and 12.5% v/v. The pH was adjusted to 3.50 with 1 M NaOH. These reduced concentrations of ethanol were used as preliminary studies showed that the synthetic wines with the ethanol content of the original wines were smelling alcohol despite the use of glycerol to limit the volatility of ethanol. For producing dearomatized red wine through supercritical carbon dioxide (sCO2), an extraction pilot
SFE200 from Separex (Champigneulles, France) was used. This comprises a 200 mL stainless steel extractor, which was loaded with 130 mL of native red wine (Crozes-Hermitage PDO). The system was operated at a constant temperature of 40 °C and a pressure of 100 bar, optimal conditions to remove the aroma.14Pure CO2was passed
into the cell for 30 min with the flow rate kept constant at 20 g/min. Several runs were carried out under the same conditions to obtain enough dearomatized red wine for each vintage. Dearomatized wines
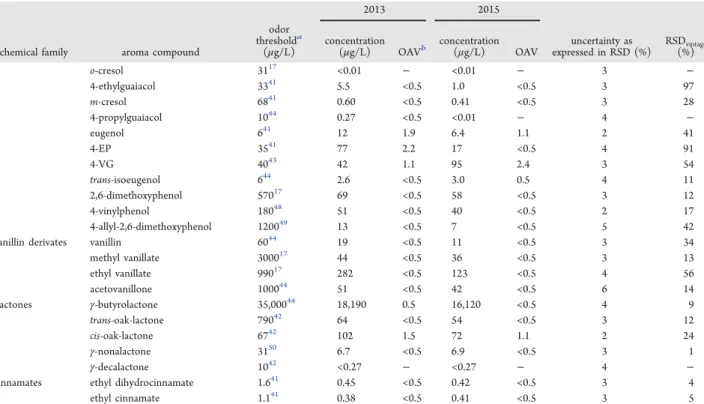
Table 1. continued
2013 2015
chemical family aroma compound
odor thresholda
(μg/L) concentration(μg/L) OAVb concentration(μg/L) OAV expressed in RSD (%)uncertainty as RSD(%)vintage
o-cresol 3117 <0.01 − <0.01 − 3 − 4-ethylguaiacol 3341 5.5 <0.5 1.0 <0.5 3 97 m-cresol 6841 0.60 <0.5 0.41 <0.5 3 28 4-propylguaiacol 1044 0.27 <0.5 <0.01 − 4 − eugenol 641 12 1.9 6.4 1.1 2 41 4-EP 3541 77 2.2 17 <0.5 4 91 4-VG 4043 42 1.1 95 2.4 3 54 trans-isoeugenol 644 2.6 <0.5 3.0 0.5 4 11 2,6-dimethoxyphenol 57017 69 <0.5 58 <0.5 3 12 4-vinylphenol 18048 51 <0.5 40 <0.5 2 17 4-allyl-2,6-dimethoxyphenol 120049 13 <0.5 7 <0.5 5 42
vanillin derivates vanillin 6044 19 <0.5 11 <0.5 3 34
methyl vanillate 300017 44 <0.5 36 <0.5 3 13 ethyl vanillate 99017 282 <0.5 123 <0.5 4 56 acetovanillone 100044 51 <0.5 42 <0.5 6 14 Lactones γ-butyrolactone 35,00044 18,190 0.5 16,120 <0.5 4 9 trans-oak-lactone 79042 64 <0.5 54 <0.5 3 12 cis-oak-lactone 6742 102 1.5 72 1.1 2 24 γ-nonalactone 3150 6.7 <0.5 6.9 <0.5 3 1 γ-decalactone 1042 <0.27 − <0.27 − 4 −
cinnamates ethyl dihydrocinnamate 1.641 0.45 <0.5 0.42 <0.5 3 4
ethyl cinnamate 1.141 0.38 <0.5 0.41 <0.5 3 5
aOdor threshold; reference given. All odor thresholds were determined in hydroalcoholic solutions or synthetic wines except for refs4 41, and45,
obtained from these runs were blended and used in the classical analysis and reconstitution studies. Containers hosting the dearom-atized wine were maintained opened for enough time to allow the elimination of the excess of carbon dioxide. After such treatment, the wine was completely odorless with no aroma perceived at tasting. For each vintage, dearomatized red wine was also prepared using a method adapted from Lytra et al.13 Native red wines (Crozes-Hermitage PDO) were treated using a Rotavapor EL 131 (Büchi, Rungis, France) with a 20 °C bath temperature to obtain two-thirds of their original volume. Then, the liquid was supplemented with 5 g/L LiChrolut resin (40−120 μm) and was stirred for 12 h. The solution was centrifuged (11, 200 rpm for 20 min), and classical analyses were performed. The dearomatized wine obtained after such treatment (Rotavapor) was not completely odorless and had a very low aroma intensity a tasting.
For each vintage, reconstitution studies were conducted by mixing aroma compounds, whose OAV was strictly above 0.5, in concentrations measured in Syrah wines. Indeed, a previously published wine reconstitution study demonstrated that such models showed the highest qualitative similarity with the aroma of the native wine.9
As in other reconstitution studies,8,9,11 differences were expected
between the native wines and the reconstituted wines. Therefore, to assess the quality of the reconstitutions, the degree of difference (DOD) test21 whose procedure can be summarized as follows was preferred over triangular tests. The panel was composed of 15 panelists (8 males and 7 females, ages 22−53) who had prior experience in wine tasting. They were asked to proceed only with an olfactory assessment. For each vintage, their task was to rate the DOD between pairs of samples on a discontinuous scale ranging from “0” (similar) to “10” (extremely different). Pairs of samples consisted of the native wine (identified as the reference) and the four reconstituted wines (SW 10%, SW 12.5%, sCO2, and Rotavapor) coded with
three-digit codes. The native wine served blind was also compared to itself to get a baseline DOD score. A constant volume of 15 mL of each sample was poured into black wine-tasting glasses at 18 °C. Pairs were presented according to a balanced design (Williams Latin square). The panelists received a new pair of samples every 5 min. The questionnaire also contained ample space for free comments. The panelists had first to assess the DOD for the five pairs of samples from the 2013 series and after a 5 min rest those from the 2015 series. Sensory analysis was organized at 22 °C, under daylight lighting, in an air-conditioned professional tasting room.
Optimization of the Model.To optimize the model, a second experiment was conducted on the matrix that received the lowest DOD score during the identification of the best matrix experiment. For each vintage, several models were built by mixing aroma compounds whose OAVs were strictly above 0.5 (OAV > 0.5), above 1 (OAV > 1), above 2 (OAV > 2), above 5 (OAV > 5), and above 10 (OAV > 10), in concentrations measured in Syrah wines. For each vintage, the reference sample was the native wine, which was also compared to itself served blind. Sensory evaluation was conducted under the same conditions as during the previous experiment. The panelists had first to assess the DOD for the 6 pairs of samples from the 2013 series and after a 5 min rest those from the 2015 series.
Omission Tests.Omission experiments were carried out using the best matrix and the best model identified in the two previous experiments. For each vintage, aroma compounds to be omitted were selected on the basis of belonging to the best model and having a grape-derived origin. Nineteen panelists (11 females, 8 males, ages 28−55) who had extensive experience in wine tasting were recruited from a local winemakers’ association and a technical institute. Samples were assessed using Pivot Profile,22 a relatively new descriptive method based on free description, which can be summarized here briefly. The panelists were provided with pairs of samples consisting of a single reference product called the pivot and the sample product following a balanced design (Williams Latin square). They were then asked to freely describe the differences between the two samples. For each vintage, the pivot was built as an average sample of all the test products (fully optimized reconstitution, optimized reconstitutions
with omission of some aroma compounds). The panelists were only asked to smell the samples and to write down each attribute that the samples had in smaller or larger amounts than the pivot (e.g., less green, more animal). They were instructed to use only descriptive words without providing any sentences and were not allowed to use the negative form (e.g., closed for nonexpressive). For each pair of samples, the pivot was regenerated. A constant volume of 15 mL of each sample was poured into black wine-tasting glasses at 18 °C, and the panelists received a new pair of samples every 5 min. The panelists had first to evaluate the pairs of samples from the 2013 series and after a 5 min rest those from the 2015 series. As specific anosmia has been previously reported for rotundone,6a triangular test was performed at the end of the session to detect anosmic panelists. One of the three coded samples contained either a 200 ng/L rotundone solution or water alone. The position and the nature of the different samples within each test were randomized. Those who were not able to identify the different sample after the olfactory assessment were considered as anosmic respondents. Omission experiments were organized at 22 °C, under daylight lighting, in an air-conditioned professional tasting room.
Statistical Treatments.For the identification of the best matrix and the best model optimization experiments, statistical analyses were conducted with XLSTAT software (Addinsoft, Paris, France). DOD scores were subjected to a three-way analysis of variance (ANOVA) treatment (vintage × treatment × panelist) with first-order interactions. Fisher’s least significant difference test was used as a post-hoc comparison of means at P < 0.05. For the omission experiments, data were treated with Tastel software version 2019 (ABT Informatique, Rouvroy sur Marne, France). For each series of data, terms were regrouped by categories and only the categories which were mentioned at least five times for each series were maintained. Then, negative and positive frequencies were calculated for each category and each sample. The negative frequency was subtracted from the positive one, and the resulting scores were translated to obtain positive scores. The final matrix was treated through correspondence analysis (CA) to obtain sensory maps of the samples. For the 2013 spicy vintage, data were treated separately for anosmic and nonanosmic respondents to rotundone.
■
RESULTS AND DISCUSSION
Aroma Compound Composition.
Among the 76 volatile
compounds analyzed, 35 molecules were found with an OAV >
0.5 in the 2013 and 2015 Syrah wines (
Table 1
). For both
vintages, the three compounds with the greatest OAV were
isovaleric acid (52.1 in 2013 and 28.6 in 2015), FFT (40.5 in
2013 and 42.8 in 2015), and β-damascenone (19.3 in 2013 and
22.1 in 2015). The contribution of isovaleric acid, a fatty acid
produced by yeasts imparting a cheesy character to the aroma
of red wines, has been previously emphasized notably in
Syrah.
8In the same way, β-damascenone, a C
13
-norisoprenoid
formed by oxidative cleavage of neoxanthin, has been widely
detected in wines and appears to be almost ubiquitous.
23FFT has been previously identified as one of the main aroma
compounds involved in the aging bouquet of Bordeaux
wooded red wines with FFT concentrations, up to 150 ng/L,
increasing with the aging time in the bottle.
24However, to the
best of our knowledge, this is the first time that such levels of
FFT have been reported in relatively young unwooded red
wines. Indeed, FFT is mainly formed in wine by the reaction of
H
2S with furfural released from the barrels.
25However, furfural
can also be produced by Maillard reactions, which naturally
occur in red wine.
26Syrah is considered as a “reductive”
cultivar, and we can assume that the expected large amount of
H
2S formed by the yeast during fermentation might have
promoted the formation of FFT. Together with other
furan-derived compounds previously identified in Syrah wines,
8FFT,
which has a strong roast coffee aroma, could contribute to the
burnt rubber notes characteristic of some wines made from this
cultivar.
Despite the large difference between the olfactive profiles of
the two wines, their aroma compound composition did not
greatly differ. As reflected by their intervintage coefficients of
variation, the compounds that accounted for the strongest
discrimination between the two vintages were 3SH (141%),
rotundone (109%), 4-EP (91%), isobutanol (60%),
acetalde-hyde (59%), methionol (55%), 4-VG (54%), and ethyl
2-methylbutyrate (53%).
For most of these compounds, the observed intervintage
differences might be directly (for grape-derived aroma
compounds) or indirectly (for fermentation-derived aroma
compounds) related to variations in the climate conditions.
27The data shown in
Figure 1
enable a comparison of the two
studied vintages from a climatic standpoint. As reflected by the
Huglin index, 2013 and 2015 were, respectively, the coolest
and warmest vintages among the five vintages available on the
market at the launch of the study. While 2013 was the fifth
coolest vintage since 1994 and the coolest since 2008, 2015
was the third warmest vintage since 1994 and the warmest
since 1999. If cumulative rainfall between 1 April and 30
September did not enable the two vintages to be discriminated,
2013 can be seen to have been rainier when considering the
period between 1 January and 31 December. However, it
should be mentioned that 199 mm of rainfall was recorded in
2015 between 12 September and 17 September. As 2015 was
an early-ripening vintage with the harvest generally occurring
before mid-September in the Crozes-Hermitage area, the
climatic conditions during the vine vegetative growth and the
fruit-ripening period are likely to have been dryer for this
vintage than those reflected by the cumulative rainfall between
1 April and 30 September. In the context of climate change, it
is worth mentioning that cool vintages such as 2013 are likely
to become less and less frequent, and the olfactive profile of
Crozes-Hermitage wines will probably look more like that of
2015 in the future. This trend toward warmer vintages can be
clearly observed in the historical data shown in
Figure 1
.
The greater rotundone concentration in wine from the 2013
vintage is consistent with previous research work highlighting
that wines made from vintages with cool and wet climatic
conditions usually exhibit high levels of rotundone.
28The
warmer conditions observed in 2015 might have contributed to
enhance nitrogen assimilation through a greater mineralization
of organic matter in the soil. For this vintage characterized by a
remarkably high level of 3SH, the likely larger nitrogen content
in the berries could have positively affected the concentration
of varietal thiol precursors.
29Furthermore, it might have
limited the production of fermentation-derived higher alcohols
such as isobutanol and methionol whose formation is
promoted under low yeast assimilable nitrogen conditions.
30If rotundone is known to be very stable in bottled wine,
31the 2-year extended period of storage might also explain the
lower concentration of 3SH found in the 2013 wine. Indeed,
thiols are chemically unstable because they are easily oxidizable
in disulfide under mild oxidative conditions.
38Similarly, the higher levels for the 2013 wine of acetaldehyde
formed by oxidation of ethanol and ethyl 2-methylbutyrate,
whose esterification is enhanced during wine aging to reach the
acid−ester equilibrium,
32might be the consequence of this
extra period of storage.
As neither wines were aged in oak barrels, 4-EP and 4-VG
are likely to have originated from the metabolism of
hydroxycinnamic acids (HAs), suggesting a Brettanomyces
activity. 4-Vinylphenol and 4-VG are first produced by
Brettanomyces through enzymatic decarboxylation from HA,
before yielding 4-EP and 4-ethylguaiacol through reduction of
the vinyl group.
33As concentrations in 4-VG and 4-EP are,
respectively, higher and lower in 2015, we can assume that the
Brettanomyces contamination and the related reaction leading
to the production of 4-EP from 4-VG were controlled in an
earlier stage during this vintage.
Without performing an aroma extract dilution analysis
(AEDA), a quantitative GC olfactometry procedure, we cannot
completely exclude the possibility that some key aroma
contributors were not quantitated. However, a negligible
impact would be expected on the results as among the 48 key
molecules identified in a AEDA work aiming at investigating
the compounds involved in the aroma of two Syrah wines,
8only nine were not analyzed in our study. It also worth
mentioning that among these nine aroma compounds,
2-methylbutyric acid and ethyl 2-methylpropanoate were the
only potential key odorants showing an OAV > 1 in this former
study. As the Syrah wines from this past study were both aged
in oak barrels, the aroma compound composition of the two
unwooded Crozes-Hermitage wines is likely to be simpler,
which must also have limited the possibility of missing a key
compound.
However, the AEDA procedure also has some limitations
and does not always allow the identification of the main
odorants because of the coelution of the compounds, notably
those present at a trace level, which can result in the perception
of odor cluster. For this reason, additional compounds not
detected in the AEDA are also frequently analyzed and
included in models for reconstitution studies.
8,9This limitation
can be illustrated by FFT and BM, two molecules detected in
the ng/L range showing an OAV > 10 in the
Crozes-Hermitage wines. Indeed, these two compounds were not
identified as potential key contributors to the aroma of Syrah
wines in a previous study based on AEDA.
8It is also worth
mentioning that some key compounds identified by AEDA,
including those with AEDA values of 1000, can be found in
wines at very low concentrations and have no sensory
contribution.
8Identification of the Best Matrix and Best Model. The
impact of the dearomatization processes on the classical
Figure 1. Huglin index, cumulative rainfall between 1 April and 30 September, and between 1 January and 31 December from 1994 to 2017 for the Mercurol weather station.
laboratory analysis is shown in
Table 2
. By removing one-third
of the sample volume mainly composed of volatile
components, the Rotavapor treatment had a great impact on
the alcohol content, volatile acidity, and dissolved carbon
dioxide. In most cases, it also tended to increase the content in
nonvolatile molecules through concentration. Before carrying
out the reconstitution studies, absolute ethanol was added to
increase the ethanol content of 8% v/v to reproduce the
concentration in the native wine. In comparison, the sCO
2treatment had a weak impact on most of the measured
parameters apart from dissolved CO
2, which was slightly
increased. Depending on the settings, sCO
2has been
previously applied to wine either to remove volatiles,
34alcohol,
35,36or for both applications.
14The impact of such a
treatment on the raffinate has already been characterized for
ethanol and aroma but never for other basic parameters.
For these initial reconstitution studies, 35 molecules were
included in the model for both wines. The matrix, designed as
a “treatment” factor, had a significant impact on the DOD
score (
Table 3
). For both vintages, the lowest score was
observed for the sCO
2treatment (
Figure 2
). In comparison
with SW 10% and SW 12.5%, the superiority of sCO
2could be
related to the greater complexity of the matrix and notably its
composition in nonvolatile fractions, which was very similar to
the native wine.
8,12The difference with Rotavapor could be
explained by the absence of odor perceived at tasting for the
sCO
2sample with the former treatment being slightly marked
by oxidative notes. Despite the relative neutrality of absolute
ethanol, the addition of a large amount of exogenous ethanol
for Rotavapor might also have played a role by enhancing the
overall alcohol perception.
Following these results, the sCO
2matrix was selected for the
rest of the study. It can be seen that the DOD score remained
high in comparison with the native wine served blind (
Figure
2
). In the space available for free comments on the tasting
sheet, several panelists highlighted that the test samples
exhibited intense reductive notes. To improve the quality of
the reconstitution, H
2S and methanethiol, which might have
been responsible for these notes, were excluded from the
model optimization experiment.
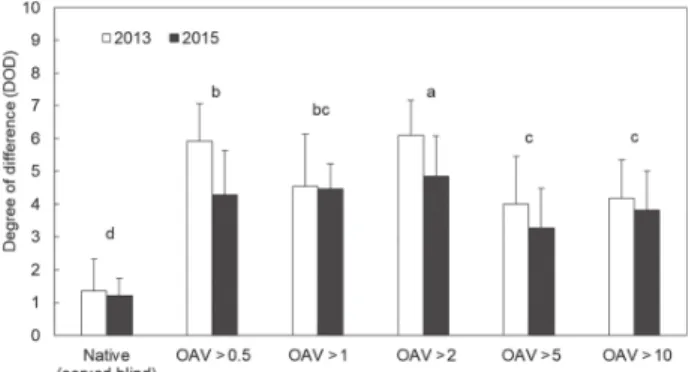
This exclusion had a positive effect on the quality of the
model built by mixing aroma compounds with OAV > 0.5 as
the average DOD score was decreased by 0.6 ± 1.5 and 1.0 ±
2.5 for the 2013 and 2015 vintages, respectively (
Figure 3
).
The number of molecules included in the models was 33 for
OAV > 0.5 in both vintages, 31 in 2013 and 27 in 2015 for
OAV > 1.0, 21 in 2013 and 20 in 2015 for OAV > 2.0, 10 in
2013 and 11 in 2015 for OAV > 5, and 6 for OAV > 10 in both
vintages. This number had a significant impact on the quality
of the reconstitution (
Table 3
). For both vintages, the best
reconstitution was observed for the OAV > 5 and OAV > 10
models (
Figure 3
). These findings are consistent with the
recent work highlighting that multiple esters can be substituted
by simpler reconstitutions using very few compounds.
37However, they contradict other research emphasizing that
the most qualitative reconstitutions using synthetic wines were
obtained using complex models.
9The aroma of simple models
containing only molecules with a high OAV were often very
different from that of the wine.
9Even though wine
dearomatized through sCO
2was odorless, we can assume
that this matrix contained reduced amounts of aroma
compounds in comparison to the original wine. Indeed,
previous results obtained using similar operating conditions
Table
2.
Impact
of
the
Dearomatization
Treatments
on
the
Classical
Laboratory
Analysis
vintage treatment alcohol content (% v/v) titratable acidity (g/L tartaric acid) pH tartaric acid (g/L) malic acid (g/L) lactic acid (g/L) volatile acidity (g/L acetic acid) glucose + fructose (g/L) MCI c TPI d CO 2 (mg/L) 2013 native wine 12.9 ± 0.1 4.6 ± 0.1 3.78 ± 0.05 1.4 ± 0.3 0.0 ± 0.3 1.6 ± 0.3 0.42 ± 0.05 0.9 ± 0.5 11.5 ± 0.2 65 ± 5 363 ± 45 sCO 2 a 12.7 ± 0.1 4.7 ± 0.1 3.77 ± 0.05 1.4 ± 0.3 0.0 ± 0.3 1.6 ± 0.3 0.48 ± 0.05 0.9 ± 0.5 11.3 ± 0.2 65 ± 5 429 ± 45 rotavapor b 4.1 ± 0.1 6.9 ± 0.1 3.75 ± 0.05 1.2 ± 0.3 0.0 ± 0.3 1.3 ± 0.3 0.09 ± 0.05 1.2 ± 0.5 12.2 ± 0.2 87 ± 5 <60 2015 native wine 13.5 ± 0.1 5.3 ± 0.1 3.74 ± 0.05 1.2 ± 0.3 0.0 ± 0.3 1.3 ± 0.3 0.45 ± 0.05 1.1 ± 0.5 15.0 ± 0.2 81 ± 5 419 ± 45 sCO 2 12.9 ± 0.1 5.4 ± 0.1 3.73 ± 0.05 1.2 ± 0.3 0.0 ± 0.3 1.3 ± 0.3 0.36 ± 0.05 1.0 ± 0.5 16.8 ± 0.2 86 ± 5 468 ± 45 rotavapor 4.3 ± 0.1 7.8 ± 0.1 3.75 ± 0.05 1.0 ± 0.3 0.0 ± 0.3 0.9 ± 0.3 0.01 ± 0.05 1.4 ± 0.5 23.5 ± 0.2 99 ± 5 <60 a Wine dearomatized through supercritical carbon dioxide. b Wine dearomatized through rotary evaporation followed by a resin treatment. c Modi fied color intensity. d Total Phenolic Index. The uncertainty of measurement is expressed as 95% con fidence interval.highlighted that peaks were either reduced or suppressed in the
chromatogram, in most cases.
14For example, in this former
study, 2-furfural, acetic acid, and 2,3-butanediol were not
removed after the sCO
2treatment and could be found in the
raffinate. Under our conditions, the presence of acetic acid,
which is the main contributor to volatile acidity, can be clearly
observed after dearomatization as the volatile acidity was not
decreased for the sCO
2treatment (
Table 2
). Therefore,
reconstitutions might have enhanced the overall contribution
of some molecules included in the models. For the more
complex models composed of compounds with low OAVs, this
effect might have been greater than for the simpler model. The
fact that the efficiency of sCO
2for removing aroma
compounds might be selective and dependent notably on the
volatility of the molecule could also be of importance.
14As
with H
2S and methanethiol, we cannot discard the possibility
that some specific aroma compounds included in the OAV >
0.5, OAV > 1, and OAV > 2 models were overexpressed and
contributed to decrease the quality of the reconstitution. The
fact that the OAV > 2 model had the highest DOD score
suggests that complex interactions occurred.
As no differences were observed between the OAV > 5 and
OAV > 10 models for both vintages, we can suppose that the
molecules from the first model, which were not included in the
second one (rotundone, ethyl acetate, ethyl isobutyrate, and
ethyl hexanoate for 2013; ethyl isovalerate, ethyl acetate,
isoamyl acetate, isoamyl alcohol, and 2,3-butanedione for
2015), made a small contribution to the aroma of Syrah wines.
However, for the 2013 vintage, the presence of rotundone for
which specific anosmia has been documented could have
brought some noise into the data.
4As the panel was not tested
for anosmia in this phase of the study, it remains difficult to
draw firm conclusions for this aroma compound. In order to
have a sufficient choice of grape-derived molecules for the last
phase of the study, the OAV > 5 model was retained.
Omission Tests.
Because of the low availability of native
wine, a bulk Syrah wine from the 2018 vintage produced in a
neighboring wine region was chosen to replace the
Crozes-Hermitage wine. This wine had the following features: alcohol
14.1% v/v, titratable acidity 4.1 g/L expressed as tartaric acid,
pH 4.02, tartaric acid 2.2 g/L, malic acid 0.0 g/L, lactic acid 1.1
g/L, volatile acidity 0.40 g/L expressed as acetic acid, glucose +
fructose 1.1 g/L, MCI 17.8, TPI 89, and dissolved CO
2655
mg/L. Semi-industrial SCO
2equipment from Separex
(Champigneulles, France) with a 25 L capacity was used to
treat the large volumes necessary for omission studies. It was
loaded with 13 L of bulk Syrah wine and operated under the
same conditions as previously reported (40 °C and 100 bar).
Because of the change of scale, the CO
2fl
ow was increased to
500 g/min and the treatment maintained for 120 min. In the
meantime, the SFE200 equipment was used to produce some
2013 and 2015 dearomatized Crozes-Hermitage wine using the
procedure previously described. For each vintage, models built
by mixing aroma compounds with OAV > 5 in the
Crozes-Hermitage and bulk Syrah wines dearomatized through sCO
2using the pilot scale and semi-industrial equipment,
respectively, were compared using triangular tests. For both
vintages, no significant differences were observed between the
two reconstitution models at P < 0.05 (six out of 15 correct
responses for 2013 and seven out of 15 correct responses for
2015). Therefore, the remaining amount of dearomatized bulk
Syrah wine was used to perform omission tests.
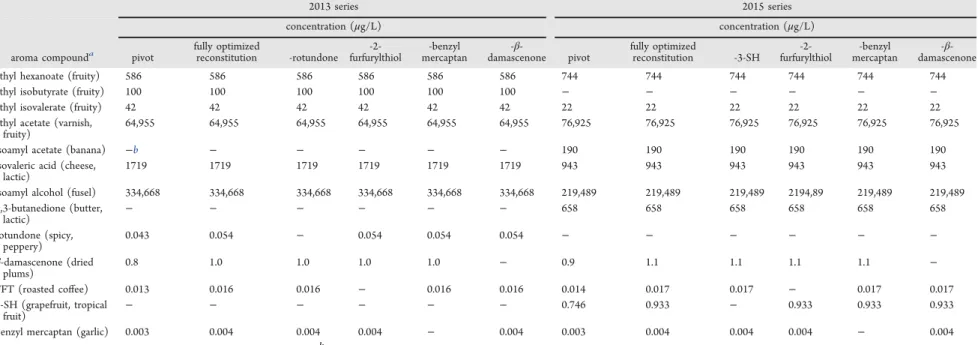
The grape-derived aroma compounds chosen for the
omission studies were rotundone for 2013, 3SH for 2015,
and FFT, BM, and β-damascenone for both vintages. The
aroma composition of the samples presented to the panelists
during the omission tests is shown in
Table 4
. Of the 19
panelists, eight rotundone anosmic respondents representing
42% of the whole panel were identified. This was a greater
percentage of specific anosmia than expected
6,38enabling a
Table 3. Results of Three-Way Analysis of Variance of DOD Data for the Identification of the Best Matrix and Optimization of
the Model Experiments
experiment vintage (V) treatment (T) panelist (P) V × T V × P T × P identification of the best matrix 0.110 <0.0001 <0.0001 0.145 0.014 0.051 optimization of the model 0.046 <0.0001 <0.0001 0.457 0.429 0.114
Figure 2.Mean scores of the DOD between the native wine, and the native wine served blind and the wines reconstituted using several matrices for the 2013 and 2015 vintages. Abbreviations: SW 10% and SW 12%, synthetic wines with ethanol concentrations of 10 and 12% v/v, respectively; sCO2, wine dearomatized through supercritical
carbon dioxide; Rotavapor, wine dearomatized through rotary evaporation followed by a resin treatment. Different letters indicate means significantly different at P < 0.05 by the Fisher test. Error bars represent 95% confidence interval.
Figure 3.Mean scores of the DOD between the native wine, and the native wine served blind, and the wines reconstituted by mixing aroma compounds with OAV strictly above 0.5 (OAV > 0.5), above 1 (OAV > 1), above 2 (OAV > 2), above 5 (OAV > 5), and above 10 (OAV > 10) for the 2013 and 2015 vintages. Different letters indicate means significantly different at P < 0.05 by the Fisher test. Error bars represent 95% confidence interval.
Table 4. Aroma Composition of the Samples Presented to Panelists during Omission Tests
2013 series 2015 series concentration (μg/L) concentration (μg/L) aroma compounda
pivot fully optimizedreconstitution -rotundone furfurylthiol-2- mercaptan-benzyl damascenone-β- pivot fully optimizedreconstitution -3-SH furfurylthiol-2- mercaptan-benzyl damascenone -β-ethyl hexanoate (fruity) 586 586 586 586 586 586 744 744 744 744 744 744 ethyl isobutyrate (fruity) 100 100 100 100 100 100 − − − − − − ethyl isovalerate (fruity) 42 42 42 42 42 42 22 22 22 22 22 22 ethyl acetate (varnish,
fruity) 64,955 64,955 64,955 64,955 64,955 64,955 76,925 76,925 76,925 76,925 76,925 76,925 isoamyl acetate (banana) −b − − − − − 190 190 190 190 190 190 isovaleric acid (cheese,
lactic) 1719 1719 1719 1719 1719 1719 943 943 943 943 943 943 isoamyl alcohol (fusel) 334,668 334,668 334,668 334,668 334,668 334,668 219,489 219,489 219,489 2194,89 219,489 219,489 2,3-butanedione (butter, lactic) − − − − − − 658 658 658 658 658 658 rotundone (spicy, peppery) 0.043 0.054 − 0.054 0.054 0.054 − − − − − − β-damascenone (dried plums) 0.8 1.0 1.0 1.0 1.0 − 0.9 1.1 1.1 1.1 1.1 − FFT (roasted coffee) 0.013 0.016 0.016 − 0.016 0.016 0.014 0.017 0.017 − 0.017 0.017 3-SH (grapefruit, tropical fruit) − − − − − − 0.746 0.933 − 0.933 0.933 0.933 benzyl mercaptan (garlic) 0.003 0.004 0.004 0.004 − 0.004 0.003 0.004 0.004 0.004 − 0.004
aAroma compounds; sensory attributes are given in parentheses.bNot included in the model.
relatively balanced distribution of anosmic and nonanosmic
respondents to rotundone.
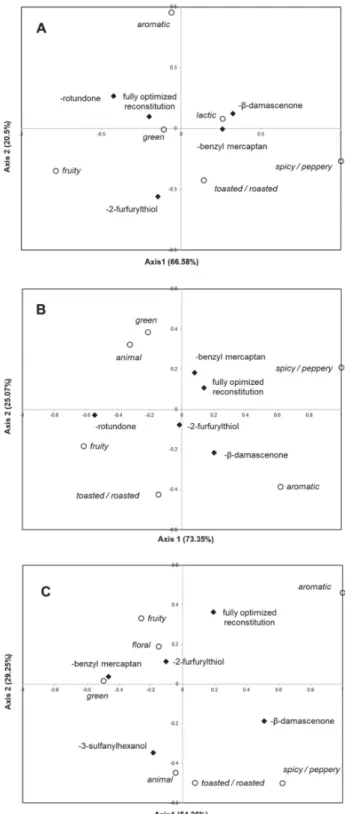
In the case of the 2013 series (
Figure 4
A), for the
respondents anosmic to rotundone, the fully optimized
reconstitution and the sample in which rotundone was omitted
were very close on the CA maps. This indicates that the
omission of rotundone did not provoke any changes in the
aroma perception for this population. Although this conclusion
was not unexpected, it has also been suggested that rotundone
could induce molecular mechanisms of flavor reduction for
anosmic respondents.
38However, as this mechanism is
concentration-dependent,
39we cannot completely discard the
possibility that the relatively small amount of rotundone spiked
in the fully optimized reconstitution sample (54 ng/L) was not
sufficient to suppress the olfactory signal transduction. These
two samples were perceived to be higher in the “green”
attribute and surprisingly lower in the “spicy/peppery” aroma,
which is difficult to explain. The compound whose omission
induced the greatest effect on the olfactive profile, as reflected
by its distance from the fully optimized reconstitution on the
CA map, was FFT. Although its omission had no effect on the
“toasted/roasted” character, it decreased the overall “aromatic”
intensity. The omission of BM and β-damascenone increased
the rating for the “lactic” attribute, which suggests that these
two compounds might interact with isovaleric acid through a
masking effect. The omission of β-damascenone also decreased
the “fruity” character, which is relevant in view of previous
research studies highlighting the enhancing effect of this
molecule on the fruity character of red wine.
40For the nonanosmic respondents testing the 2013 series, the
omission of rotundone had the greatest impact on the aroma,
while the contribution of BM and FFT was weak (
Figure 4
B).
The sample in which rotundone was omitted was logically
perceived as less “spicy/peppery” and more “fruity”. The
reconstitution without β-damascenone was rated higher for
“aromatic” and lower in the “green” and “animal” attributes.
For the 2015 series, most of the omissions had a large
impact on the olfactive profile. However, the sample in which
FFT was removed showed the most similarity with the fully
optimized reconstitution, which was perceived as “aromatic”.
The omission of FFT increased the rating of “fruity” and
“floral” and decreased the perception of the “toasted/roasted”
attribute characteristic of this aroma compound. The greatest
impact was observed when 3SH was omitted. Its omission
decreased the “fruity” and “floral” characters and increased the
“animal” and “toasted/roasted” attributes, which suggest that
3SH can interact with FFT. The reconstitution model without
β
-damascenone was perceived as less “fruity” and “floral”, in
accordance with previous studies.
40The omission of BM
increased the rating for the “green” attribute.
This study investigated the key compounds involved in the
aroma of Syrah wines from the northern Rhone valley. For the
fi
rst time, FFT was found at remarkably high concentration
levels in relatively young wines, which were not aged in barrels.
Rotundone and 3SH were the two grape-derived aroma
compounds that enabled the best discrimination between the
two studied vintages. For the nonanosmic respondents,
rotundone appeared to be the most impacting compound in
wine from the cool 2013 vintage. For anosmic respondents, the
removal of FFT had the greatest impact, while the omission of
rotundone did not induce any changes in the aroma
perception. 3SH was identified as the key contributor to the
“fruity” aroma for the warm 2015 vintage. Furthermore, this
study has found that wine dearomatized through supercritical
CO
2could be valuable for aroma reconstitution studies. Using
this matrix, the best models were observed when mixing a
Figure 4.Projection of the samples presented during omission tests in the CA map (subspace 1−2) (A) for anosmic panelists to rotundone for the 2013 series, (B) for nonanosmic panelists to rotundone for the 2013 series, and (C) for the whole panel for the 2015 series. Abbreviations: fully optimized without rotundone (-rotundone), β-damascenone (-β-β-damascenone), benzyl mercaptan (-benzyl mercap-tan); 2-furfurylthiol (-2-furfurylthiol), and 3-SH (-3-sulfanylhexanol).
small number of molecules with OAV > 5 or OAV > 10. The
Pivot Profile also proved to be a very convenient and
easy-to-use sensory method for omission tests.
■
ASSOCIATED CONTENT
*
sı Supporting InformationThe Supporting Information is available free of charge at
https://pubs.acs.org/doi/10.1021/acs.jafc.0c04328
.
Response factors for the aroma compounds quantitated
in the two Crozes-Hermitage wines (
)
■
AUTHOR INFORMATION
Corresponding Author
Olivier Geffroy − Physiologie, Pathologie et Génétique Végétales
(PPGV), Université de Toulouse, INP-PURPAN, 31076
Toulouse Cedex 3, France;
orcid.org/0000-0002-8655-5669
; Email:
olivier.geff[email protected]
Authors
Marie More
̀re − CRITT Génie des Procédés et des Technologies
Environnementales (GPTE), 311030 Toulouse Cedex 4, France
Ricardo Lopez − Laboratory for Flavor Analysis and Enology,
Instituto Agroalimentario de Aragón (IA2), Department of
Analytical Chemistry, Faculty of Sciences, Universidad de
Zaragoza, E50009 Zaragoza, Spain
Gre
́gory Pasquier − Université de Toulouse, INP-PURPAN,
31076 Toulouse Cedex 3, France
Jean-Ste
́phane Condoret − Laboratoire de Génie Chimique,
UMR CNRS 5503, INP-ENSIACET, 31030 Toulouse Cedex
4, France
Complete contact information is available at:
https://pubs.acs.org/10.1021/acs.jafc.0c04328
FundingThis work was funded by Toulouse INP, INSA, and
ISAE-Supaero through the Toulouse Tech Interlabs (TTIL)
program.
Notes
The authors declare no competing financial interest.
■
ACKNOWLEDGMENTS
We are grateful to Xavier Frouin, Cave de Tain, for supplying
the wines, Renaud Charles, Vinovalie, for performing the
classical laboratory analyses, Alec Maunoury, LGC, for
operating the supercritical carbon dioxide equipment, Olivier
Yobrégat, IFV, for providing some historical facts about Syrah,
Corenthin Quemener, Enolfactive, for providing the H
2S and
methanethiol capsules, and Harold Clenet, Ecole d’Ingénieurs
de PURPAN, for support in collecting the weather data. We
also thank all the panelists from the Ecole d’Ingénieurs de
PURPAN, IFV Sud-Ouest, and Assoteg involved in the sensory
aspects of the project.
■
ABBREVIATIONS
PDO, protected designation of the origin; 3SH,
3-sulfanylhex-anol; sCO
2, supercritical carbon dioxide; OAV, odor activity
value; MIC, modified color intensity; TPI, total phenolic
index; H
2S, hydrogen sulfide; FFT, 2-furfurylthiol; BM, benzyl
mercaptan; 4-EP, 4-ethylphenol; 4-VG, 4-vinylguaiacol; RSD,
relative standard deviation; RSD
vintage, relative standard
deviation between the two vintages; SW, synthetic wine;
DOD, degree of difference; ANOVA, analysis of variance; CA,
correspondence analysis; HA, hydroxycinnamic acids; AEDA,
aroma extract dilution analysis
■
REFERENCES
(1) OIV. Distribution of the World’s Grapevine Varieties in 2015. Focus 2017, 2014, p 54.
(2) Meredith, C.; Boursiquot, J.-M. Origins and Importance of Syrah Around the World. International Syrah Symposium; Lyon, France, 2008; pp 17−20.
(3) Takase, H.; Sasaki, K.; Shinmori, H.; Shinohara, A.; Mochizuki, C.; Kobayashi, H.; Saito, H.; Matsuo, H.; Suzuki, S.; Takata, R. Analysis of Rotundone in Japanese Syrah Grapes and Wines using Stir Bar Sorptive Extraction (SBSE) with Heart-Cutting Two-Dimensional GC-MS. Am. J. Enol. Vitic. 2015, 66, 398−402.
(4) Wood, C.; Siebert, T. E.; Parker, M.; Capone, D. L.; Elsey, G. M.; Pollnitz, A. P.; Eggers, M.; Meier, M.; Vössing, T.; Widder, S.; Krammer, G.; Sefton, M. A.; Herderich, M. J. From Wine to Pepper: Rotundone, an Obscure Sesquiterpene, is a Potent Spicy Aroma Compound. J. Agric. Food Chem. 2008, 56, 3738−3744.
(5) Koch, A.; Doyle, C. L.; Matthews, M. A.; Williams, L. E.; Ebeler, S. E. 2-Methoxy-3-isobutylpyrazine in Grape Berries and its Dependence on Genotype. Phytochemistry 2010, 71, 2190−2198.
(6) Segurel, M. Contribution des Précurseurs Glycosidiques et du Sulfure de Diméthyle des Baies de Vitis vinifera L. Cv Grenache Noir et Syrah à l’Arôme des Vins de la Vallée du Rhône; École Nationale Supérieure Agronomique: Montpellier, 2005.
(7) Masson, G.; Schneider, R. Key Compounds of Provence Rosé Wine Flavor. Am. J. Enol. Vitic. 2009, 60, 116−122.
(8) Mayr, C. M.; Geue, J. P.; Holt, H. E.; Pearson, W. P.; Jeffery, D. W.; Francis, I. L. Characterization of the Key Aroma Compounds in Shiraz Wine by Quantitation, Aroma Reconstitution, and Omission Studies. J. Agric. Food Chem. 2014, 62, 4528−4536.
(9) Ferreira, V.; Ortín, N.; Escudero, A.; López, R.; Cacho, J. Chemical Characterization of the Aroma of Grenache Rosé Wines: Aroma Extract Dilution Analysis, Quantitative Determination, and Sensory Reconstitution Studies. J. Agric. Food Chem. 2002, 50, 4048− 4054.
(10) Grosch, W. Evaluation of the Key Odorants of Foods by Dilution Experiments, Aroma Models and Omission. Chem. Senses 2001, 26, 533−545.
(11) Frank, S.; Wollmann, N.; Schieberle, P.; Hofmann, T. Reconstitution of the Flavor Signature of Dornfelder Red Wine on the Basis of the Natural Concentrations of Its Key Aroma and Taste Compounds. J. Agric. Food Chem. 2011, 59, 8866−8874.
(12) Sáenz-Navajas, M.-P.; Campo, E.; Culleré, L.; Fernández-Zurbano, P.; Valentin, D.; Ferreira, V. Effects of the Nonvolatile Matrix on the Aroma Perception of Wine. J. Agric. Food Chem. 2010, 58, 5574−5585.
(13) Lytra, G.; Tempere, S.; de Revel, G.; Barbe, J.-C. Distribution and Organoleptic Impact of Ethyl 2-Hydroxy-4-methylpentanoate Enantiomers in Wine. J. Agric. Food Chem. 2012, 60, 1503−1509.
(14) Ruiz-Rodríguez, A.; Fornari, T.; Jaime, L.; Vázquez, E.; Amador, B.; Nieto, J. A.; Yuste, M.; Mercader, M.; Reglero, G. Supercritical CO2 Extraction Applied Toward the Production of a
Functional Beverage from Wine. J. Supercrit. Fluids 2012, 61, 92−100. (15) Tonietto, J.; Carbonneau, A. Régime Thermique en Période de Maturation du Raisin dans le Géoclimat Viticole: Indice de Fraîcheur des Nuits-IF et Amplitude Thermique. Proceedings of the Symposium International sur le Zonage Vitivinicole, Avignon, France, 2002; pp 279− 289.
(16) Ortega, C.; López, R.; Cacho, J.; Ferreira, V. Fast Analysis of Important Wine Volatile Compounds: Development and Validation of a New Method Based on Gas Chromatographic−Flame Ionisation Detection Analysis of Dichloromethane Microextracts. J. Chromatogr. A 2001, 923, 205−214.
(17) López, R.; Aznar, M.; Cacho, J.; Ferreira, V. Determination of Minor and Trace Volatile Compounds in Wine by Solid-Phase Extraction and Gas Chromatography with Mass Spectrometric Detection. J. Chromatogr. A 2002, 966, 167−177.