O
pen
A
rchive
T
OULOUSE
A
rchive
O
uverte (
OATAO
)
OATAO is an open access repository that collects the work of Toulouse researchers and
makes it freely available over the web where possible.
This is an author-deposited version published in :
http://oatao.univ-toulouse.fr/
Eprints ID : 13936
To link to this article : DOI:10.1016/j.ecolmodel.2014.10.002
URL :
http://dx.doi.org/10.1016/j.ecolmodel.2014.10.002
To cite this version : Gaudio, Noémie and Belyazid, Salim and
Gendre, Xavier and Mansat, Arnaud and Nicolas, Manuel and
Rizzetto, Simon and Sverdrup, Harald and Probst, Anne Combined
effect of atmospheric nitrogen deposition and climate change on
temperate forest soil biogeochemistry: A modeling approach.
(201
5) Ecological Modelling, vol. 306. pp. 24-34. ISSN 0304-3800
Any correspondance concerning this service should be sent to the repository
administrator:
[email protected]
Combined effect of atmospheric nitrogen deposition and climate
change on temperate forest soil biogeochemistry: A modeling
approach
Noémie Gaudio
a,b,*
, Salim Belyazid
c, Xavier Gendre
d, Arnaud Mansat
a,b,
Manuel Nicolas
e, Simon Rizzetto
a,b, Harald Sverdrup
f, Anne Probst
a,baUniversité de Toulouse, INP, UPS, EcoLab (Laboratoire Ecologie Fonctionnelle et Environnement), ENSAT, Avenue de l'Agrobiopole, F-31326 Castanet Tolosan,
France
bCNRS, EcoLab, F-31326, Castanet Tolosan, France
cBelyazid Consulting and Communication AB, Österportsgatan 5C, S-21128 Malmö, Sweden
dIMT, UMR CNRS 5219, Université Paul-Sabatier, Route de Narbonne, F-31062 Toulouse Cedex 9, France
eOffice National des Forêts, Direction Forêts et Risques Naturels, Département R&D, Bâtiment B, Boulevard de Constance, F-77300 Fontainebleau, France fApplied Systems Analysis and Dynamics Group, Chemical Engineering, Lund University, Box 124, S-22100 Lund, Sweden
A B S T R A C T
Atmospheric N deposition is known to severely impact forest ecosystem functioning by influencing soil biogeochemistry and nutrient balance, and consequently tree growth and overall forest health and biodiversity. Moreover, because climate greatly influences soil processes, climate change and atmospheric N deposition must both be taken into account when analysing the evolution of forest ecosystem status over time.
Dynamic biogeochemical models have been developed to test different climate and atmospheric N deposition scenarios and their potential interactions in the long term. In this study, the ForSAFE model was used to predict the combined effect of atmospheric N deposition and climate change on two temperate forest ecosystems in France dominated by oak and spruce, and more precisely on forest soil biogeochemistry, from today to 2100. After a calibration step and following a careful statistical validation process, two atmospheric N deposition scenarios were tested: the current legislation in Europe (CLE) and the maximum feasible reduction (MFR) scenarios. They were combined with three climate scenarios: current climate scenario, worst-case climate scenario (A2) and best-case climate scenario (B1). The changes in base saturation and inorganic N concentration in the soil solution were compared across all scenario combinations, with the aim of forecasting the state of acidification, eutrophication and forest ecosystem recovery up to the year 2100.
Simulations highlighted that climate had a stronger impact on soil base saturation, whereas atmospheric deposition had a comparative effect or a higher effect than climate on N concentration in the soil solution. Although deposition remains the main factor determining the evolution of N concentration in soil solution, increased temperature had a significant effect. Results also highlighted the necessity of considering the joint effect of both climate and atmospheric N deposition on soil biogeochemistry.
1. Introduction
Anthropogenic activities have contributed significantly to an increase in nitrogen and sulfur emissions since the end of the 1800s, leading to the acidification and eutrophication of
ecosys-tems (Galloway et al., 2003 De Vries et al., 2007;De Schrijver et al.,
2008). Atmospheric deposition is known to have a severe impact
on forest ecosystem functioning by influencing soil biogeochem-istry and nutrients balance, and consequently tree growth and
* Corresponding author. Present address: 42 chemin Michoun, F-31500 Toulouse, France. Tel.: +33 5 34 30 71 74.
E-mail addresses:[email protected](N. Gaudio),[email protected] (S. Belyazid),[email protected](X. Gendre),
[email protected](A. Mansat),[email protected](M. Nicolas), [email protected](S. Rizzetto),[email protected] (H. Sverdrup),[email protected](A. Probst).
overall forest health and biodiversity (Probst et al., 1995; Belyazid et al., 2006; Jonard et al., 2012).
Owing to the transboundary nature of atmospheric pollution, the United Nations Convention on Long-Range Transboundary Air Pollution (LRTAP) was established involving all European countries (UNECE, 2005). In this context, a common effort was made to reduce atmospheric emissions from the 1980s, keeping in mind that the Earth’s soil can be considered a public good that is always at risk from the use of short-term and highly profitable technology typical of our century (Perc et al., 2013). As a result, atmospheric sulfur emissions have decreased by almost 80% in France, and the same trend has been observed in measured atmospheric deposi-tion (Pascaud, 2013). Nevertheless the decrease was less obvious for nitrogen, with deposition reductions of around 35% and 5% for NOx and NHy respectively (CITEPA, 2010), due especially to the multitude and diversity of nitrogen sources (Galloway et al., 2008). Moreover, the nitrogen cycle is more complex than that of sulfur as nitrogen interacts with all ecosystem compartments, e.g., soil, plants and micro-organisms, and through various chemical forms (Galloway et al., 2003). For these reasons, atmospheric nitrogen emissions, deposition and effects on ecosystems have become an area of great interest in research in recent decades (Bobbink et al., 2010; Van Dobben and de Vries, 2010).
The noticeable impact of nitrogen on terrestrial ecosystems, and particularly on forests, is well documented in literature. Many experiments have been designed to study the impact of various nitrogen concentrations on soil biogeochemistry and vegetation composition. Results highlight significant variations in the nitrogen cycle as a consequence of higher nitrogen inputs, ranging from mineralisation and nitrification (Aber et al., 1995) to changes in species richness (Stevens et al., 2004), composition (Krupa, 2003; De Vries et al., 2007; Bobbink et al., 2010) or relative abundance (Gilliam, 2006). Moreover, leaching of nitrogen from soils involves a concomitant leaching of base cations (Dambrine et al., 1995), further threatening plant nutrient balances. One way of appreciating overall nitrogen equilibrium in the soil is to consider the balance between nitrogen inputs into the ecosystem and nitrogen immobilisation and uptake (UNECE, 2004), where nitrogen leaching occurs when inputs are greater than immobi-lisation and uptake. Therefore, nitrogen concentration in soil solution is often considered a key sensitive parameter for assessing the impact of atmospheric deposition on a given ecosystem.
Field experimental studies obviously depend on ecosystem characteristics such as soil pH. It has been shown, for example, that the nitrogen mineralisation rate increases with nitrogen atmo-spheric deposition and that the more acidic the soil, the faster the processes (Falkengren-Grerup and Diekmann, 2003).
Nevertheless, field experiments dealing with the impact of atmospheric N deposition do not enable predictions to be made for the long term. Therefore in order to model and predict the impact of atmospheric N deposition on forest ecosystems, and more particularly on soil biogeochemistry, a modeling approach is required. Historically, models developed for this purpose have been based on the ecosystem mass balance which, using nitrogen inputs and outputs through a given ecosystem, reflects the atmospheric N deposition that the ecosystem can tolerate before showing harmful changes (Hettelingh et al., 2001; Spranger et al., 2008). However, this modeling approach is steady state, i.e., it relies on the ecosystem having a sustainable state. Dynamic biogeochemical models have been developed to include time trends and changes (seeDe Vries et al., 2010for an overview of the existing models). This is particularly important for testing different scenarios of atmospheric N deposition that, by definition, change over time.
Moreover, the impact of atmospheric N deposition must be considered in the today’s context of climate change (Wamelink
et al., 2009; Belyazid et al., 2011a De Vries and Posch, 2011). Indeed, soil biogeochemistry is directly and strongly affected by climate since climate influences soil temperature and moisture conditions, which themselves are a major driver of the decomposition of soil organic matter and consequently of soil nitrogen availability (Rustad et al., 2001; Ge et al., 2010; Butler et al., 2012; Guntinas et al., 2012). Therefore the expected temperature increase due to future climate change could also affect soil nitrogen processes.
Atmospheric N pollution and climate change impacts on ecosystems are traditionally considered separately, whereas they have a combined effect (Van Harmelen et al., 2002;Swart, 2004; Bytnerowicz et al., 2007; Serengil et al., 2011). To model and predict forest ecosystem trends effectively over time, climate change and atmospheric N deposition must both be taken into account.
In this context, this study aimed to use a modeling approach to predict the combined effect of atmospheric N deposition and climate change on temperate forest ecosystems in France, and more precisely on forest soil biogeochemistry, from the present day to 2100. Modeling tests were computed to determine the relative importance of climate and atmospheric N deposition on the N cycle and base saturation in the soil, both of which are of considerable importance for tree growth and forest stand development. To achieve these objectives, the integrated biogeo-chemical model ForSAFE (Wallman et al., 2005; Belyazid, 2006) was calibrated and validated for French forests, and used to simulate the future development of two forest sites in France dominated by oak and spruce.
2. Material and methods 2.1. Modeling tool: ForSAFE 2.1.1. Description
The ForSAFE biogeochemical model has been used in a number of European countries (Belyazid et al., 2006; Moncoulon et al., 2007; Belyazid et al., 2011b) and has regularly been improved as a matter of common concern. ForSAFE builds on the merger and then the improvement of the PnET forest growth model (Aber and Federer, 1992; Aber et al., 1997) and the SAFE soil geochemistry model (Warfvinge et al., 1993). It is a dynamic and process-based model at forest-stand scale.
ForSAFE includes four submodels related to: (1) soil hydrology, (2) soil chemistry and weathering, (3) soil organic matter decomposition and (4) photosynthesis and tree growth (Wallman et al., 2005; Belyazid, 2006).
ForSAFE simulates the temporal changes of a forest ecosystem, depending on soil characteristics, climate, atmospheric deposition and forest stand characteristics. Model outputs include the allocation of the major elements (C, N, Mg, Ca, K) in the three tree compartments (leaves, wood and roots), the uptake of these elements for tree growth, the fluxes (i.e., light and rainfall intercepted by trees and thus reaching the ground), the nitrogen and base cation content in foliage, the base cation weathering rate, the soil organic carbon and nitrogen content in the forest soil and deadwood, the soil solution characteristics (pH, concentration of major elements) for each soil layer, the tree biomass by compartment, the leaf area index and net photosynthesis, and finally soil moisture, potential and real evapotranspiration and percolation.
2.1.2. Calibration
The main calibration was performed on the characteristics of the dominant tree species of the forest stand under consideration (Wallman et al., 2005). The PnET model was used in ForSAFE partly because of the full set of parameters existing for different tree
species (Aber et al., 1995, 1997). Parameter values were given for deciduous tree species in general and spruce-fir stands. These parameters concern canopy, photosynthesis and water balance variables, and the allocations of carbon, nitrogen and base cations. Nevertheless, these data can obviously be improved and in the present study an attempt was made to do this with in-depth bibliographical research. The main improvements undertaken were related to the tree species of interest, i.e., Quercus petraea and Picea abies, and dealt with the estimation of light requirements (Ellenberg et al., 1992; Gardiner et al., 2009), N-foliar retention (Hagen-Thorn et al., 2006), relative foliar composition in terms of base cations and N (Sariyildiz and Anderson, 2005) and fine root distribution in the soil (Rosengren and Stjernquist, 2004; Bolte and Villanueva, 2006; Tatarinov et al., 2008; Bolte and Löf, 2010; Persson and Stadenberg, 2010).
2.1.3. Validation
The performance and reliability of the model were checked using output data on tree biomass, and soil solution major
elements (inorganic N, base cations, chloride, and sulfur) concentration and pH. Two types of elements were distinguished according to whether they interact (active elements) or not (inert elements) with forest canopy, tree roots or soil structure and components (Probst et al., 1990, 1992; Houle et al., 1999 Žaltauskait _e and Juknys, 2007).
Inert elements were represented in the study context by chloride, sulfur and sodium, which mainly originate from atmospheric deposition and/or mineral weathering. A valuable simulation of their concentrations in soil solution revealed the good functioning of the hydrological submodel and the exchange processes in the soil, since inert elements were assumed to follow water fluxes without being taken up or interacting with soil clay– humic complex or vegetation. The active elements investigated were N and base cations (K, Mg, Ca). An accurate simulation of their concentrations in soil solution reflected a good parameterisation of the other processes included in the modeling chain, linked to soil chemistry, exchangeable processes, weathering, soil organic matter decomposition and tree physiological processes. Soil pH was considered as an integrative variable of the different reactions occurring in the soil, as well as the whole composition of the soil solution.
All these parameters were compared against measured values of soil solution characteristics and stand biomass for two forest stands in France, presented below.
2.2. Forest sites 2.2.1. Description
The forest sites considered in this study are part of the RENECOFOR network (REseau National de suivi à long terme des ECOsystèmes FORestiers) (Ulrich and Lanier, 1996), which is the French part of the European level II (Ferretti et al., 2010) monitoring network under the ICP Forests program. Two forest sites, CHS41 and EPC87, were selected. The selection was based on the variety of the dominant tree species, soil type and climate. The two sites also had data available on the whole biogeochemical cycle (Ponette et al., 1997). The environmental parameters of these two forest sites, described inTable 1, have been followed since 1993.
2.2.2. Input data
ForSAFE requires input data for atmospheric deposition, soil characteristics, forest management and climate. These are site-specific inputs, distinct from the parameters necessary to describe and constrain different processes included in the model (Wallman et al., 2005; Belyazid, 2006)
Table 1
Description of two forest sites (CHS41 and EPC87) of the French ICP forests network (RENECOFOR): dominant tree species, geographical coordinates, altitude (m), yearly averaged rainfall (mm year!1), yearly averaged atmospheric deposition (mEq m!2year!1) and soil type are informed. Both rainfall
and deposition were measured on the 1993–2008 period. Total deposition was calculated for each element (see Section2.2.2) on the basis of the measurements from the RENECOFOR database (Ulrich et al., 1998). EPC87.
Forest site name CHS41 EPC87
Dominant tree species Quercuspetraea(Matt.) Liebl Piceaabies(L.) Karst Latitude–longitude 47"3400900N#2!3#15036”E 45"4800000N#2!3#4805500E
Altitude (m) 127 650 Rainfall (mm year!1) 766 1594
Atmospheric deposition (mEq m!2year!1) 25 38
S–SO42! 48 77 Cl! 33 46 N–NO3! 49 61 N–NH4+ 37 44 Ca2+ 11 16 Mg2+ 5 8 K+ 31 61 Na+
Soil type (Baize et al., 2002) Luvisolredoxisol Alocrisol
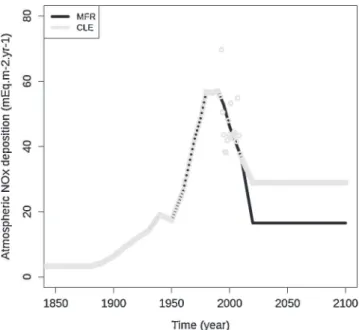
[(Fig._1)TD$FIG]
Fig. 1.Time evolution, from 1850 to 2100, of the atmospheric NOx (mEq m!2
year!1) deposition under a Norway spruce stand (EPC87, ICP Forests, France),
according to two deposition scenarios: CLE = current legislation in Europe, MFR = maximum feasible reduction.
Table 2
Main soil characteristics per soil layer (Brêthes and Ulrich, 1997) for the two RENECOFOR forest sites (ICP Forests) CHS41 and EPC87, that were respectively characterized by four and five soil layers. Data were measured or calculated from measured data. If no data were available, generic data were taken from literature. References used to choose the formulas applied for the calculations or the generic data were specified.
Soil data Units Data type CHS41 EPC87 Layer thickness m Measured A 0.08 Ah 0.1
Eg1 0.17 Bph 0.31 Eg2 0.26 Bps 0.25 BTg1 0.11 C1 0.6
C2 0.24 Bulk density BD kg m!3 Measured A 766 Ah 529
Eg1 1306 Bph 802 Eg2 1329 Bps 1002 BTg1 1296 C1 1157 C2 1391 Soil texture ST
(clay, loam, sand)
% Measured A 17-61-22 Ah 19-23-58 Eg1 20-59-21 Bph 18-14-68 Eg2 29-54-17 Bps 7-26-67 BTg1 47-43-10 C1 10-26-64 C2 2-13-85 Specific surface area m2m-3 Calculated from ST
(Jönsson et al., 1995)
(Kurtz, personal communication)
A 1966812 Ah 1029523 Eg1 3475070 Bph 1394571 Eg2 3792187 Bps 1311901 BTg1 3775141 C1 1761530 C2 990986 pCO2(multiplicative factor for CO2
ambient partial pressure)
– Generic (depends on soil depth) (Moncoulon et al., 2007) A 5 Ah 5 Eg1 10 Bph 10 Eg2 10 Bps 20 BTg1 20 C1 20 C2 20 Gibbsite solubility constant – Generic
(Warfvinge and Sverdrup, 1995)
A 6.5 Ah 6.5 Eg1 7.5 Bph 7.5 Eg2 8.5 Bps 8.5 BTg1 8.5 C1 8.5 C2 9.2 Cation exchange capacity CEC kEq kg!1 Measured A 4.8 E!5 Ah 10 E!5
Eg1 3.3 E!5 Bph 4.1 E!5
Eg2 3.6 E!5 Bps 2 E!5
BTg1 10 E!5 C1 1 E!5
C2 1.1 E!5
Base saturation – =PBc/CEC
where Bc is the Base cations concentration (kEq kg!1) measured for each horizon
A 0.305 Ah 0.105 Eg1 0.094 Bph 0.066 Eg2 0.129 Bps 0.087 BTg1 0.267 C1 0.151 C2 0.078 C/N – Measured A 21.87 Ah 17.82 C in soil organic matter g m!2 Measured A 3082 Ah 5053
Eg1 1798 Bph 8826 Eg2 1907 Bps 5286 BTg1 425 C1 2577 C2 965 N in soil organic matter g m!2 Measured A 141 Ah 284
Eg1 165 Bph 542 Eg2 128 Bps 328 BTg1 38 C1 205 C2 75 Field capacity FC m3m!3 Measured A 0.567 Ah 0.443
Eg1 0.203 Bph 0.292 Eg2 0.217 Bps 0.241 BTg1 0.239 C1 0.176 C2 0.083 Wilting point WP m3m!3 Measured A 0.249 Ah 0.345
Eg1 0.091 Bph 0.179 Eg2 0.103 Bps 0.116 BTg1 0.173 C1 0.076 C2 0.033 Field saturation m3m!3 =(1 ! BD)/host rock density
(Wallman et al., 2005) A 0.701 Ah 0.793 Eg1 0.49 Bph 0.687 Eg2 0.481 Bps 0.609 BTg1 0.494 C1 0.548 C2 0.456 Limit for evapotranspiration m3m!3 =WP + y $ (FC ! WP)
where y depends on ST
(Bortoluzzi et al., 2010; Wallman et al., 2005)
A 0.532 Ah 0.428 Eg1 0.19 Bph 0.275 Eg2 0.204 Bps 0.223 BTg1 0.233 C1 0.161
2.2.2.1. Atmospheric deposition. Two datasets were used. Bulk deposition and throughfall compositions were measured monthly from 1993 to 2008 at the two sites (Ulrich et al., 1998) and therefore the measured deposition was used for this period, while EMEP model (Iversen, 1993) was applied to estimate and reconstruct atmospheric deposition from 1880 to 1993, after having been adjusted to the measured values. From 2009 to 2100, two realistic atmospheric deposition scenarios were computed: (1) the current legislation in Europe (CLE) deposition scenario, defined by European legislation and the Gothenburg protocol (Schöpp et al., 2003) and (2) the maximum feasible reduction (MFR) scenario, corresponding to emissions being reduced to what is currently technically possible (Fig. 1).
The atmospheric deposition input required to run the model is the “total deposition”. For inert elements (chloride, sulfur, sodium), that do not interact with the forest canopy, throughfall concen-trations were used as a proxy for total deposition. For active elements, a “corrected bulk deposition” was taken as the model input because bulk open field deposition underestimates dry deposition due to sensors characteristics (Probst et al., 1990; Lovett and Lindberg, 1993). To make the correction, the assumption made was that differences registered between throughfall and bulk deposition for chloride (Cl) reflected the part of dry deposition that was not taken into account in bulk deposition above the canopy. Therefore, the bulk deposition concentration measured for nitrogen and base cations was corrected by the ratio
Clthroughfall/Clbulkdeposition. Average yearly deposition values for
the two sites are shown inTable 1.
2.2.2.2. Soil characteristics. Soil characteristics were described for each soil layer, with the total depth taken into account varying depending on the available data (Brêthes and Ulrich, 1997; Ponette et al., 1997). Data were measured once in 1995 or 2007. The soil parameters used for the modeling are described inTable 2, which also specifies whether the soil data were measured or calculated from measured data or were generic data taken from literature.
All the variables presented inTable 2are input data needed to run ForSAFE. For the fraction of fine roots, it should be specified that the nutrient uptake by the trees in ForSAFE is proportional to the fine root fraction in each soil layer, with the total amount of fine roots in the combined soil layers corresponding to 100%.
Moreover, soil layer mineralogy needed for the two forest sites was estimated from previous studies (Party, 1999) using chemical analysis of major elements present in the soil. From that, weathering rates were estimated for the PROFILE model (Sverdrup and Warfvinge, 1988).
2.2.2.3. Forest management. Input data related to forest management dealt with: (1) year of thinning, (2) intensity of thinning (considering tree biomass) and (3) percentage of wood removed from the forest stand after each thinning. Past forest management history was rebuilt based on information supplied by forest managers responsible for the two forest sites under consideration. For the future, the most plausible management scenarios were also designed, but without considering possible natural disturbances (such as storms or dieback due to disease). The current forest stand at CHS41 was naturally regenerated in ca. 1900, while the stand at EPC87 was planted in 1966. Assuming a stand maturity age of 180 and 70 years for oak and spruce respectively, final clearcuts were simulated in the year 2070 for CHS41 and in 2036 for EPC87. Prior to clearcutting, intermediate forest thinning was planned regularly every 8–10 years, with 10 to 25% of the trees cut and under the assumption that 75% of the cut tree biomass would be removed from the forest stand, and that leaves or needles and branches would be left on the forest ground and would thus be available for organic matter decomposition. 2.2.2.4. Climate data and scenarios. Two datasets of climate were used to derive climatic data for the two forest sites. The meteorological database provided by SAFRAN (Quintana-Segui et al., 2008), an analysis system that requires surface observations combined with data from meteorological models to produce hourly meteorological parameters, covers the period from 1959 to 2008. From 2009 to 2100, climate scenarios from the ARPEGE model (Déqué et al., 1994) were used. Two climate scenarios from the Special Reports on Emission Scenarios (SRES) were used in this study: the A2 scenario in which the current emission scheme is followed and corresponds to the worst prediction, and the B1 scenario in which disparities between countries decrease in line with stronger environmental considerations and sustainable
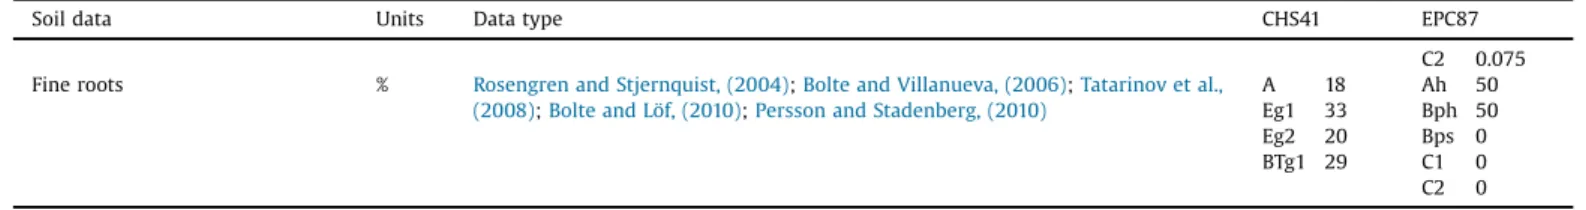
Table 2(Continued)
Soil data Units Data type CHS41 EPC87 C2 0.075 Fine roots % Rosengren and Stjernquist, (2004);Bolte and Villanueva, (2006);Tatarinov et al.,
(2008);Bolte and Löf, (2010);Persson and Stadenberg, (2010)
A 18 Ah 50 Eg1 33 Bph 50 Eg2 20 Bps 0 BTg1 29 C1 0 C2 0
[(Fig._2)TD$FIG]
Fig. 2.Time evolution, from 1959 to 2100, of the three climate scenarios – current climate (no climate change, black line), A2 (light grey line), B1 (dark grey line) – on an oak forest site (CHS41, ICP Forests, France). Climate differences were illustrated here by the average temperature ("C) evolution.
development. For reference, a scenario of no climate change, corresponding to the current climate, was adopted. To build a “typical current climate year”, climate variables (temperature, precipitation) from the SAFRAN database were averaged from 1997 to 2007 for the two sites (Fig. 2).
2.2.3. Validation data
Soil solution composition and pH were measured monthly at a 20 cm depth from 1993 to mid-2009 (Ponette et al., 1997). These data can be compared with the simulated data of the correspond-ing soil layer that are at a monthly step.
Moreover, the estimated wood biomass of the two forest sites was used to validate simulated forest stand growth. Tree biomass was calculated from available data on the RENECOFOR sites using the formula fromPardé (1963)Eq.(1):
Treebiomass ¼ G $ H $ SC $ D (1)
where G stand basal area (measured in RENECOFOR), H average stand height (measured in RENECOFOR),SC dominant tree species shape coefficient (Pardé, 1963), species and age-dependent, D wood density (fixed to 700 and 450 kg m!3for oak and spruce
respectively).
This formula was developed for forest managers with wood production in mind. Consequently, tree biomass here only reflects the stem and branch biomass, while leaf and root biomass are not taken into account.
Depending on the frequency of the forest surveys, six to eight tree biomass estimations were assessed between 1991 and 2010. As no measured data relative to root or foliage biomass were available, these parameters were not validated.
2.3. Data analysis
2.3.1. Data were analysed using R software (http://www.r-project.org/). In order to validate the ForSAFE model, simulated data and a set of measured data were compared on the two forest sites CHS41 and EPC87 from 1993 to mid-2009. A statistical analysis was performed on soil solution characteristics (i.e., concentrations of major elements and pH), whereas stem biomass validation was only appreciated visually due to the lack of data. A multiple testing approach was considered (Fromont and Laurent, 2006; Fromont et al., 2011). For each soil solution element, the difference Y between simulated and measured time series was considered, where Y was assumed to be a Gaussian vector with an unknown mean s and independent coordinates. Thus, the null hypothesis
(s = 0) means that simulated data perfectly reflect measured values. Three measures of model performance were calculated: the normalised average error (NAE), the normalised root mean square error (NRMSE) and the modeling efficiency (ME) (Janssen and Heuberger, 1995). The first two parameters are linked to the bias and the deviation of the simulated data relative to the measured data, whereas ME is useful for ascertaining the quality of the match between the two datasets (Vanclay and Skovsgaard, 1997). This latest criterion provides an index of performance on a relative scale where 1 corresponds to a perfect fit between simulated and measured data, 0 indicates that the model is not better than a simple average and negative values reflect a model's poor predictive performance.
Dealing with long-term simulations, ANOVAs were run to determine the effect of both climate and atmospheric N deposition scenarios on soil characteristics. The focus was on two soil characteristics: soil base saturation (BS), reflecting acidification, and N concentration in soil solution, reflecting eutrophication. BS and N taken into account in statistical analysis were computed over the course of the ten years before the final forest clearcut, i.e., from 2060 to 2070 for CHS41 and from 2026 to 2036 for EPC87. The six possible combinations of atmospheric N deposition and climate scenarios (CLE/A2-B1-no climate change and MFR/A2-B1-no climate change) were considered: when relevant (p-value <0.05), means were compared using Tukey’s test.
3. Results and discussion 3.1. Validation: model performance
The simulated forest stand biomass was visually compared to the observed data. It was quite well simulated at the two sites, with a slight overestimation at EPC87 (Table 3).
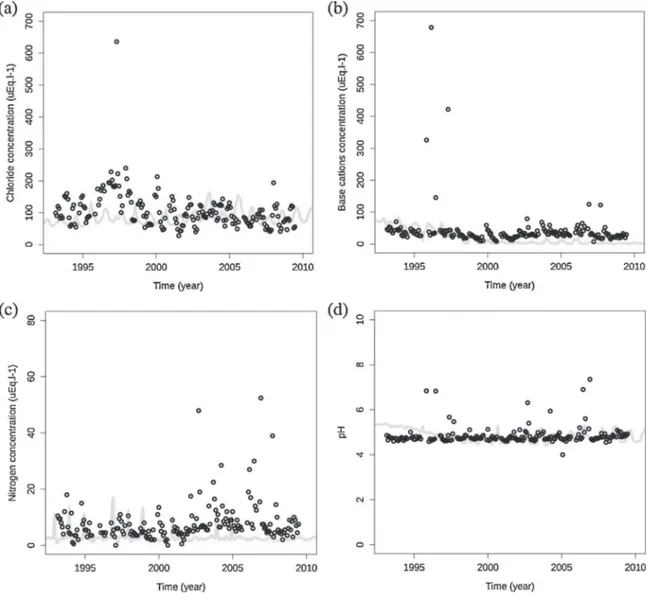
For soil solution data, two kinds of validation were identified: hydrological functioning based on inert elements, and all the soil and forest processes based on active elements and pH. All the statistical results are summarised inTable 4. The test procedure in this study only validated the perfect match between simulated and measured data for chloride for CHS41, and for base cations for EPC87. Nevertheless, the overall model performance was accept-able, except in the case of N for CHS41. Nevertheless, this point could be related to some missing data in the set: when nitrogen concentration was below the sensor sensitivity, data were considered as null. Despite discrepancies in point-to-point comparisons between simulated and measured data, overall trends were relatively well preserved by ForSAFE (Fig. 3). Moreover, it is important to highlight that this type of simulation, in the context of the present study, is dedicated to appreciating
Table 3
Comparison between measured and simulated (with ForSAFE model) stem biomass (g m!2) for the two RENECOFOR forest sites CHS41 and EPC87 from 1991 to 2011.
Stem biomass (g m!2)
Forest site Year Measured Simulated CHS41 1991 26995 26110 1995 28023 29107 2000 33053 33026 2002 35749 34510 2003 30766 30882 2004 32064 31637 2009 35734 34795 2010 36090 34909 2011 27821 28106 EPC87 1991 8487 13717 1995 11817 16978 1996 8879 13683 2000 13574 16615 2001 12398 16074 2003 14700 17463 2004 12391 14922 2009 16691 19163 Table 4
Comparison between measured and simulated (with ForSAFE model) soil solution characteristics for the two RENECOFOR forest sites CHS41 and EPC87, from 1993 to mid-2009. NAE (normalised average error), NRMSE (normalised root mean square error) and ME (modelling efficiency) were calculated for the soil solution concentration of chloride (Cl), sulfur (S–SO4), sodium (Na), base cations (Bc) and
nitrogen (N), and pH. 149 and 186 measurements were respectively collected for CHS41 and EPC87, and the simulated data have a monthly time step. and measured data perfectly matched.
CHS41 EPC87
NAE NRMSE ME NAE NRMSE ME Cl !0.13* 0.70* !1.36* !0.22 0.65 !0.4 S–SO4 !0.45 0.65 !0.56 !0.22 0.36 !0.58 Na !0.33 0.6 !2.25 !0.08 0.45 !0.72 Bc !0.13 0.48 !0.12 0.19* 1.55* !0.05* Inorganic N 4.42 5.74 !6.53 !0.45 1.79 !0.19 pH 0.09 0.13 !1.12 0.08 0.13 !0.83 * = simulated
long-term trends and not to simulating short-term variations perfectly. For this reason, the model showed a predictive ability not far from that of the mean (ME close to 0), which is often noticed in such models (Jonard et al., 2012).
Regardless of the forest site, the hydrology was well simulated, but N in the soil solution was slightly overestimated by the model, even if the simulated values remained in the range of measured data, i.e., all N concentrations were between 0 and 20
m
Eq l!1. This slightoverestimation could come from the fact that ForSAFE takes the impact of trees on soil solution into account while the impact of understorey vegetation is not yet considered, whereas it might have a noticeable impact on overall forest N uptake (Moore et al., 2007).
After the year 2000 at EPC87, there was a greater mismatch between the measured and simulated N concentrations in soil solution (Fig. 3c). EPC87 was slightly affected by the storm Lothar which occurred in France in 1999 and damaged a high proportion of French forests. Following a storm event, N uptake by trees obviously decreases, as observed after a clearcut, due to the destruction of part of the trees (Didon-Lescot, 1998). The increased debris on the forest floor might constitute an additional source of N (Legout et al., 2009). Moreover, after tree cutting, the soil temperature can increase by additional light reaching the ground, leading to the enhancement of organic matter mineralisation and
thus increasing N concentration in soil solution (Rosén and Lundmark-Thelin, 1987). This underlines the importance of including forest management as well as natural disturbances as a model process in ForSAFE functioning, as shown in other biogeochemical models (Van der Heijden et al., 2011).
3.2. Long-term simulations
Simulations were run up to the year 2100. The impact of climate change and atmospheric N deposition was tested on soil base saturation and inorganic nitrogen concentration in soil solution, where the pair “CLE-no climate change” scenario is considered as the reference.
3.2.1. Effect of atmospheric N deposition and climate change on base saturation (BS)
For the two forest sites, climate change had a greater impact than atmospheric N deposition on BS, as shown by the F-ratio (Table 5). Moreover, BS under MFR was significantly higher than BS under CLE (Table 5,Fig. 4a and b) when considering the same climate scenario. Under MFR, atmospheric N deposition is lower than under CLE, and consequently so are the protons brought together with ammonium. Therefore, it could be assumed that the
[(Fig._3)TD$FIG]
Fig. 3.Temporal trends of simulated (grey line) and measured (black circles) major elements soil solution concentrations and pH on a Norway spruce stand (EPC87, ICP Forests, France), from 1993 to mid-2009. Chloride (a) is an inert element reflecting soil hydrology processes of the biogeochemical model ForSAFE whereas base cations (b), nitrogen (c) and pH (d) reflected soil processes.
lower proton inputs to the soil under MFR might contribute to a decrease in base cation leaching since base cation exchange with protons occurs to a lesser extent (Yamada et al., 2013).
Within the same atmospheric N deposition scenario, average BS increased significantly as climate predictions worsened (Table 5), reflecting global warming and the decrease in rainfall. Thus, BS was highest under A2 and lowest under no climate change, with BS under B1 being intermediate, at least for CHS41 (Fig. 4a). The temperature increase might accelerate soil organic matter
mineralisation and thus base cation release in the soil (Aherne et al., 2012). However, this effect was not as pronounced in EPC87 (Fig. 4b). The difference between BS under no climate change and the two other climate scenarios was obvious, but unexpectedly BS was slightly higher under B1 than under A2 for the two deposition scenarios. This might be explained by the difference in when the simulation ended that could actually have an influence on results. The final clearcut in EPC87 was simulated in 2036 (see Section 2.2.2), implying that average BS was calculated from
Table 5
Predicted average soil base saturation and inorganic nitrogen concentration (Eq l!1) in soil solution over the course of the ten years before the final forest clearcut, i.e., from
2060 to 2070 for CHS41 and from 2026 to 2036 for EPC87. Results were given for six atmospheric N deposition and climate scenarios combinations: CLE-no climate change (noCC), CLE-B1, CLE-A2, MFR-noCC, MFR-B1, MFR-A2.
CHS41 EPC87
BS N (mEq l-1) BS N (mEq l-1)
CLE-noCC 0.068 & 0.028 (c)B 6.50 & 3.09 (b)A 0.004 & 0.001 (c)B 2.68 & 0.55 (b)A CLE-B1 0.643 & 0.023 (b)B 9.14 & 5.60 (a)A 0.026 & 0.003 (a)B 3.17 & 2.24 (a)A CLE-A2 0.769 & 0.021 (a)B 10.72 & 6.54 (a)A 0.024 & 0.002 (b)B 3.07 & 1.48 (ab)A MFR-noCC 0.31 & 0.02 (c)A 3.62 & 1.62 (c)B 0.005 & 0.002 (c)A 1.85 & 0.41 (b)B MFR-B1 0.80 & 0.02 (b)A 6.27 & 3.62 (b)B 0.038 & 0.004 (a)A 2.36 & 1.33 (a)B MFR-A2 0.87 & 0.02 (a)A 8.69 & 5.21 (a)B 0.037 & 0.003 (b)A 2.42 & 0.96 (a)B ANOVA p-value, F-ratio
atmospheric N deposition climate change deposition $ climate <0.001, 10181 <0.001, 57 <0.001, 1849 <0.001, 61 <0.001, 57471 <0.001, 62 <0.001, 7536 <0.001, 11 <0.001, 576 NS <0.001, 325 NS
Note: lowercases indicate a statistical difference (p < 0.05) between climate scenarios for a given atmospheric N deposition scenario, whereas uppercases highlight a statistical difference between atmospheric N deposition scenarios for a given climate scenario.
[(Fig._4)TD$FIG]
Fig. 4.Simulated soil base saturation (no unit) and N concentration in soil solution (Eq l!1), with ForSAFE, on two French forest sites dominated by oak (CHS41) and Norway
spruce (EPC87), under the combination of two atmospheric N deposition (CLE and MFR) and three climate scenario (no climate change – noCC -, B1 and A2). BS is represented on figures (a) and (b) and N is represented on figures (c) and (d), for CHS41 and EPC87 respectively. BS and N are average over the course of the ten years before the final forest clearcut, i.e., from 2060 to 2070 for CHS41 and from 2026 to 2036 for EPC87.
2026 to 2036. This occurred much earlier than CHS41 where the final clearcut was simulated in 2070. Thus it was hypothesised here that the changes due to climate change were slow.
To explore this assumption further, Tukey’s tests were carried out at EPC87 on temperature to assess the differences between climate scenarios from 2009 to 2035 on the one hand and from 2036 to 2062 on the other. In the first case, no statistical differences were found among B1 and A2, and the mean temperature tended to be slightly higher under B1. As a consequence, the difference under no climate change was more significant with B1 than with A2. In the second case, all scenarios were significantly different. The fact that the climate scenarios A2 and B1 only differed significantly in the later stages of the simulation period explained their effect also being more pronounced in later stages. Moreover, decomposition of the needle litter is slower than that of broadleaved litter (Prescott et al., 2000; Guo et al., 2010). Thus base cations produced by the mineralisation of needle litter at EPC87 would release over a longer period compared to CHS41.
3.2.2. Effect of atmospheric N deposition and climate change on inorganic nitrogen concentration in soil solution (N)
In contrast to BS, climate had a fairly similar or smaller impact than atmospheric N deposition on N, as shown by the F-ratios (Table 5). Moreover, the interaction between deposition and climate was not significant, indicating that the response scheme of N to atmospheric N deposition was the same whatever the climate conditions.
For the two forest sites, N under CLE was significantly higher than N under MFR (Table 5,Fig. 4c and d) when considering a given climate scenario, which indicated that N deposition had a direct influence on N soil solution under the two forest ecosystem conditions. A decrease in N deposition would significantly contribute to a decrease in N drainage intensity. Within the same deposition scenario, average N concentration in soil solution was significantly smaller under the ‘no climate scenario than under the other two (Table 5). The differences in soil solution N under A2 and B1 only occurred under the MFR scenario for CHS41, indicating that the effect of deposition on soil solution N overshadowed that of climate. The effect of climate could be explained by the fact that higher temperatures under scenario A2 could accelerate nitrogen cycling through faster rates of organic matter decomposition and mineralisation, leading to a higher N concentration in soil solution (Butler et al., 2012; Guntinas et al., 2012). This was particularly true for the deciduous forest ecosystem (CHS41, Table 4, Fig. 4c). Nevertheless, the systematic increase of N with temperature could also come from a decrease in drainage water relative to a higher evapotranspiration from trees without a rainfall increase or also from a decrease in uptake by trees following a decreasing growth rate (Weemstra et al., 2013).
4. Conclusion
This study has underlined that the ForSAFE biogeochemical model integrates sufficient biogeochemical processes to simulate forest ecosystem responses to the combined effects of atmospheric nitrogen deposition and climate change on forest soil biogeo-chemistry.
While the simulation results reinforce the need to consider the combined effects of both climate and atmospheric deposition, they also indicate that the different drivers may have relatively more important implications for different aspects of the ecosystem. Soil alkalinity, in the form of base saturation, is shown to respond more strongly to climatic changes and less strongly to future atmo-spheric N deposition levels. Considering the strong historical reduction in acid deposition (Shöpp et al., 2003), deposition is
expected to play a secondary role to climate in regulating soil base saturation and any future recovery from acidification. On the other hand, future nitrogen deposition is expected to have a stronger effect on soil and runoff water eutrophication than climate. Previous studies have shown that nitrogen deposition may be a more decisive factor than climate in future tree growth trends (De Vries and Posch, 2011), indicating that atmospheric deposition has a stronger effect on the net availability of nitrogen by having a greater impact on the nitrogen cycle.
The model simulations also point to the possibility of reinforcing as well as balancing impacts of climate and atmo-spheric deposition. To illustrate the former, increased temper-atures could lead to higher rates of organic matter decomposition and mineralisation, contributing further to the risk of eutrophica-tion, which is primarily linked to elevated nitrogen deposition. As for the latter, potential water limitations in future may cancel out the effect of elevated nitrogen deposition on tree growth, or even compromise the recovery of soils from acidification by inducing the release of acidifying compounds, both organic and inorganic. The study stresses the need to consider the simultaneous and dynamic effect of climate and atmospheric N deposition on ecosystem processes in general and soil biogeochemistry in particular. It also highlights the importance of integrating system processes in ecosystem modeling, as shown by the significance of soil and plant hydrology in regulating the ecosystem’s response to external drivers.
Finally, considering the size of the soil organic matter stores in forest soils, potential changes in decomposition rates with the subsequent release of organic acids and nutrients may entirely override the hierarchy of contributors to soil alkalinity and eutrophication. This study highlights the need for an understand-ing of the processes governunderstand-ing organic matter turnover and organic nutrient retention in soils, as this is crucial to producing reliable forecasts biogeochemical cycles under changing environmental conditions.
Acknowledgements
The authors thank Marc LANIER from the “Office National des Forêts” for the data relating to the RENECOFOR network, and Météo-France for the data relating to climate scenarios and the SAFRAN database. This study was supported by a grant from ADEME (France, convention n"11 62C 0027) and EPA (Sweden).
References
Aber, J.D., Federer, C.A., 1992. A generalized, lumped-parameter model of photosynthesis, evapotranspiration and net primary production in temperate and boreal forest ecosystems. Oecologia 92, 463–474.
Aber, J.D., Magill, A., McNulty, S.G., Boone, R.D., Nadelhoffer, K.J., Downs, M., Hallett, R., 1995. Forest biogeochemistry and primary production altered by nitrogen saturation. Water Air Soil Pollut. 85, 1665–1670.
Aber, J.D., Ollinger, S.V., Driscoll, C.T., 1997. Modeling nitrogen saturation in forest ecosystems in response to land use and atmospheric deposition. Ecol. Model. 101, 61–78.
Aherne, J., Posch, M., Forsius, M., Lehtonen, A., Härkönen, K., 2012. Impacts of forest biomass removal on soil nutrient status under climate change: a catchment-based modelling study for Finland. Biogeochemistry 107, 471–488.
Baize, D., King, D., Jamagne, M., 2002. The Référentiel Pédologique: a sound reference base for soils - a tool for soil designation. In: Micheli, E., Nachtergaele, F.O., Jones, R.J.A., Montanarella, L. (Eds.), Soil Classification 2001, European Soil Bureau Research Report, EUR 20398 EN. Office for Publications of the European Communities, Luxembourg, pp. 85–92.
Belyazid, S., 2006. Dynamic Modelling of Biogeochemical Processes in Forest Ecosystems (Thesis). Department of Chemical Engineering, Lund University.
Belyazid, S., Westling, O., Sverdrup, H., 2006. Modelling changes in forest soil chemistry at 16 Swedish coniferous forest sites following deposition reduction. Environ. Pollut. 144, 596–609.
Belyazid, S., Kurz, D., Braun, S., Sverdrup, H., Rihm, B., Hettelingh, J.P., 2011a. A dynamic modelling approach for estimating critical loads of nitrogen based on
plant community changes under a changing climate. Environ. Pollut. 159, 789–801.
Belyazid, S., Sverdrup, H., Kurz, D., Braun, S., 2011b. Exploring ground vegetation change for different deposition scenarios and methods for estimating critical loads or biodiversity using the ForSAFE-VEG model in Switzerland and Sweden. Water Air Soil Pollut. 216, 289–317.
Bobbink, R., Hicks, K., Galloway, J., Spranger, T., Alkemade, R., Ashmore, M., Bustamante, M., Cinderby, S., Davidson, E., Dentener, F., Emmett, B., Erisman, J.-W., Fenn, M., Gilliam, F., Nordin, A., Pardo, L., De Vries, J.-W., 2010. Global assessment of nitrogen deposition effects on terrestrial plant diversity: a synthesis. Ecol. Appl. 20, 30–59.
Bolte, A., Löf, M., 2010. Root spatial distribution and biomass partitioning in Quercus robur L. seedlings: the effects of mounding site preparation in oak plantations. Eur. J. For. Res. 129, 603–612.
Bolte, A., Villanueva, I., 2006. Interspecific competition impacts on the morphology and distribution of fine roots in European beech (Fagus sylvatica L.) and Norway spruce (Picea abies (L.) Karst.). Eur. J. For. Res. 125, 15–26.
Bortoluzzi, E., Belyazid, S., Alard, D., Corcket, E., Gauquelin, T., Gégout, J.C., Nihlgard, B., Mansat, A., Party, J.P.H., 2010. Sverdrup Probst A.DYNAMO: Modélisation dynamique des changements de végétation en réponse aux dépôts atmos-phériques d'azote sur les écosystèmes forestiers français en vue du prochain appel à données pour la détermination des charges critiques (convention ADEME-CNRS n"(0962C0029 Final report.
Brêthes, A., Ulrich, E., 1997. RENECOFOR - Caractéristiques pédologiques des 102 peuplements du réseau, observations de 1994/95. Office National des Forêts, Département des Recherches Techniques (eds), ISBN 2-84207-112, Fontainebleau.
Butler, S.M., Melillo, J.M., Johnson, J.E., Mohan, J., Steudler, P.A., Lux, H., Burrows, E., Smith, R.M., Vario, C.L., Scott, L., Hill, T.D., Aponte, N., Bowles, F., 2012. Soil warming alters nitrogen cycling in a New England forest: implications for ecosystem function and structure. Oecologia 168, 819–828.
Bytnerowicz, A., Omasa, K., Paoletti, E., 2007. Integrated effects of air pollution and climate change on forests: A northern hemisphere perspective. Environ. Pollut. 147, 438–445.
CITEPA, 2010. Inventaire des émissions de polluants atmosphériques en France – Sé ries sectorielles et analyses étendues (format SECTEN).http://www.citepa.org/.
Dambrine, E., Bonneau, M., Ranger, J., Mohamed, A.D., Nys, C., Gras, F., 1995. Cycling and budgets of acidity and nutrients in Norway spruce stands in Northeastern France and the Erzgebirge (Czech Republic). Forest Decline and Atmospheric Deposition Effects in the French Mountains. Springer-Verlag, Berlin Heidelberg, pp. 233–258.
De Schrijver, A., Verheyen, K., Mertens, J., Staelens, J., Wuyts, K., Muys, B., 2008. Nitrogen saturation and net ecosystem production. Nature 451.
De Vries, W., Kros, H., Reinds, G.J., Wamelink, W., van Dobben, H., Bobbink, R., Emmet, B., Smart, S., Evans, C., Schlutow, A., Kraft, P., Belyazid, S., Sverdrup, H., van Hinsberg, A., Posch, M., Hettelingh, J.P., 2007. Developments in deriving critical limits and modeling critical loads of nitrogen for terrestrial ecosystems in Europe. Alterra Report 1382. Alterra WUR, Wageningen, The Netherlands.
De Vries, W., Wamelink, G.W.W., van Dobben, H., Kros, J., Reinds, G.J., Mol-Dukstra, J. P., Smart, S.M., Evans, C.D., Rowe, E.C., Belyazid, S., Sverdrup, H., van Hinsberg, A., Posch, M., Hettelingh, J.P., Spranger, T., Bobbink, R., 2010. Use of dynamic soil-vegetation models to assess impacts of nitrogen deposition on plant species composition: an overview. Ecol. Appl. 20, 60–79.
De Vries, W., Posch, M., 2011. Modelling the impact of nitrogen deposition: climate change and nutrient limitations on tree carbon sequestration in Europe for the period 1900–2050. Environ. Pollut. 159, 2289–2299.
Déqué, M., Dreveton, C., Braun, A., Cariolle, D., 1994. The Arpege/Ifs Atmosphere Model – a Contribution to the French Community Climate Modeling. Clim. Dyn. 10, 249–266.
Didon-Lescot, J.F., 1998. The importance of throughfall in evaluating hydrological and biogeochemical fluxes: example of a catchment (Mont-Lozère, France). Proceedings of the International Conference on Catchment Hydrological and Biochemical Processes in Changing Environment, Liblice, pp. 17–20.
Ellenberg, H., Weber, H.E., Düll, R., Wirth, V., Werner, W., Paulißen, D., 1992. Zeigerwerte von Pflanzen in Mitteleuropa. Scripta Geobot. 18, 1–248.
Falkengren-Grerup, U., Diekmann, M., 2003. Use of a gradient of N-deposition to calculate effect-related soil and vegetation measures in deciduous forests. For. Ecol. Manag. 180, 113–124.
Ferretti, M., Fischer, R., Mues, V., Granke, O., Lorenz, M., 2010. Basic design principles for the ICP Forests Monitoring Networks. Manual Part II, in: Manual on Methods and Criteria for Harmonized Sampling, Assessment, Monitoring and Analysis of the Effects of Air Pollution on Forests. UNECE ICP Forests Programme Co-ordinating Centre, Hamburg, ISBN 978-3-926302-03-1, pp. 22. http://www.icp-forest.org/Manual.htm.
Fromont, M., Laurent, B., 2006. Adaptive goodness-of-fit tests in a density model. Ann. Stat. 34, 680–720.
Fromont, M., Laurent, B., Reynaud-Bouret, P., 2011. Adaptive tests of homogeneity for a Poisson process. Ann. Inst. Henri Poincare-Probab. Stat. 47, 176–213.
Galloway, J.N., Aber, J.D., Erisman, J.W., Seitzinger, S.P., Howarth, R.W., Cowling, E.B., Cosby, B.J., 2003. The nitrogen cascade. BioScience 53, 341–356.
Galloway, J.N., Townsend, A.R., Erisman, J.W., Bekunda, M., Cai, Z., Freney, J.R., Martinelli, L.A., Seitzinger, S.P., Sutton, M.A., 2008. Transformation of the nitrogen cycle: recent trends, questions, and potential solutions. Science 320, 889–892.
Gardiner, E.S., Löf, M., O'Brien, J.J., Stanturf, J.A., Madsen, P., 2009. Photosynthetic characteristics of Fagus sylvatica and Quercus robur established for stand conversion from Picea abies. For. Ecol. Manag. 258, 868–878.
Ge, Z., Zhou, X., Kellomaki, S., Wang, K., Peltola, H., Vaisanen, H., Strandman, H., 2010. Effects of changing climate on water and nitrogen availability with implications on the productivity of Norway spruce stands in Southern Finland. Ecol. Model. 221, 1731–1743.
Gilliam, F.S., 2006. Response of the herbaceous layer of forest ecosystems to excess nitrogen deposition. J. Ecol. 94, 1176–1191.
Guo, P., Jiang, H., Yu, S., Ma, Y., Dou, R., Song, X., 2010. Comparison of Litter Decomposition of Six Species of Coniferous and Broad-leaved Trees in Subtropical China. Chin J. Appl. Environ. Biol. 2009, 655–659.
Guntinas, M.E., Leiros, M.C., Trasar-Cepeda, C., Gil-Sotres, F., 2012. Effects of moisture and temperature on net soil nitrogen mineralization A laboratory study. Eur. J. Soil Biol. 48, 73–80.
Hagen-Thorn, A., Varnagiryte, I., Nihlgard, B., Armolaitis, K., 2006. Autumn nutrient resorption and losses in four deciduous forest tree species. For. Ecol. Manag. 228, 33–39.
Hettelingh, J.P., Posch, M., de Smet, P.A.M., 2001. Multi-effect critical loads used in multi-pollutant reduction agreements in Europe. Water Air Soil Pollut. 130, 1133–1138.
Houle, D., Ouimet, R., Paquin, R., Laflamme, J.G., 1999. Interactions of atmospheric deposition with a mixed hardwood and a coniferous forest canopy at the Lake Clair Watershed (Duchesnay Quebec). Can. J. For. Res. 29, 1944–1957.
Iversen, T., 1993. Modelled and measured transboundary acidifying pollution in Europe – verification and trends. Atmos. Environ. 27, 889–920.
Janssen, P.H.M., Heuberger, P.S.C., 1995. Calibration of process-oriented models. Ecol. Model. 83, 55–66.
Jonard, M., Legout, A., Nicolas, M., Dambrine, E., Nys, C., Ulrich, E., van der Perre, R., Ponette, Q., 2012. Deterioration of Norway spruce vitality despite a sharp decline in acid deposition: a long-term integrated perspective. Glob. Change Biol. 18, 711–725.
Jönsson, C., Warfvinge, P., Sverdrup, H., 1995. Application of the safe model to the Solling spruce site. Ecol. Model. 83, 85–96.
Krupa, S.V., 2003. Effects of atmospheric ammonia (NH3) on terrestrial vegetation: a review. Environ. Pollut. 124, 179–221.
Legout, A., Nys, C., Picard, J.-F., Turpault, M.P., Dambrine, E., 2009. Effects of storm Lothar (1999) on the chemical composition of soil solutions and on herbaceous cover humus and soils (Fougères, France). For. Ecol. Manag. 257, 800–811.
Lovett, G.M., Lindberg, S.E., 1993. Atmospheric deposition and canopy interactions of nitrogen in forests. Can. J. For. Res. 23, 1603–1616.
Moncoulon, D., Probst, A., Martinson, L., 2007. Modeling acidification recovery on threatened ecosystems: application to the evaluation of the Gothenburg protocol in France. Water, Air, and Soil Pollut. 7, 307–316 Focus.
Moore, P.T., Van Miegroet, H., Nicholas, N.S., 2007. Relative role of understory and overstory in carbon and nitrogen cycling in a southern appalachian spruce-fir forest. Can. J. For. Res. 37, 2689–2700.
Pardé, J., 1963. Une méthode rapide de cubage approché des peuplements forestiers équiennes. Rev. For. Fr. 8–9, 714–720.
Party, J.P., 1999. Acidification des sols et des eaux de surface des écosystèmes forestiers français: facteurs, mécanismes et tendances (Thesis). Louis Pasteur University, Strasbourg, France.
Pascaud, A., 2013. Déterminants des évolutions spatio-temporelles des retombées atmosphériques acidifiantes et eutrophisantes en France et élaboration d'un modèle de projection (Thesis). Mines Douai School/ University of Lille 1, France.
Perc, M., Gomez-Gardenes, J., Szolnoki, A., Floria, L.M., Moreno, Y., 2013. Evolutionary ydnamics of group interactions on structured populations: a review. J. R. Soc. Interface 10, 20120997.
Persson, H.A., Stadenberg, I., 2010. Fine root dynamics in a Norway spruce forest (Picea abies (L.) Karst) in eastern Sweden. Plant Soil 330, 329–344.
Ponette, Q., Ulrich, E., Brêthes, A., Bonneau, M., Lanier, M., 1997. RENECOFOR – Chimie des sols dans les 102 peuplements du réseau, campagne de mesures 1993/95. Office National des Forêts, Département des Recherches Techniques (eds), ISBN 2-84207-100, Fontainebleau.
Prescott, C.E., Zabek, L.M., Staley, C.L., Kabzems, R., 2000. Decomposition of broadleaf and needle litter in forests of British Columbia: influences of litter type, forest type, and litter mixtures. Can. J. For. Res. 30, 1742–1750.
Probst, A., Dambrine, E., Viville, D., Fritz, B., 1990. Influence of acid atmospheric inputs on surface-water chemistry and mineral fluxes in a declining spruce stand within a small granitic catchment (Vosges Massif, France). J. Hydrol. 116, 101–124.
Probst, A., Fritz, B., Viville, D., 1995. Midterm trends in acid precipitation, streamwater chemistry and element budgets in the Strengbach catchment (Vosges Mountains France). Water Air Soil Pollut. 79, 39–59.
Probst, A., Viville, D., Fritz, B., Ambroise, B., Dambrine, E., 1992. Hydrochemical budgets of a small forested granitic catchment exposed to acid deposition - the Strengbach catchment case-study (Vosges Massif France). Water Air Soil Pollut. 62, 337–347.
Quintana-Segui, P., Le Moigne, P., Durand, Y., Martin, E., Habets, F., Baillon, M., Canellas, C., Franchisteguy, L., Morel, S., 2008. Analysis of near-surface atmospheric variables: validation of the SAFRAN analysis over France. J. Appl. Meteorol. Climatol. 47, 92–107.
Rosén, K., Lundmark-Thelin, A., 1987. Increased nitrogen leaching under piles of slash—a consequence of modern forest harvesting techniques. Scand. J. For. Res. 2, 21–29.
Rosengren, U., Stjernquist, I., 2004. Gå på djupet! Om rotdjup och rotproduktion i olika skogstyper. SUFOR Report. ISBN 91-576-6617-2.
Rustad, L.E., Campbell, J.L., Marion, G.M., Norby, R.J., Mitchell, M.J., Hartley, A.E., Cornelissen, J.H.C., Gurevitch, J., 2001. A meta-analysis of the response of soil respiration, net nitrogen mineralization, and aboveground plant growth to experimental ecosystem warming. Oecologia 126, 543–562.
Sariyildiz, T., Anderson, J.M., 2005. Variation in the chemical composition of green leaves and leaf litters from three deciduous tree species growing on different soil types. For. Ecol. Manag. 210, 303–319.
Schöpp, W., Posch, M., Mylona, S., Johansson, M., 2003. Long-term development of acid deposition (1880–2030) in sensitive freshwater regions in Europe. Hydrol. Earth Syst. Sci. 7, 436–446.
Serengil, Y., Augustaitis, A., Bytnerowicz, A., Grulke, N., Kozovitz, A.R., Matyssek, R., Mueller-Starck, G., Schaub, M., Wieser, G., Coskun, A.A., Paoletti, E., 2011. Adaptation of forest ecosystems to air pollution and climate change: a global assessment on research priorities. Iforest-Biogeosci. Forest. 4, 44–48.
Spranger, T., Hettelingh, J.P., Slootweg, J., Posch, M., 2008. Modelling and mapping long-term risks due to reactive nitrogen effects: an overview of LRTAP convention activities. Environ. Pollut. 154, 482–487.
Stevens, C.J., Dise, N.B., Mountford, J.O., Gowing, D.J., 2004. Impact of nitrogen deposition on the species richness of grasslands. Science 303, 1876–1879.
Sverdrup, H., Warfvinge, P., 1988. Weathering of primary silicate minerals in the natural soil environment in relation to a chemical weathering model. Water Air Soil Pollut. 38, 378–408.
Swart, R., 2004. A good climate for clean air: Linkages between climate change and air pollution – an editorial essay. Clim. Change 66, 263–269.
Tatarinov, F., Urban, J., Cermak, J., 2008. Application of clump technique for root system studies of Quercus robur and Fraxinus excelsior. For. Ecol. Manag. 255, 495–505.
Ulrich, E., Lanier, M., 1996. Notice de présentation du Réseau National de suivi à long terme des écosystèmes forestiers. Office National des Forêts, Département des Recherches Techniques (eds), ISBN 2–84207-021–6, Fontainebleau. Ulrich, E., Lanier, M., Combes, D., 1998. RENECOFOR–Dépôts atmosphériques,
concentrations dans les brouillards et les solutions du sol (sous-réseau CATAENAT). Office National des Forêts (ed.), Département des Recherches Techniques.
UNECE, 2004. Manual on methodologies and criteria for modelling and mapping critical loads and levels and air pollution effects, risks and trends, Federal Environmental Angency (Umweltbundesamt). Mapping Manual 2004. UNECE
Convention on Long-range Transboundary Air Pollution, ICP Modelling and Mapping, Berlin. URL http://icpmapping.org/cms/zeigeBereich/5/manua-l_und_downloads.html.
UNECE, 2005. Convention on Long-range Transboundary Air Pollution - Air Pollution - Environmental Policy – UNECE [WWW Document]. URLhttp:// www.unece.org/env/lrtap(accessed 4.18.13.).
Vanclay, J.K., Skovsgaard, J.P., 1997. Evaluating forest growth models. Ecol. Model. 98, 1–12.
Van der Heijden, G., Legout, A., Nicolas, M., Ulrich, E., Johnson, D.W., Dambrine, E., 2011. Long-term sustainability of forest ecosystems on sandstone in the Vosges mountains (France) facing atmospheric deposition and silvicultural change. For. Ecol. Manag. 261, 730–740.
Van Dobben, H., de Vries, W., 2010. Relation between forest vegetation: atmospheric deposition and site conditions at regional and European scales. Environ. Pollut. 158, 921–933.
Van Harmelen, T., Bakker, J., de Vries, B., van Vuuren, D., den Elzen, M., Mayerhofer, P., 2002. Long-term reductions in costs of controlling regional air pollution in Europe due to climate policy. Environ. Sci. Policy 5, 349–365.
Wallman, P., Svensson, M.G.E., Sverdrup, H., Belyazid, S., 2005. ForSAFE – an integrated process-oriented forest model for long-term sustainability assess-ments. For. Ecol. Manage 207, 19–36.
Wamelink, G.W.W., Wieggers, H.J.J., Reinds, G.J., Kros, J., Mol-Dijkstra, J.P., van Oijen, M., de Vries, W., 2009. Modelling impacts of changes in carbon dioxide concentration: climate and nitrogen deposition on carbon sequestration by European forests and forest soils. For. Ecol. Manag. 258, 1794–1805.
Warfvinge, P., Falkengrengrerup, U., Sverdrup, H., Andersen, B., 1993. Modeling Long-term cation supply in acidified forest stands. Environ. Pollut. 80, 209–221.
Warfvinge, P., Sverdrup, H., 1995. Critical Loads of Acidity to Swedish Forest Soils – Methods, Data and Results. Reports in Ecology and Environmental Engineering. Dpt of Chemical Engineering II, Lund University, Lund.
Weemstra, M., Eilmann, B., Sass-Klaassen, U.G.W., Sterck, F.J., 2013. Summer droughts limit tree growth across 10 temperate species on a productive forest site. For. Ecol. Manag. 306, 142–149.
Yamada, T., Takenaka, C., Yoshinaga, S., Hirai, K., 2013. Long-term changes in the chemical properties of Japanese cedar (Cryptomeria japonica) forest soils under high precipitation in southwest Japan. J. For. Res. 18, 466–474.
Žaltauskait _e, J., Juknys, R., 2007. Atmospheric deposition and canopy interactions in urban scots pine forest. Baltimore For. 13, 68–73.