Science Arts & Métiers (SAM)
is an open access repository that collects the work of Arts et Métiers Institute of Technology researchers and makes it freely available over the web where possible.
This is an author-deposited version published in: https://sam.ensam.eu Handle ID: .http://hdl.handle.net/10985/17001
To cite this version :
Cyril NICOLAS, Cyrille BAUDOUIN, Stéphane LELEU, Mihaela TEODORESCU - Dimensional control strategy and products distortions identification - International Journal of Material
Forming(Proceedings of the 11th ESAFORM Conference on Material Forming, Lyon (France), 23-25 April 2008) - Vol. 1, n°Supplement 1, p.1039-1042 - 2008
Any correspondence concerning this service should be sent to the repository Administrator : [email protected]
1 INTRODUCTION
Our work is focussed on heat treatment process which is used to improve product mechanical properties (e.g. hardness, strength). These heat treatments may cause undesirable dimensional changes. Finishing operations are then needed; hence distortions control could help minimizing the rise in cost. Distortions prediction is however complex because depending on many parameters (thermo mechanical, metallurgical), which are, mostly, experimentally estimated.
In this paper, we propose a distortions control strategy using metrological and simulation analyses. The first part reviews some literature methods to identify heat treatments distortions. Then, we introduce our method with data processing coming from measurements and simulations. The third part presents first results for an ASCOMETAL steel grade.
2 DISTORTIONS IDENTIFICATION METHOD
2.1 Existing methods
Within the framework of heat treatments, two main and complementary approaches are found in the literature.
2.1.a Deductive approach
It consists in checking distortions predictive models via experimentations and simulations. A knowledge based system could be used [1]. Distortions are quantified on parts families for which are associated potential distortions (e.g. banana effect) and distortions generating factors such as part geometry, metallurgical properties, place in the furnace, cooling fluid characteristics. One can also find other foretelling models using these distortions factors but individually considered; as the part geometry [2] for which a correlation method was developed.
However, finite element models (f.e.m.) are the most used because they help us to understand distortions origin through metallurgical and thermo mechanical phenomena analyses. Like all numerical models, the results accuracy greatly depends on the quality of the input data. In addition to simulation based approach, it is thus necessary to perform experiments to corroborate preliminary results. In that way, distortions simulation accuracy was
improved on carburizing-quenching gear by
experimentally determining materials thermal
ABSTRACT: Heat treatments could create local or global distortions on workpieces. Finishing operations, often costly, are then necessary to respect the required functional tolerances. In the long term, our objective is to optimize first, steel grade and heat treatment, then to adjust the numerical simulation models. In that way, the heat treatment distortions on C-ring test parts obtained for an ASCOMETAL steel grade, vertically gas quenched are qualified and quantified by a dimensional analysis. In this article, we focus on part measurement and data processing strategies. Then we present an approach to correlate the experimental results with simulations ones.
Key words: Distortions, Heat treatments, Metrology, Dimensional analysis, Numerical simulation
Dimensional control strategy and products distortions identification
C. Nicolas
1, C. Baudouin
1, S. Leleu
2, M. Teodorescu
3, R. Bigot
11
Laboratoire de Génie Industriel et Production Mécanique (LGIPM – IFAB)
Ecole Nationale Supérieure d’Arts et Métiers - C.E.R de Metz - 4, rue Augustin Fresnel - 57078 Metz Cedex3
http://www.metz.ensam.fr/ {cyril.nicolas, cyrille.baudouin, regis.bigot}@metz.ensam.fr;
2
Laboratoire de Métrologie et Mathématiques Appliquées (L2MA)
Ecole Nationale Supérieure d’Arts et Métiers - C.E.R de Lille - 8, boulevard Louis XIV - 59046 Lille Cedex
http://www.lille.ensam.fr/ [email protected];
3
ASCOMETAL CREAS - BP 70045 - 57301 - Hagondange Cedex
properties [3].
2.1.b Inductive approach
It consists in proposing models to identify distortions coming from experiment, mainly from metrology. So, we need to define the number and distribution of points so that significant surfaces for the optimization criterion would be measured with the smallest possible loss of information [4]. The number of points is subject to part size, tolerance specifications and measurement uncertainty. The theoretical smallest sampling size can be used for ideal geometric shape identification. But, if the form deviation is unknown (that is our case), we have to increase the sampling size so that estimated value of the measurement converges to the “true” value of form error [5]. As for points distribution, for not creating local weighting disturbing the optimization method, it is important to dispose them uniformly. Next, we need an optimization criterion to resolve this “data-overabundant” system. In our case of warped surfaces identification, a point-per-point comparison between measured and theoretical geometry is needed [6]. We chose the least squares criterion because it gives a very stable result and is less sensitive to asperities effects [7].
2.2 Developed method
2.2.a Introducing C-ring test part
The C-ring type sample is currently used because its geometry allows us to amplify distortion which is suitable for the metrological analysis [8] [9]. We use a 100 mm long C-ring with a 16 mm wide opening. Outer and inner cylinders (respectively Ø70 and Ø45 mm) are 11 mm off-centered. These dimensions authorize thermocouples without disturbing thermal flow; they minimize side effects and allow obtaining required cooling velocity [10].
First, a metrological analysis occurs at three manufacturing states: after machining, after stress relieving and after high pressure gas quench. Then, we present a method to correlate C-ring measured mesh with f.e.m. one in order to compare simulate distortions field with measurement’s one.
2.2.b Experiment approach
Measurement strategy
In order to characterise the distortions significant types, we define a fine mesh for the C-ring. We keep in mind that many measurement points may increase the appearance of abnormal points but we could detect them via a graphic interface (see section 3).
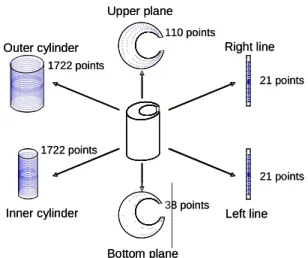
Points are evenly distributed on all surfaces (figure 1), but not on the putting plane (bottom one).
Upper plane Outer cylinder Inner cylinder Bottom plane Right line Left line 38 points 110 points 21 points 21 points 1722 points 1722 points Upper plane Outer cylinder Inner cylinder Bottom plane Right line Left line 38 points 110 points 21 points 21 points 1722 points 1722 points
Fig. 1.Fine mesh for points probing Data processing strategy
Our mathematic approach is to optimize, for each point i, the measure error εi between theoretical
point Ti and measured point Mi, orthogonally
projected onto theoretical normal Ni (equation (1)).
( )
(
1)
. : j , i , frame reference In 1 = Ν Ν ΟΜ − ΟΤ = = Ο i i i i i n i withε
ε
ε
ε
ε
M M r r r (1)We also define the matrix Mph of optimization
phenomena (equation (2)). Its scalars correspond to
the phenomena elementary amplitude effect (ePhnj)
on the theoretical points written in column. The description unit of phenomena would be close to their estimated value, so the millimetre.
y y x x mm y x y x j j j j n j ph n n j j . . e . . e 1 with e e e e e e e e e Ph j y j x n n j n 1 n 1 1 T T Ph Ty Tx Ph Ty Tx Ph Ty Tx 1 n Ν = Ν Τ = Ν = Ν Τ = = Τ = Τ ΟΤ ΟΤ ΟΤ Τ Τ = Μ K M K M M M K M K M M M K K (2)
To dissociate phenomena, those must be
mathematically independent and linearly
superimposable. In metrology, the size order of the defects is often small compared with nominal dimensions of the measured part and so, we will use the small displacements assumption.
Finally, equation (3) gives the residual r to minimize using the least square criteria thanks to any solver.
) n Ph ..., , i Ph ( phenomena s distortion and nts displaceme t significan of n) ..., c, b, (a, quantities elementary with Ph . ... Ph . 2 Ph . 1 Ph . b c i n n a r=
ε
− − − − − (3) Experimental deviceOur coordinate measuring machine (CMM) has an indication error for length measurement defined by E=(3.5+L/350)µm, L in mm. C-ring Extension bar Star stylus TP20 probe Positioning device
Fig. 2. Experimental control device
We use a dynamic probe (TP20) with a star stylus and an extension bar (figure 2). Combined with probe head rotations, we can access all surfaces. But, even with rotations, we do not obtain a uniform distribution of points for the inner cylinder. We thus checked the accuracy of our device compared with a single TP20 probe (without extension bar and star stylus) in measuring a 44.99mm standard ring (table1). To succeed, we optimize the 108 points of CMM with Tx-Ty and dilatation vectors.
Table1. CMM measurements of a standard ring diameter
Values in mm Single TP20 Our TP20 device
Diameter 44.989 44.989
Range 0.006 0.005
2.2.c Processing of finite element simulation
We use Forge 2005 software to make 3D-quench simulations for which the input data are partly experimentally determined (the phase transformation kinetics, the heat transfer coefficient) and partly from the literature (the mechanical data) [12].
Data processing strategy
For a direct comparison between experimental and simulation results, we use the method previously presented. For instance, this method is applied for only the cylinders. By using “2D-cutting planes”, we export sections’ boundary geometry at the same heights as for CMM measured C-ring. However, we must keep in mind that CMM measurement points are obtained by probing the surface following the theoretical normals. But during simulation, nodes move on all directions. So, we have to find the
intersection point S12 between theoretical normals T1
and finite element frontier (S1S2).
Fig. 3. Intersection point S12 between (S1S2) and D lines Uncertainty due to the method
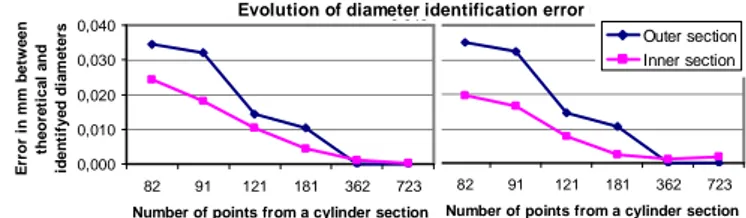
The method generates a quantifiable error εs due to
the linear approximation between two consecutive nodes of the finite element frontier (figure 3). To minimise this error, we look for the 2 simulation points (S1 and S2) whose angular coordinates are as
close as possible to theoretical point (T1) ones. In
figure 4, we show that higher is the sampling size; higher is the accuracy. This last also increase when the diameter size is smaller for the same sampling size.
Evolution of diameter identification error Evolution of diameter identification error
0,000 0,010 0,020 0,030 0,040 82 91 121 181 362 723
Number of points from a cylinder section
0,000 0,010 0,020 0,030 0,040 82 91 121 181 362 723
Number of points from a cylinder section
E rr o r in m m b e tw e e n th e o re ti c a l a n d id e n ti fy e d d ia m e te rs Outer section Inner section
Case 1: Simulation nodes are theoretical Case 2: Simulation nodes are theoretical
points of outer and inner diameters points of dilated diameters (0.5mm)
Fig. 4. Uncertainty due to data processing of simulation points Initial geometry for quench simulation
We must take into account C-ring dilation due to heating (at 930 °C). We consider for the studied steel grade a linear dilatation value of 22.3 µm/m/°C in austenitic phase. Then, we create the same mesh as for experimental analysis, consisting of 98 sections with 400 nodes for each cylinder’s perimeter. This fine mesh aims to minimize the uncertainty of our method.
3 FIRST RESULTS
A software based on the described method was developed. Thus, numerical and 3D-identification of distortions phenomena can be calculated. For a better visual understanding, a scale factor is applied on the errors onto the theoretical normals (figure 5). Theses measure errors include displacements phenomena, like translations, rotations and off-centring of the inner diameter (due to machining). By deleting them, we did what is often called best
fit, to better visualize distortion and to write their
3D-mathematical expression (figure 6). Measured part grade 1, at 20°C
Scale factor: 50 Theoretical points Quenched points
Simulated part grade 1, at 20°C
Pincers’ opening
Fig. 5. Graphic comparison of best-fitted quenched geometries All phenomena have physical origins, as the pincers’ opening which comes from a gradient of thermal stresses induced by the thickness and temperature gradients and the steel phase transformations.
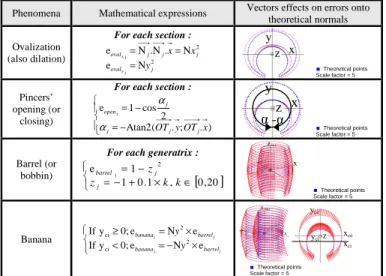
Phenomena Mathematical expressions Vectors effects on errors onto theoretical normals
Ovalization (also dilation)
For each section :
2 2 j y j x e . . e j oval j j j oval y x x Ν = Ν = Ν Ν = x y z Theoretical points Scale factor = 5 Pincers’ opening (or closing)
For each section :
− = − = ) . ; . ( Atan2 2 cos 1 e j x OT y OTj j j j open α α y x z α-α Theoretical points Scale factor = 5 Barrel (or bobbin)
For each generatrix :
[ ] ∈ × + − = =1 0−.1 , 0,20 1 e j 2 k k z z j j barrel x z Theoretical points Scale factor = 5 Banana × Ν − = < × Ν = ≥ j j j j e e 0; y If e e 0; y If 2 ci 2 ci barrel banana barrel banana y y z x z xce xci yce yci Theoretical points Scale factor = 5
Fig. 6. Linear and independent 3D-distortion phenomena A comparison between experimental and simulation results (figure 7) show that distortions values of the outer cylinder are greater than inner ones (except for barrel effect). Pincers’ opening is the most important phenomenon in experiment just as barrel and banana effects in simulation. -0,2 -0,1 0,0 0,1 0,2 0,3 0,4 0,5 0,6 E le m e n ta ry q u a n ti ti e s i n m m Inner cylinder Outer cylinder
Exp. Simu. Exp. Simu. Exp. Simu. Exp. Simu. Exp. Simu.
X-Ovalization Y-Ovalization Pincers' opening Barrel Banana
Fig. 7. Results for 3D-distortions identification from experiment and simulation
The chosen vectors for phenomena explain the main distortions as the final residual is small (figure 8).
0 20 40 60 80 100 Initial Tx, Ty, Rx, Ry, Rz + x,y Off-centring +Pincers' opening + Barrel + x,y ovalization + Banana R e s id u a l in p e rc e n t Measured part Simulated part
Fig. 8. Residual evolution in function of cumulated phenomena
4 CONCLUSIONS
We developed a method for identifying distortions based on the optimisation of the measure errors by the mean of distortions significant phenomena. In this first approach, tendencies of these phenomena are quite the same in experiment and simulation but we have to refine input data of the models for a better quantitative evaluation. Further work will focus on many experiments and on simulations including mechanical experimental data.
REFERENCES
1. P. Lamesle, E. Vareilles and M. Aldanondo, Towards a
KBS for a Qualitative Distortion Prediction for Heat Treatments, In: Proc. 1st Int. Conference on Distortion Engineering, Bremen (2005) 39-47.
2. C. Andersch, M. Ehlers, F. Hoffmann and H.-W. Zoch,
‘Systematic Analysis of the Relation between Part Geometry and Distortion due to Heat Treatment’, Mat.-wiss. u. Werkstofftech., 37, (2006) 23-28.
3. R. Mukai and D.-Y. Ju, ‘Simulation of
Carburizing-Quenching of a Gear. Effect of Carbon Content on Residual Stresses and Distortion’, Journal de Physique IV, 120, (2004) 489-497.
4. A. Weckenmann and M. Knauer, The Influence of
Measurement Strategy on the Uncertainty of CMM-Measurements, Annals of the CIRP, 47, (1998) 451-454.
5. G. Lee, J. Mou and Y. Shen, ‘Sampling Strategy Design
for Dimensional Measurement of Geometric Features Using Coordinate Measuring Machine’, Int. Journal of Machine Tools and Manufacture, 37, (1997) 917-934.
6. C. Baudouin, R. Bigot, S. Leleu and P. Martin, ‘Gear
Geometric Control Software: Approach by Entities’, Int. Journal of Advanced Manufacturing Technology, 2007.
7. H.T. Yau and C.H. Menq, ‘A Unified Least-Squares
Approach to the Evaluation of Geometric Errors using Discrete Measurement Data’, Int. Journal of Machine Tools and Manufacture, 36, (1996) 1269-1290.
8. R.A. Hardin and C. Beckermann, Simulation of Heat
Treatment Distortion, In: Proc. 59th Technical and
Operating Conference, Chicago, (2005).
9. Z. li, B.L. Ferguson, X. Sun and P. Bauerle, ‘Experiment
and Simulation of Heat Treatment Results of C-Ring Test Specimen’, In: Proc. 23rd ASM Heat Treating Society Conference, Pittsburgh, (2005) 245-252.
10. M. Teodorescu, J. Demurger and J. Wendenbaum,
Comprehension of Cooling Distortion Mechanisms by the mean of F.E. Simulation, In: Proc. 15th IFHTFE, Vienne, (2006).