Université de Montréal
Quantification of Ventricular Mechanical Dyssynchrony
under Stress
Par
Samaneh Salimian
Sciences biomédicales Faculté de médecine
Thèse présentée en vue de l’obtention du grade de doctorat en sciences biomédicales
Option général
Juillet, 2016
Résumé
L'évaluation de l'asynchronisme mécanique ventriculaire sous stress a soulevé une attention importante en tant que facteur prédictif de la réponse au traitement de resynchronisation cardiaque (CRT). De plus, il semble exister une relation significative entre le devenir du patient et la présence d’asynchronisme au repos. Plusieurs méthodes échocardiographiques peuvent être utilisées pour évaluer l’asynchronisme. Cependant, parmi toutes les différentes méthodologies ou index existant dans ce domaine, aucun critère ne fait l’unanimité. Cette thèse étudie l'importance des techniques d'imagerie nucléaire dans le cadre de l’évaluation de l’asynchronisme cardiaque induit par le stress en utilisant trois différents modèles canins expérimentaux.
Le premier chapitre vise à examiner les effets du stress sur le synchronisme de la contraction du ventricule gauche (VG) en utilisant l'imagerie synchronisée de perfusion myocardique dans une cohorte canine normale. Le stress a été induit par différents niveaux d’infusion de dobutamine sur six sujets sains. Les paramètres hémodynamiques et l’asynchronisme ont été évalués par des mesures de pressions ventriculaires. L'analyse de phase sur l’imagerie s’est effectuée en utilisant un logiciel commercialement disponible (QGS) et un logiciel interne (MHI4MPI), basée sur le déplacement et l’épaississement des parois ventriculaires. L’augmentation de la concentration de dobutamine a démontré une amélioration de la capacité fonctionnelle et une réduction de l’asynchronisme ventriculaire. L’analyse de l’asynchronisme calculée à partir de l’épaississement de la paroi semble plus robuste et plus sensible que l’utilisation du déplacement des parois. (Salimian et. al., J Nucl Cardiol., 2014)
Le second chapitre étudie les différents paramètres d’asynchronisme au repos et à différents niveaux de stress dans un modèle de cardiomyopathie dilatée et à QRS étroit. Ce modèle a été créé sur dix chiens par tachycardie via stimulation de l'apex du ventricule droit pendant 3-4 semaines, permettant d’atteindre une fraction d'éjection cible de 35% ou moins. Le stress a ensuite été induit par une perfusion de dobutamine jusqu'à un maximum de 20
μg/kg/min. Les données hémodynamiques et l’asynchronisme ont été analysés par des mesures de pression ventriculaire et l’analyse de l’imagerie dynamique du compartiment sanguin. L’importante variabilité individuelle des sujets inclus dans notre cohorte empêche toute conclusion définitive sur la mesure de l’asynchronisme interventriculaire. Cependant, les différents niveaux de stress, même dans des intervalles rapprochés, ont démontré un effet significatif sur les paramètres hémodynamiques et l’asynchronisme. (Salimian et. al., J Nucl Cardiol., 2015)
La troisième section vise à déterminer si l’estimation du mode de stimulation optimal effectuée au repos demeure le choix optimal lorsque le niveau d’activité cardiaque s’intensifie pour des sujets avec bloc auriculo-ventriculaire (AV) et fonction ventriculaire normale. Cinq chiens ont été soumis à une ablation du nœud AV et des sondes de stimulation ont été insérées dans l'oreillette droite pour la détection, l’apex du ventricule droit (VD) et une veine postérolatérale du VG pour la stimulation. Cinq modes de stimulation ont été utilisés : LV pur, biventriculaire (BiV) avec activation de 20 ms du LV (LVRV20), BiV pur, BiV avec pré-activation de 20 ms du VD (RVLV20), VD pur. Des niveaux jusqu’à 20 μg/kg/min de dobutamine ont été atteints. Le stress a modifié l’étendue de l’asynchronisme de base et ce, pour tous les modes de stimulation. De plus, les effets physiologiques intrinsèques du stress permettent une évaluation plus précise de l’asynchronisme ventriculaire, diminuant la variabilité inter-sujet. Le mode de stimulation LVRV20 semble le mode optimal dans ce modèle, supportant l’utilisation de la stimulation bi-ventriculaire.
Mots-clés: Asynchronisme ventriculaire mécanique, SPECT synchronisée de la perfusion
myocardique, le stress de la dobutamine, SPECT synchronisée du compartiment sanguin, cardiomyopathie dilatée avec QRS étroit, thérapie de resynchronisation cardiaque, contraction homogénéité, bloc auriculo-ventriculaire et la fonction normale.
Abstract
Assessment of ventricular mechanical dyssynchrony (MD) under stress has attracted a large amount of attention as a stronger predictor of response to cardiac resynchronization therapy (CRT) and as a parameter whose variation bears a greater relationship to clinical outcomes than resting-MD either in CRT candidates or another subset of patients. Several echocardiographic methods can be used to assess stress-MD. However, no standardized approach is currently used to explore stress-induced variations in inter- and intraventricular MD. This dissertation studies the importance of nuclear imaging techniques in assessing stress-induced MD variations by providing three different experimental canine models.
The first chapter sought to examine the impacts of stress on the left ventricular (LV) synchrony with phase analysis of gated SPECT myocardial perfusion imaging (GMPS) within a normal canine cohort. Stress was induced by different levels of dobutamine infusion in six healthy subjects. Hemodynamic and LV MD parameters were assessed by LV pressure measurements and phase analysis of GMPS using commercially available QGS software and in-house MHI4MPI software with thickening- and displacement-based methodology. The
increase of dobutamine level was shown to be in accordance with the improvement of LV functional capacity and reduction of MD parameters. MD analysis based on wall thickening was more robust and sensitive than the global wall displacement. (Salimian et. al., J Nucl Cardiol., 2014)
The second chapter investigated the range of difference in inter- and intraventricular MD parameters from rest to various levels of stress in a dilated cardiomyopathy (DCM) and narrow QRS complex model. Ten large dogs were submitted to tachycardia-induced DCM by pacing the right ventricular apex for 3-4 weeks to reach a target ejection fraction of 35% or less. Stress was then induced by infusion of dobutamine up to a maximum of 20 μg/kg/min. Hemodynamic and MD data were analyzed by LV pressure measurements and gated-blood pool SPECT (GBPS) imaging. Individual differences in the magnitude and pattern of change in the various levels of stress precluded any definitive conclusion about interventricular MD. However, different levels of stress, even in close intervals, showed a significant positive
impact on hemodynamic and intraventricular MD parameters. (Salimian et. al., J Nucl Cardiol., 2015)
The third chapter sought to examine if the optimal pacing mode at rest could be the best one during the maximum stress level in terms of MD parameters in subjects with an atrioventricular (AV) block and normal function. Five dogs were submitted to AV node ablation and pacing leads were placed in the right atrium for sensing, in right ventricular (RV) apex, and in posterolateral LV vein for pacing in five modes of LV, biventricular (BiV) with 20 ms of LV pre-activation (LVRV20), BiV, BiV with 20 ms of RV pre-activation (RVLV20) and RV pacing. Stress was induced by dobutamine infusion up to a maximum of 20 μg/kg/min. Data analyses were the same as chapter one. Dobutamine stress changed the extent of resting-LV MD at all pacing modes. Intrinsic physiologic effects of stress resulted in more accurate MD assessment with lesser variability in subjects who underwent pacing. LVRV20 was the preferred site of stimulation in this model rather than single-site pacing.
Keywords: Ventricular mechanical dyssynchrony, gated myocardial perfusion SPECT,
dobutamine stress, gated blood pool SPECT, dilated cardiomyopathy with narrow QRS, cardiac resynchronization therapy, contraction homogeneity, atrioventricular block and normal function.
Table of Contents
Résumé ... i Abstract ... iii Table of Contents ... v List of Tables ... x List of Figures ... xiList of Abbreviations ... xiv
Acknowledgements ... xviii
Introduction ... 1
Clinical motivation ... 1
Normal electrical activation, a window to the artificial pacing ... 2
Ventricular pacing ... 5
Cardiac resynchronization therapy ... 6
Mechanical dyssynchrony (MD) ... 7
A true attempt toward understanding of MD ... 7
MD applications ... 9
Dynamic nature of MD ... 10
Imaging techniques for quantification of MD ... 11
Echocardiography ... 11
Cardiac magnetic resonance imaging ... 11
Nuclear imaging modalities ... 12
SPECT imaging techniques for MD assessment ... 13
Gated SPECT myocardial perfusion imaging ... 14
Gated SPECT acquisition ... 14
Image reconstruction ... 16
Simple Backprojection ... 16
Filtered Backprojection ... 17
Iterative Reconstruction Algorithms ... 17
Reorientation ... 19
Left ventricular segmentation ... 20
Quantitative Gated SPECT (QGS) software ... 21
Left ventricular synchrony parameters (QGS) ... 23
MHI4MPI software ... 26
Fourier analysis ... 30
Left ventricular synchrony parameters ... 33
Gated blood pool SPECT ... 37
Cut-off values for phase analysis parameters ... 38
Stress-induced modalities ... 41
Exercise stress ... 41
Pharmacological stress: dobutamine ... 41
Exercise versus dobutamine stress ... 43
Assessment of dynamic left ventricular dyssynchrony ... 44
Summary ... 47
Organization of thesis: objectives and approaches ... 48
Chapter 1 ... 48 Rational ... 48 Hypotheses ... 49 Specific objectives ... 49 Chapter 2 ... 49 Rational ... 49 Hypothesis ... 50 Specific objectives ... 50 Chapter 3 ... 50 Rational ... 51 Hypothesis ... 51 Specific objectives ... 51 Contribution statement ... 52 Proposed Articles ... 54 Chapter 1 ... 55
The effects of dobutamine stress on cardiac mechanical synchrony determined by phase
analysis of gated SPECT myocardial perfusion imaging in a canine model ... 55
Abstract ... 56
Introduction ... 58
Methods ... 59
General Preparation... 59
Dobutamine GMPS Image Acquisition and Data Processing ... 60
Assessment of Phase Analysis in QGS ... 61
Assessment of Phase Analysis in MHI4MPI ... 61
Statistical Analysis ... 63
Results ... 64
Baseline Assessments ... 64
Functional Effects in Response to Dobutamine Stress ... 64
Phase analysis in QGS via Dobutamine Infusion ... 65
Phase Analysis in MHI4MPI via Dobutamine Infusion ... 66
Discussion ... 67
Limitations ... 70
New knowledge gained ... 71
Conclusion ... 71
References ... 72
Figures ... 76
Tables ... 82
Chapter 2 ... 83
Phase analysis of gated blood pool SPECT for multiple stress testing assessments of ventricular mechanical dyssynchrony in a tachycardia-induced dilated cardiomyopathy canine model ... 83
Abstract ... 84
Introduction ... 86
Methods ... 87
Study Protocol ... 87
GBPS Data Processing and Dyssynchrony Analysis ... 89
Statistical Analysis ... 92
Results ... 93
Effects of Stress on Functional Parameters ... 93
Effects of Stress on Intraventricular Dyssynchrony ... 94
Effects of Stress on Interventricular Dyssynchrony ... 95
Control versus DCM Group ... 95
Discussion ... 96
GBPS for Assessing Stress Dyssynchrony ... 96
Ventricular Dyssynchrony and Narrow QRS... 97
Dobutamine Stress and Ventricular Dyssynchrony ... 98
Limitations ... 99
New knowledge gained ... 100
Conclusion ... 101
References ... 102
Figures ... 106
Tables ... 115
Chapter 3 ... 118
Effect of various modes of ventricular pacing on left ventricular mechanical synchrony under stress as assessed by phase analysis of gated myocardial perfusion SPECT in a canine model of atrioventricular block and normal function. ... 118
Abstract ... 119
Introduction ... 121
Methods ... 122
Study Protocol ... 122
Pacing Protocol ... 123
Dobutamine Stress GMPS Acquisition ... 124
GMPS Data Processing and Phase Analysis ... 125
Statistical Analysis ... 126
Results ... 127
Regional Mechanical Contraction ... 128 Dyssynchrony Parameters ... 129 Discussion ... 131 Limitations ... 135 Conclusion ... 136 References ... 137 Figures ... 141 Tables ... 147
Discussion and Conclusion ... 151 Bibliography ... I
List of Tables
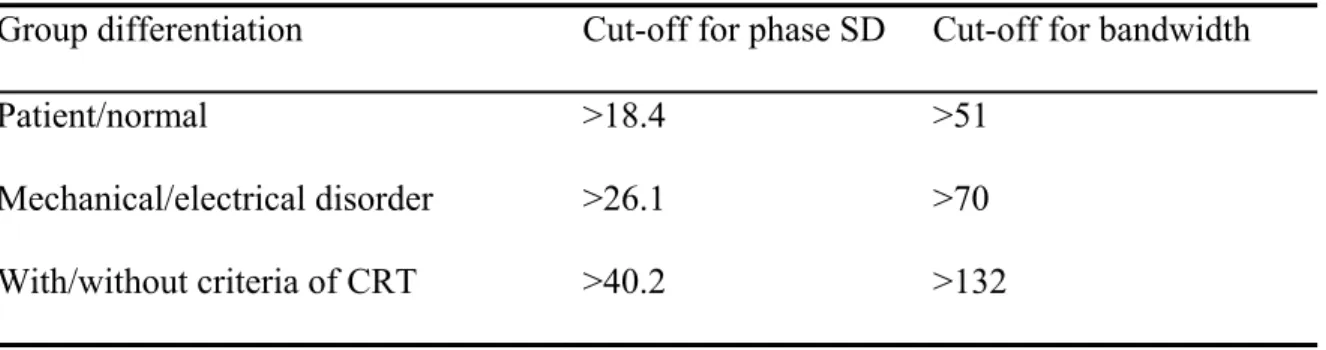
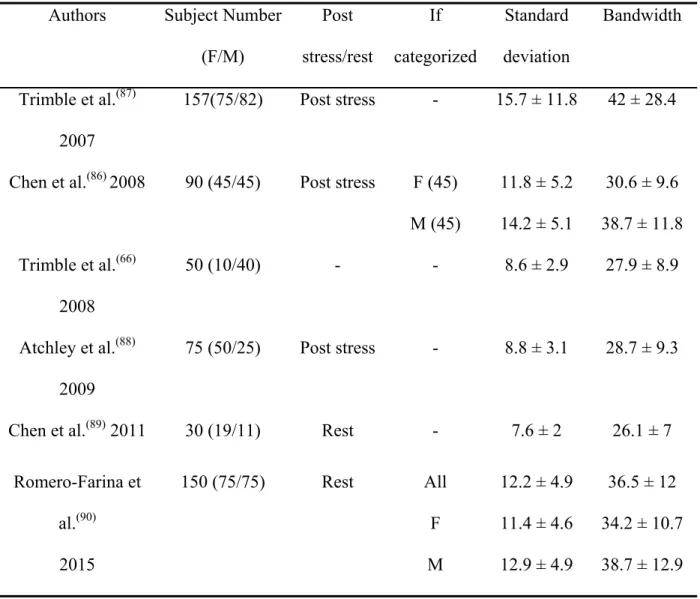
Table 1. Different cut-off values of phase parameters between normal subjects and patients with conduction and mechanical disorders (Romero-Farina et al. 2015). ... 39 Table 2. Mean standard deviation and bandwidth in different control groups derived in
different studies ... 40 Table 1-1: LV functional parameters during rest and levels of dobutamine stress ... 82 Table 2-1: Functional parameters at rest and during levels of dobutamine-induced stress in
DCM dogs ... 115 Table 2-2: Dyssynchrony parameters at rest and during dobutamine-induced stress levels in
DCM vs control dogs ... 116 Table 2-3: Comparison of LV dyssynchrony and functional parameters between DCM and
control dogs. ... 117 Table 3-1: LV hemodynamic parameters in effect of various pacing modes at rest. ... 147 Table 3-2: LV hemodynamic parameters in effect of various pacing modes during
dobutamine-induced stress levels. ... 148 Table 3-3: LV dyssynchrony parameters in effect of various pacing modes at rest. ... 149 Table 3-4: LV dyssynchrony parameters in effect of various pacing modes during dobutamine-induced stress levels. ... 150
List of Figures
Figure 1. Different views of the distribution of the tracer in the left ventricle by cutting through the center of the stacked reconstructed short axis images from different planes
... 20
Figure 2. Three-dimensional display of the endocardial (solid) and epicardial (grid) surfaces calculated by the QGS automatic algorithm (Cedars-Sinai) for a patient at end diastole in septal, apex and inferior views. ... 22
Figure 3. The phase histogram and polarmap display of the GMPS assessed by QGS software. ... 25
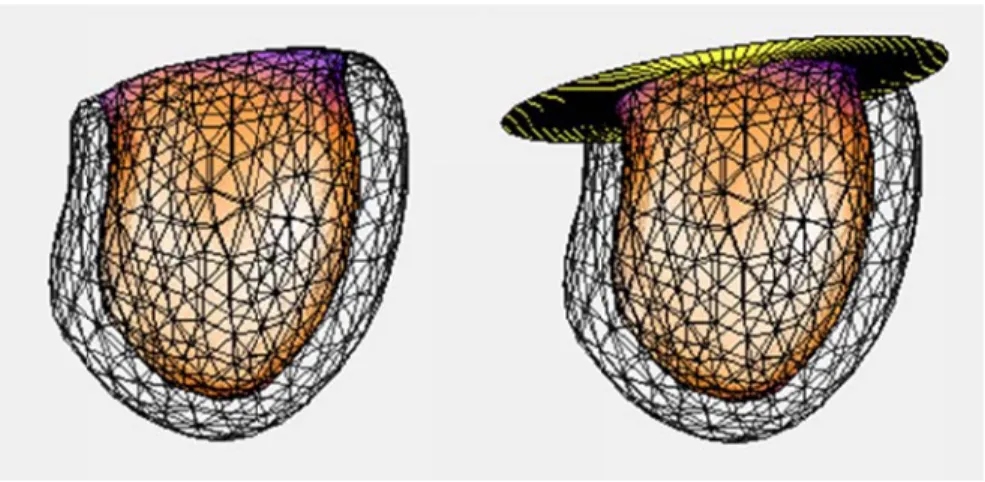
Figure 4. Dynamic mid-myocardial surface of approximately 360 vertices which are linked together making triangular shapes and surface tetrahedrons. ... 27
Figure 5. Dynamic surfaces for the myocardial limits. ... 29
Figure 6. An example of the segmentation process by MHI4MPI algorithm during systole at different views. ... 30
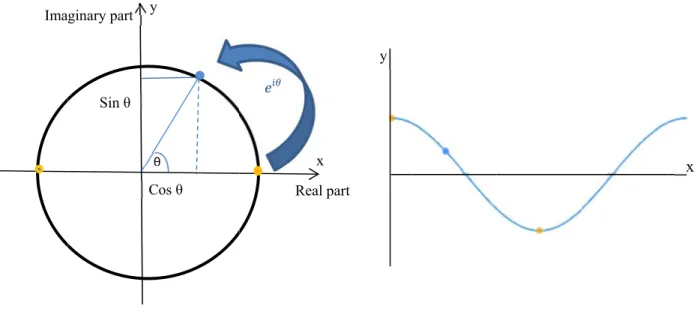
Figure 7. The simulation of the movement of a sinusoidal signal in a circular path. ... 33
Figure 8. Fourier phase analyses of left ventricular thickening signals. ... 34
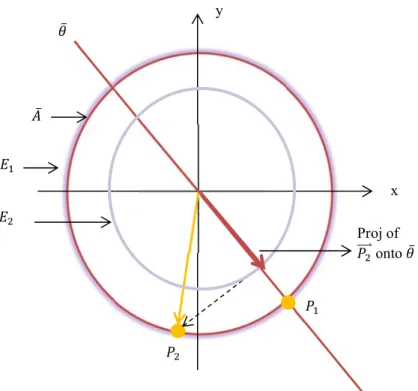
Figure 9. Efficiency concept for signals in a circular path. ... 36
Figure 1-1: An example of the segmentation process by MHI4MPI algorithm during systole and diastole at different axes ... 76
Figure 1-2: The simulation of partial volume effect that leads to a greater decrease in maximum counts (relative intensity) when the myocardium is thinner. ... 76
Figure 1-3: Intensification of mid-myocardial septal and lateral wall through time ... 77
Figure 1-4: Fourier phase analyses of thickening signals. ... 77
Figure 1-5: Hemodynamic effects of dobutamine stress variations of dP/dtmax in (mmHg/s) and contractility index (CI) in (s-1) in response to the dobutamine stress stimulation.... 78
Figure 1-6: Variation of dyssynchrony parameters related to increasing the dobutamine stress level measured by QGS, (bandwidth, mean phase, and SD in degree and entropy in %). ... 79
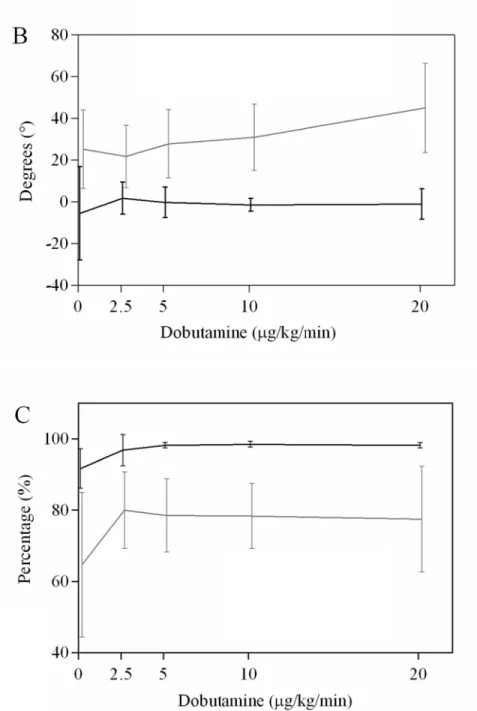
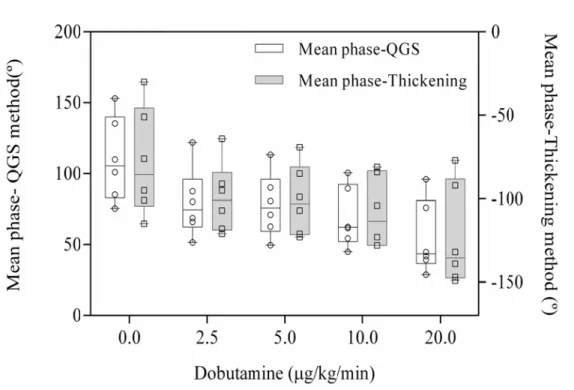
Figure 1-7: Comparison between the thickening- and displacement-based methods for dyssynchrony parameters acquired with MHI4MPI in response to dobutamine stress level increasing ………..…..80 Figure 1-8: Graphical illustration of distribution of the mean phase measured by each of the
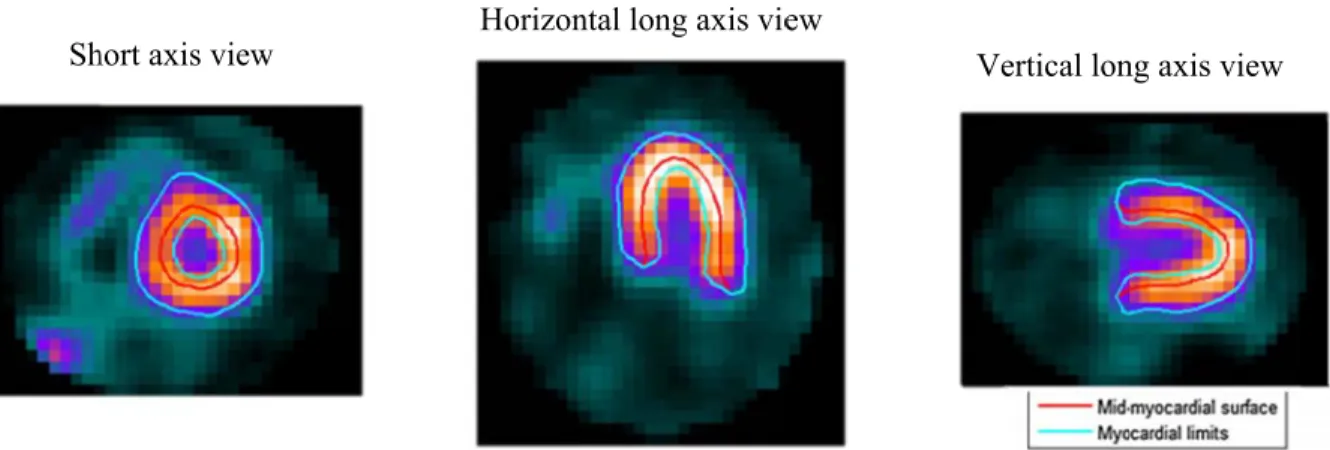
QGS and thickening method. ... 81 Figure 2-1: Illustration of dobutamine stress infusion and GBPS acquisition protocol.. ... 106 Figure 2-2: Illustration of GBPS images in short, horizontal and vertical long axis views,
respectively. ... 107 Figure 2-3: Dynamic surface of approximately 400 vertices over the LV and RV. ... 107 Figure 2-4: Left and right regions of interest in short axis view and related time activity curves
in 16 bins. ... 108 Figure 2-5: Illustration of time-activity curves for different regions of the LV as well as
regional LV ROIs: anterior, lateral, inferior and septal regions in short axis and apex in horizontal long axis view. ... 109 Figure 2-6: Illustration of count-based LV contraction phase in a control dog at baseline (A)
and in a DCM dog at baseline (B) and at 20 μg/kg/min dobutamine level (C) ... 111 Figure 2-7: Left ventricular regional wall phase differences at baseline and at each dobutamine
level. ... 112 Figure 2-8: Illustration of phase, amplitude and efficiency of all vertices in the LV of a DCM
dog as an example in histogram and polarmap displays. ... 113 Figure 2-9: Interventricular mechanical dyssynchrony (RVLV delay) at rest and during
different levels of dobutamine stress. ... 114 Figure 3-1: Variation of contractility index (CI) in effect of various pacing modes at baseline
and different dobutamine stress levels. ... 141 Figure 3-2: Regional LV phase delays from the mean LV phase at baseline (A), levels of 5 (B) and 20 μg/kg/min (C) dobutamine stress in various pacing modes ... 143 Figure 3-3: Thickening-based LV contraction phase of a dog during various pacing
interventions at baseline (A-E) and at 20 μg/kg/min dobutamine (F-J) as an example.. 144 Figure 3-4: Phase analysis of GMPS as assessed by QGS software in a dog, same dog as
during the stimulation through various pacing modes represented by polarmap and phase histograms. ... 146 Figure 3-5: Variation of the amplitude of LV contraction with administration of levels of
List of Abbreviations
AV: AtrioventricularRV: Right ventricle LV: Left ventricle HF: Heart failure
LBBB: Left bundle branch block
CRT: Cardiac resynchronization therapy MD: Mechanical dyssynchrony
MRI: Magnetic Resonance Imaging
SPECT: Single-photon emission computed tomography GBPS: Gated blood pool SPECT
GMPS: Gated myocardial perfusion SPECT PET: Positron emission tomography
MHI: Montreal Heart Institute
CAD: Coronary artery disease FBP: Filtered backprojection ML: Maximum likelihood
OSEM: Ordered-subsets expectation maximization CHI: Contraction homogeneity index
TSLD: Thickening-based septal-to-lateral wall delay THI: Thickening homogeneity index
DSLD: Displacement-based septal-to-lateral wall delay DHI: Displacement homogeneity index
LVEF: Left ventricular ejection fraction LVESV: Left ventricular end-systolic volume LVEDV: Left ventricular end-diastolic volume SV: Stroke volume
HR: Heart rate
CI: Contractility index CO: Cardiac output
Pmax: Maximum pressure of left ventricle
dP/dtmax: Maximum rate of left ventricular pressure change
TAC: Time-activity curve ROI: Region of interest SD: Standard deviation E: Efficiency
DCM: Dilated cardiomyopathy RVA: Right ventricular pacing AVB: Atrioventricular block BiV: Biventricular pacing
LVRV20: Biventricular pacing with 20 ms of LV pre-activation RVLV20: Biventricular pacing with 20 ms of RV pre-activation FDG: 18F- fludeoxyglucose
CT: Computed tomography ICC: Intra-class correlation
APD: Action potential duration AT: Activation time
To my beloved parents for their endless love,
Acknowledgements
First, I would like to express my sincere appreciation to my supervisor Dr. François Harel for the continuous support of my PhD study, for his patience, motivation, and helpful guidance during the last years. I could not have imagined having a better supervisor for my PhD study.
Second, I would like to thank the members of my thesis committee, Dr. Raymond Lambert, Dr. Éric Thorin, Dr. Raymond Taillefer, and Dr. Marcio Sturmer for their insightful comments and helpful questions on my thesis.
Besides, I would like to express my sincere thanks to Dr. Bernard Thibault who provided me an opportunity to join his research team, and who gave me access to the Electrophysiology Service and research facilities. I have learned a lot from his insightful comments. As well, I wish to thank his team: Marc-Antoine Gillis, Evelyn Landry, and Marie-Pierre Mathieu. All in all, without their precious support it would not be possible to conduct this work.
My sincere thanks also go to the nuclear medicine research team in particular Sophie Marcil and Vincent Finnerty who enlightened the first assets of research to me; for the stimulating discussions, and for all the fun we have had in the last few years.
I would also like to extend my appreciation to Dr. Jean Grégoire and the staff at Montreal Heart Institute for their guidance and patience during my research.
Last but not the least; I would like to thank my family: my parents and my two sisters for supporting me spiritually throughout my studies and my life in general and to my husband for his love, patience, motivational thoughts, and encouragement.
Introduction
In this chapter, the clinical motivation and a detailed background to mechanical dyssynchrony (MD), its applications and methods of assessment are provided. First, the main clinical motivation for the current thesis is identified in order to have a global view about the importance of the pacing and MD assessment. Next, the cardiac normal electrical activation sequence as an opening window to the ventricular pacing and cardiac resynchronization therapy is reviewed. Then, a detailed description is provided for better understanding of the MD concept, its applications, dynamic nature as well as quantification techniques. In the following, nuclear imaging techniques are overviewed both with the theory and practice vision. This section is helpful for the understanding of the overall methods used in this thesis. Next, the stress-induced modalities and the overview of the literature on dynamic left ventricular MD discourse are provided to add to the background knowledge of the stress-MD concept. Finally, the summary, objectives, and outline of remaining parts of the thesis are presented.
Clinical motivation
There are more than 200,000 Canadians and nearly 3 million individuals in North America living with permanent pacemakers or, cardiac rhythm devices.(1) Also, more than 250,000 new devices are implanted each year in North America because of an aging population and increased recommended indications for these devices.(1) The first pacemaker was implanted in
1960 with the hope to save the life of a patient with atrioventricular (AV) conduction block.(2) Since then, not only it was served as a life saver in patients with bradycardia due to sinus or AV node dysfunction, but also since 2000, as a treatment option for increasing the patients’
quality of life and expanding the survival rate in specific disorders (e.g. after cardiac transplantation or neuromuscular diseases) and cardiomyopathies (dilated or hypertrophic).(3) In the latter case, instead of treating or preventing the abnormal rhythms, pacing alters the activation sequence of the ventricles and influences the central hemodynamics in severe systolic heart failure (HF) and dilated cardiomyopathies.(3) Pacemaker implantation in these indications has been emphasized in previous guideline statements(3) since first, the indication for patients with sinus node dysfunction and AV block is inevitable thus it has been deemphasized and second, large number of new cases are diagnosed with HF each year (50,000 Canadians(4) and 915,000 Americans(5)). Despite major efforts have been made to identify the HF patients most likely to benefit from pacing therapy, still about 30% of recipients do not show any beneficial responses and ongoing efforts continue to develop more robust predictors.(6) One of the suggested predictors since 2000 has been the MD or timing
disparity in ventricular regional contraction. However, it is not clear why the past efforts for optimizing the candidates by improving the characterization and quantification of MD have not resulted in substantial improvement in non-responders’ percentage. As it might be due to the lack of understanding about dynamic nature of MD and somehow the limitation of the previous MD assessment methods, the aim of this work is to apply the nuclear imaging techniques to understand how stress can modify the mechanics of the ventricles and how pacing affects the left ventricular contraction at stress condition.
Normal electrical activation, a window to the artificial pacing
Since having knowledge about normal cardiac electrical activation is of special importance in the context of cardiac mechanics and resynchronization, a quick review of the sequence of
muscle cells within the cardiac walls which produce the action potential and conduct it throughout the cardiac chambers, causing the heart to depolarize and eventually contracts and pumps the blood out to the other organs. Under normal sinus rhythm, the action potential starts from the sinus node (first component of the system) in the atria and after activating the whole atria which take approximately 100 ms, by the inter-cellular conductions, reaches to the AV node (the second component of the system). In the normal heart, the AV node is the only electrical connection between the atria and ventricles. The impulse spends about 80 ms waiting to travel from the atrial side to the ventricular side in order to allow optimal ventricular filling before the ventricular contraction. Given the high resistivity (low conductivity) of the AV node tissue, it is susceptible to conduction impairments even a complete conduction block. In the following, the impulse reaches the His bundle of the Purkinje system (specialized conduction system of the ventricles) and then is conducted to the ventricles by the right and left bundle branches and eventually exits from both the anterolateral wall of the right ventricle (RV) and inferolateral wall of the left ventricle (LV). Electrical stimulation develops the action potential processes in the myocardial cells which are the sequence of ion fluxes through specific channels in the cell membrane. Myocytes exit the resting potential by depolarization wavefront and return the resting voltage after a short time by repolarization wavefront (for more information see reference (8)). Hence repolarization time is the sum of activation time (AT), the time between the earliest QRS deflection to the action potential upstroke, and the action potential duration (APD) or the action potential upstroke to 90% repolarization.(9)
Based on the observations in the isolated human hearts,(10) excitation synchronously
the anterior paraseptal wall just below the attachment of the mitral valve; central on the left surface of the interventricular septum and on posterior paraseptal about one-third of the distance from apex to base. These areas grow rapidly and merge in 15 to 20 ms, while the pattern of activation is mostly from the apex to the base through both the septum and free walls of the LV and RV, and transmurally from the endocardium to the epicardium.(10) Interestingly, endocardial cells are able to conduct the electrical impulses faster than the rest of the LV myocardium.(7) For the RV, endocardial activation starts near the insertion of the anterior papillary muscle 10 ms after the onset of LV activation.(7) The last parts of the RV and LV that become activated are the AV sulcus and the posterobasal area respectively.(7,10) In fact, the activation of the entire ventricles happens in a few ms (about 80 ms) in a homogenous and simultaneous way with the help of specialized Purkinje system; making the mechanical activation of the myocardium very coordinate.(7)
The aforementioned extraordinary valuable information on the excitation and activation of a normal heart and many other physiologic investigations opened the window into the use of artificial pacing which can mimic the AV activation sequence in patients with bradycardia and conduction disorders. In fact, if for any reason one of the components of the conduction system becomes dysfunctional, electric signals confront with functional block in their way through the system, finding new pathways through the working myocardium which makes the signal propagation to flow more slowly throughout the myocardium. This condition may create further structural and functional alterations which may ultimately result in the HF, a condition that impairs the ability of the ventricle to fill with or eject blood according to the needs of the body.(11) Thus, artificial pacing, as an inevitable therapy helps to improve the
function and the status of the HF patients and even may play a role as a life saver in patients with complete AV block.
Ventricular pacing
From more than 40 years ago, the ventricular pacing was introduced as a life saver in patients with complete AV block.(12) The site of the stimulation was first chosen to be the RV apex, given the ease of access, good fixation and a low capture threshold that RV pacing could provide.(12) However, after so many investigations on the long-term effects of the RV apical pacing, serious detrimental effects were proven to LV function(13,14) and structure.(15) These
effects were mostly attributed to the late activation of the LV free wall.(12) Thus, less effective ventricular contraction by RV apical pacing and its long-term effects which were similar to the left bundle branch block (LBBB) status(12) shifted the interest toward finding alternative pacing sites (biventricular pacing) that induce a more physiologic activation sequence and ventricular performance. However, as Arenas et al.(12) recently suggested, it is not basically correct to fully extrapolate the detrimental effects of LBBB and the benefits of biventricular pacing, that will be explained in the next section to all patients who need RV pacing. Since, as they mentioned, the activation pathway, electromechanical delay, and the LV synchrony is completely different between these two conditions. But how could we determine whether a patient with AV block would benefit from an alternative pacing site? This problem has been further discussed and investigated in the third chapter. Hence, although ventricular pacing in the mode of RV apical pacing was first introduced only for AV block patients, several years later new pacing devices were also developed for further conduction disorders.
Cardiac resynchronization therapy
In the mid-1990s, biventricular pacing device namely cardiac resynchronization therapy (CRT) was developed and found to be a clinically significant treatment in patients with end-stage HF and intrinsic conduction delay.(16) CRT consists of the electric pre-excitation of two opposing sites of the heart: the RV apex or septum and the LV free wall which can be stimulated simultaneously or with a phase delay while the atrial electric activation is sensed or artificially paced and a programmed shorter AV delay time is used to achieve the ventricular capture.(6) Not only acute improvement was seen in hemodynamics after CRT implantation,
but also chronic benefits such as improved LV function, symptoms, exercise capacity, and quality of life were proven at longer follow-ups.(17-20)
As it was apparently logic, CRT was first only targeted to a subset of patients who had a wide QRS duration(16) (e.g., LBBB); since simultaneous electrical stimulation of both ventricles in this treatment nearly compensated the later activation of the LV free wall relative to the RV and led to a practically synchronous ventricular contraction and therefore an efficient ventricular performance. However, using the QRS duration as an inclusion criterion in most of the early large clinical trials(17-20) for evaluation of response to CRT yielded some disappointed results.(16) Indeed, QRS duration poorly predicted the acute and chronic responses to CRT and about one-third of selected patients failed to show the expected clinical benefits.(16,21) Though, the interest was shifted toward other parameters that might better identify the CRT beneficiaries; since the CRT was (and still is) an expensive therapeutic option and so many procedural and follow-up complaints might occur from the patient side.
Mechanical dyssynchrony (MD)
Ventricular MD is the timing delay in ventricular regional contraction and was proposed as an alternative for QRS duration in CRT patient selection.(16) The first documented use of MD as a
parameter for prediction of response to CRT dates back to the early 2000s.(22) Primary studies found that MD better correlated with the acute(22) and chronic(23,24) CRT benefits and that it was an independent predictor of clinical events and survival in HF patients.(25,26) These findings, representing the assumption that mechanical rather than electrical dyssynchrony would better identify the CRT responders, initiated a cascade of research beyond the characteristics of MD, how prevalent it is, whether the method of its measurement is reliable and accurate, and if HF patients without a wide QRS duration are also appropriate for CRT.
A true attempt toward understanding of MD
Based on the results of studies including a variety of classified HF patients, MD seems to be quite common in HF patients neglecting the QRS duration. In another hand, as suggested by Kass in 2008, there is almost an epidemic of MD, which a majority of HF patients suffer from.(16) At this step, it is important to consider what exactly results in MD developing? As mentioned previously, homogenous, diffused and rapid electrical activation in the ventricles through the Purkinje system makes a coordinate and homogenous mechanical activation. But if there is a conduction disorder whether specific (e.g. LBBB) or non-specific, demonstrable in the ECG, it will cause a phase delay in the contraction of early and late activated regions. The electrical dyssynchrony is not always the reason of MD; there are still about 30% to 50% of HF patients, based on different studies, with a substantial amount of MD but without any widening or change in the QRS duration.(16,27,28) Kass (16) listed three logical reasons in his excellent MD review for this case:
1) RV activation is so quick that in spite of LV dyssynchrony still a narrow QRS complex is recorded.
2) Abnormal excitation-contraction coupling alters the kinetics of force development in one part of the heart compared with another.
3) Ischemic damage, fibrosis, etc. make regional disparity in the myocardial contractility. Based on the fact that which mechanism is involved in HF patients with a narrow QRS duration, they might benefit (e.g. if the first reason is true) or otherwise be non-responders to CRT.
In spite of small studies(29) on a subset of patients with narrow QRS complex and some promising CRT results, overall, a recent multi-center randomized trial “Echocardiography-Guided Cardiac Resynchronization Therapy” (EchoCRT)(30) reported no benefit in terms of number of HF hospitalization or death in patients with a QRS interval of < 120 ms. Thus, it seems that electrical resynchronization is not an effective therapy when the MD is not resulted from the electrical dyssynchrony.(31,32) However, it is not clear why the past efforts for optimizing the CRT candidates by improving the characterization and quantification of LV MD have not resulted in any substantial improvement in clinical outcomes (still 30% non-responders) even when further refining based on the ECG morphology (excluding no-LBBB patients) has been performed.(33) As it has been pointed out in literature, it might be due to the limitations of the MD assessment methods.(33) Also, the dynamic nature of MD may play a role per se. These two important constraints must be further investigated; since the MD not only has a critical role in the prediction of response to CRT but also has several other applications in today’s clinical practice that are discussed in the next section.
As a note, although the current guidelines still recommend the CRT in patients with New York Hear Association (NYHA) class III or IV symptoms, LV ejection fraction (EF) ≤ 35% and QRS duration ≥ 150 ms, the CRT indications have been expanded to include NYHA I-II, LVEF ˂ 40%, QRS > 120 ms, and chronic RV pacing secondary to AV block via randomized controlled trials in recent years.(34)
MD applications
The utility of the MD was shown to not being circumscribed to CRT optimization. Other potential clinical applications have been examined from about last 5 years. These applications include MD utility in prognostication and risk stratification of different subsets of patients(35) with ischemic(36) or non-ischemic cardiomyopathy,(37) implantable defibrillators,(38) and end-stage renal disease.(39,40)
A classic parameter used to predict the future cardiovascular events or survival has been the LVEF which is a measure of global systolic function.(41) However, because of getting influenced by ventricular geometry and hemodynamic conditions, it could not be a sensitive indicator of ventricular function.(41) Among various parameters identified for better risk-stratification, LV MD has been proposed as a unique indicator not only capable of determining the clinical outcomes in HF patients but also predicting major adverse cardiovascular events in asymptomatic individuals without evidence of heart disease.(41) The quantification of LV MD accordingly helps to identify the risk of HF progression in individuals who do not have the symptoms of any recognized heart disease and have a preserved EF.(42) This is of significant value since the optimal intervention period is always at early stages of the cardiac disease.
As previously studied, the age, increased LV mass, and lower regional myocardial perfusion are related to the superior extent of myocardial dyssynchrony in asymptomatic
individuals.(43) Also, LV MD was found to be closely linked to presence of coronary artery disease (CAD) risk factors (hypertension, diabetes, dyslipidemia, and obesity), QRS interval ≥ 120 ms, history of CAD (primarily acute myocardial infarction), LV dysfunction (LVEF ˂ 45 %), male sex, and presence of myocardial perfusion defects, especially of the fixed type in a retrospective study of 1000 patients with or suspected to have myocardial disease who underwent myocardial perfusion imaging.(42)
Dynamic nature of MD
MD is not a stable phenomenon; since the mechanical contraction is affected by different conditions and factors such as exercise, drug administration, inducible ischemia, pacing-induced tachycardia and so forth; thus MD would change from time to time.(44) Dynamic LV MD has been assessed in different subset of patients, mostly in HF patients amenable to CRT,(45-47) and is thought to be a potential interfering mechanism for the lack of predictive value of resting MD.(44) Rocchi et al. was the first one that assessed this hypothesis and showed that exercise-MD is a stronger predictor of response to CRT than resting-MD.(48) Also, stress-induced variation in MD, whether positive or negative, has been shown to bear a greater relationship to clinical outcomes (death, heart transplant, assist device implantation, etc.) than resting-MD as assessed either in CRT candidates(49) or patients with dilated cardiomyopathy.(50) In fact, increased myocardial contractility during the exercise or pharmacological-induced stress (e.g. dobutamine infusion) may bring regional differences in myocardial contraction that is easily detectable at stress levels.(44,51)
Imaging techniques for quantification of MD
Echocardiography
So far, the echocardiography has been the most useful tool in cardiology for assessment of cardiac function and contraction abnormalities, since it is inexpensive and largely available.(52) Thus, it was also mostly used in the case of CRT patient selection, optimization of lead placement and device configuration as well.(52) Despite promising preliminary data from single-center studies in the value of CRT patient selection by echocardiography,(24,53,54) the
PROSPECT trial (with a multi-center setting) announced that echocardiographic parameters assessing MD do not have enough predicting value to be recommended in routine clinical assessments.(55) This fact was more highlighted in EchoCRT(30) trial; since using even modern echocardiographic tools (speckle-tracking strain) in this trial could not change the belief stimulated by PROSPECT trial. Indeed, these methods are highly subject-dependent both in the case of image acquisition and analysis and because of limited repeatability and reproducibility cannot be reliable.(16,55) Probably, besides dynamic nature of MD, using echocardiography for quantification of MD has been resulted in a lack of a significant improvement in clinical outcomes (or reducing the number of non-responders).(33) As Van Everdingen et al. suggested, echocardiography is a friend of CRT but with known limitations and not in the patient selection but in other aspects like optimization of lead placement.(52)
Cardiac magnetic resonance imaging
Cardiac magnetic resonance imaging (MRI) as a non-invasive imaging modality provides excellent image spatial resolution and soft tissue contrast and does not have any ionizing radiation.(56) MRI as a gold standard for volumetric functional analysis, can also track the myocardial surfaces in 3-D space and analyze longitudinal, radial and circumferential strains
(i.e. myocardial deformation or length differences in the direction of long axis of the ventricles, across the wall (transmurally), and in the direction of ventricular circumference respectively) in a quite reproducible way using tagging techniques.(57) Thus, it seems to be quite functional for prediction of CRT response. However, MRI is not widely used in the measurement of MD because of high equipment cost, image acquisition complication, and lack of automated algorithms for image quantification.(51)
Nuclear imaging modalities
Nuclear cardiology techniques have been reliable alternatives to echocardiography for assessment of cardiac function since 1980.(51,58) First, planar radionuclide ventriculography(59) in 2-D, and then single-photon emission computed tomography gated blood pool (SPECT; GBPS)(60) in 3-D space were applied for better functional analysis and MD quantification. In both methods, the MD associated with endocardial motion can be analyzed by the variation of counts within the region of interest over the cardiac cycle.(51) Both planar and GBPS are promising in the assessment of not only LV intra- but also interventricular MD (phase delay between RV and LV contraction); because blood pool rather than myocardial wall imaging allows to a reliable volumetric estimation.(61) However, they cannot provide further information on the myocardial infarction, ischemia, and scar which has been shown to be a key determinant of response to CRT.(62) To make all this information in one session imaging, as Zhou et al.(63) so-called “one-stop shop”, gated myocardial perfusion SPECT (GMPS), over
10 years ago,(64) and later positron emission tomography (PET) have been proposed for the purpose of CRT response prediction. Phase analyses of GMPS or PET assess the LV function, scar burden and location, LV site of the latest contraction, and MD from a single scan.(63)
Thus, depend on what information is needed based on each application and in which level of accuracy, the technique should be chosen.
Given the automated nature of phase analysis,(65) mostly determined by GMPS, it has shown excellent repeatability and reproducibility for quantification of ventricular MD.(66) This property facilitates the use of phase analysis for CRT patient selection process. In fact, the accuracy of predicting value of MD by phase analysis has been shown in previous single-center acute(33) and chronic(58) studies in HF patients considering the current CRT inclusion criteria. However, prospective multicenter studies are warranted in this regard.
Overall, compared to other assessment methods, nuclear imaging is very promising for widespread clinical use in the CRT application; since it is routinely practiced, well standardized, and inexpensive.(63) Information about myocardial scar burden, viability, MD and global function in one-stop shop, automatic and highly reproducible fashion can be provided by these techniques.(63)
SPECT imaging techniques for MD assessment
The use of computer techniques in today’s nuclear medicine from the acquisition to processing, display, and data analysis has standardized the imaging and final image interpretation. It is the reason of an upward increase in utilization of nuclear medicine modalities (SPECT and PET) in today’s busy and demanding clinical environment.(67) The focus of the current thesis is on the SPECT imaging and techniques. In the following sections, two main cardiac SPECT techniques and the steps through which a 3D cardiac image is obtained will be described.
Gated SPECT myocardial perfusion imaging
One of the most common methods for simultaneous evaluation of myocardial perfusion, function, and synchrony of contraction is GMPS. In this method, a radioactive-labeled substance which is mostly the Technetium-99m (99mTc) agents (sestamibi or tetrofosmin) is intravenously injected into a patient. After intravenous injection, the 99mTc agent is rapidly cleared from blood and uptakes by the myocardium. First-pass extraction and percentage of cardiac uptake for tetrofosmin and sestamibi are 50% and 1.2% versus 60% and 1.5% respectively.(68)
99mTc is a radionuclide with a half-life of 6 hours which emits the gamma rays in the range of 140.5 keV.(69) The energy is high enough not to be that much attenuated and low enough to be well detected by gamma cameras in nuclear medicine. The purpose of this radionuclide imaging is to obtain a 3-D image of the distribution of 99mTc within the LV myocardium.(70) In addition, the high counting statistics of 99mTc agents beside the use of the electrocardiographic gating makes a tomographic image set which allows for the visual and quantitative assessment of functional parameters such as myocardial motion and thickening.(70) To reach this aim, several steps are needed as gated SPECT acquisition, image reconstruction, filtering, image reorientation, segmentation, and final quantitative analysis. The following has described each of the steps respectively.
Gated SPECT acquisition
After the injection of a 99mTc-labeled agent to the patient and its uptake by the myocardium, gamma rays are emitted at the energy level that is high enough to be detected by the gamma camera without increasing the patient dose (there must be a balance between attenuation and detection). Although some of these photons undergo scatter or attenuation in the body, a
considerable amount can reach to the detectors of gamma camera consist of a scintillation crystal and an array of photomultiplier tubes (PMTs) and could be detected.(69,70) The collision of gamma photons to the scintillation crystal which is commonly the thallium-activated sodium iodide or NaI(Tl) crystal, leads to their conversion into the light photons (scintillation).(69) In the next step, light photons reach to the PMTs to be transformed into the electric signal and to be amplified and produce a strong electric current. The ultimate current is proportional to the energy of incident gamma ray and the amount of light from the scintillation process that reaches the PMT surface.(69) The final electric signals contain the acquisition data which is acquired in the form of tomography because the gamma camera head rotates around the patient in an orbital path and gathers several projection images(70) (in this thesis a dual-head gamma camera was used with 64 projections dispatched on a 360˚ configuration). Using more than one camera head provides more counts for the image acquisition in the same acquisition time since at least 2 projections could be acquired simultaneously. Typically the procedure of the scan takes about 15–20 minutes in which the projections are acquired every 3–6 degrees.(71)
If the signal gating is used for the acquisition, each R wave of electrocardiogram plays a role as a trigger which provides a time window (R-R interval) for selected set of projections from among many during the data collection. Then, R-R interval could be divided into 8 or 16 equal segments and thus 8 or 16 projection images could be acquired corresponding to each portion of the cardiac cycle. Gating in several time frames helps to have a 4-D (3-D plus time) image which allows for the dynamic cardiac function assessments.(70) Also before reconstruction, summing all the projection images from different time intervals at each angle produces an ungated or static SPECT image from which perfusion can be assessed.(70)
Image reconstruction
As mentioned in acquisition section, a 2-D projection image at each angle includes a series of counts or a projection profile related to the activities detected in the body. All the profiles known as sinogram are used to reconstruct a 2-D cross-sectional image of activity from the myocardium. For instance, all the profiles related to the apex section must be used to reconstruct the apex transaxial slice which is then stored in the first row of a 2-D matrix. Thus, if 16 frames per cardiac cycle and 64 projection angles at one complete patient rotation are used, data could be collected in 16 matrices of 64 × 64 pixels. Each matrix represents the maximal count in each myocardial segment from apex to base (row of the matrix) for each projection angle (column of the matrix).(67) In fact, collecting data at 64 different angular positions and summing all projection profiles, can provide enough information for reconstruction of a 2-D cross-sectional image at each time interval. To exclude extra-cardiac activity for the reconstruction process, the cardiac region can be manually selected. There are several approaches to reconstruct an image from the projection profiles as are discussed in the following.
Simple Backprojection
As it is apparent from its name, this approach is a basic and simple approach to image reconstruction. Projecting (or distributing) the data or counts recorded in a particular projection profile back uniformly on the pixels of an image matrix along its projection angle helps to have an approximate source distribution.(69) One of the drawbacks of this approach is the blurriness of the final image that even using an infinite number of views does not make the image completely clear.
Filtered Backprojection
To improve the image quality in simple back-projection approach, filtering was suggested to be applied on the count profiles before the reconstruction.(69) Filtering process will be discussed in the next section in detail. However, what is important here is that to apply a filter in filtered back projection (FBP), the data are preferred to be in the frequency domain rather than the spatial domain. In this method, a ramp filter is used so as to selectively amplify high-frequency components relative to low-high-frequency components.(70) Although filtering besides the back-projection process can eliminate the disadvantage of the previous approach, it still has some constraints. Filtering process in datasets with poor counting statistics can produce specific artifacts in the image. Once more, if the filtering in high spatial frequencies is used to eliminate those artifacts, it would further decrease the image resolution.(69) Also, the FBP algorithm requires additional data processing to compensate for some physical aspects of the imaging system and data acquisition, such as the limited spatial resolution of the detector and scattered radiation.(69) To consider these aspects directly into the algorithm and to decrease the
probability of producing artifacts, iterative reconstruction approach came into the routine clinic with the support of higher computer speeds.
Iterative Reconstruction Algorithms
This approach uses several steps of estimation and comparison with the actual image to reach a successful true estimation of the image. A simple initial estimation could be even a blank or uniform image from which the intensities along each angle are summed up to yield a projection profile (inverse to the back-projection).(69) Doing so for all projections through the estimated image yields an estimated sinogram which will be compared with the actually recorded sinogram. If the convergence has not been achieved in comparison process, it can be
adjusted based on the difference between the estimated and actual projections.(69) The update and compare process is repeated until the estimate approaches the maximum likelihood (ML) (usually in 10 – 15 iterations).(69) All the projection profiles or a complete sinogram must be produced at each iteration, and compared to the actual sinogram which is a long procedure. A method called ordered-subsets expectation maximization (OSEM) has been used to reduce the time of the conventional ML algorithm so that only a small number (or subset) of projection angles are used in the initial iterations and a larger number of projection angles are included in further refinements.(69,72) Iterative reconstruction can provide a more accurate image of the radioactive distribution within the body relative to the FBP.
Filtering
Even after iterative reconstruction, the quality of the image is not as good as expected; since there are several restrictions during the acquisition of gamma rays that lead to have generally poor statistics and high noise levels. These factors are the attenuation and scatter of gamma ray photons, the detection efficiency and the spatial resolution of the collimator-detector system.(71) Hence, post-processing or filtering is an important part of SPECT imaging to obtain a high-quality image. The choice of a filter for a reconstruction technique is always a trade-off between the extent of noise reduction and detail preserving.(71) In order to filter an image, it must be transformed from the spatial domain to the frequency domain or K-space (the coordinate system in the frequency domain) so that each 1-D projection profile from the object domain at each angle must be transformed into the 1-D K-space profile by Fourier function.(69) The Fourier analysis will be discussed in the following sections. In fact, it seems quite logical to filter the images based on the frequencies to highlight certain features or remove others.
To reduce the statistical noise of a SPECT image, the smoothing or low-pass filters are commonly used, the inverse of high-pass filters such as ramp filters, which block the high frequencies and allow the low frequencies to remain constant in the image.(71) A number of low-pass filters are available for SPECT reconstruction but the most usual choice in nuclear medicine is the Butterworth filter. Given the ability to change not only the critical frequency, the frequency above which the filter starts to roll-off, but also the steepness of the cut-off, Butterworth filters are able to smooth the noise while preserving the image resolution.(71) Comparing Butterworth filter with Gaussian filter (a band-pass filter which allows certain range of frequencies to pass, more in the origin and less in the edges) and several other low-pass filters in a study by cardiac phantom indicated that Gaussian filter was the best for contrast and signal-to-noise ratio while, Butterworth filter was the best for trade-off between contrast, signal-to-noise ratio, and defect size accuracy.(71,73) As a result, for qualitative
analysis requiring high contrast and signal-to-noise ratio, Gaussian filter was suggested whereas for quantitative analysis requiring both image quality and defect size accuracy Butterworth filter was proposed.(71,73)
During the present thesis, quality of the cardiac images was important for the final segmentation processes and 4-D functional tracking and further analysis. Consequently, a ramp and a Gaussian function were multiplied to form the Fourier spatial frequency filter used in the FBP reconstruction process, when applicable, and only the symmetric Gaussian function was applied when the OSEM reconstruction was used.
Reorientation
Reconstruction of the image with either of the above methods provides a set of transaxial images (images perpendicular to the long axis of the patient). In this thesis, Siemens e-soft
auto-car axis vie sagittal camera T patient. reorient the time is avail reprodu Figure 1. stacked re Left ven Short ax the proc Shor rdiac proces ews from sta and corona software wh The orientat To be able t t the transaxi e, the tomog able today ucibility of th Different view econstructed sh ntricular se xis image sl cess of separ rt axis view ssor is used acking the sh al planes res hich can be s tion of the h to have a sta ial images p graphic imag for automat he process. (7 ws of the distri hort axis image egmentation
ices produce ration of LV
as camera s hort axis ima
spectively. T seen in Figur heart in che andard view perpendicular ge reorientat tic reorientat 70) ibution of the t es from differe n ed from the V from the r Horizontal oftware to p ages after rec This step is
re 1. est is obliqu
and orientat rly to the lon tion is perfo tion which tracer in the le ent planes. reconstructi rest of the ca
long axis view
provide the v construction always aut ue and the a tion in all th ng axis of th rmed manua can greatly eft ventricle by ion step is u ardiac portio w Ver vertical and n and cutting omatically d angle varies he patients, i he LV(70) (Fi ally. Howev improve th y cutting throug
used for the ons. Segmen rtical long axi
horizontal l g them along done within from patien t is importan igure1). Mos ver, the softw he accuracy gh the center o segmentatio ntation is on is view long g the n the nt to nt to st of ware and of the on or ne of
the most important parts of the imaging for quantitative analysis such as perfusion or EF assessments and its precision is based on the precision of previous steps. There is a number of commercially available software for automatic segmentation of the LV which can produce a 3-D LV image with the myocardial boundaries for further motion and functional analysis. Some of the well-known software in this regard include the Quantitative Gated SPECT (QGS; Cedars-Sinai Medical Centre), Emory Cardiac Toolbox (Emory University), and Corridor4DM (Michigan University). The details of each software method for segmentation and analysis are beyond the focus of the present thesis. However, I briefly remark some important points about the QGS software that is used throughout this thesis along with our in-house software in the following section.
Generally, if the aim is to assess the function or to calculate the volume and EF, the correctness of the estimated myocardial boundaries is of special importance. However, if the aim is only to evaluate the synchronicity (the coincidence of the motion or thickening) of the LV walls, it is not essential to find the actual positioning of the myocardial edges.(70)
Quantitative Gated SPECT (QGS) software
The QGS software uses the gated short-axis data sets after stacking them together to form a 3-D image volume.(70) The first step involves the automatic segmentation of the LV myocardium based on several segmentation methods which are performed simultaneously in an iterative process to obtain a mask consistent with the expected size, shape, and location of the LV.(74) In
fact, segmentation subdivides the image into its subsequent regions and the process is stopped when the LV is isolated. Various and complicated algorithms of segmentation are commonly used by engineers in the field of biomedical imaging based on the properties of intensity values either discontinuity or similarity. However, two main categories can be defined for
these te dissimil splitting but the QGS us G measure estimate perform cavity) radial c at each along al surface. Figure 2. QGS auto from Medicine echniques: 1 lar according g, and mergi interested r ses several m Germano e ements wher e the mid-m ms the follow is automatic ount profiles direction, a ll rays identi . . Three-dimens omatic algorith http://cedars-e-AIM/Projects ) abrupt cha g to a set of ing.(75) The d readers can methods in bo t al. first re precise m myocardium wing proced cally determ s are drawn according to
ify the maxi
sional display hm (Cedars-Sin -sinai.edu/Patie s/Quantitative-anges in inte f predefined details of the find good i oth mentione introduced myocardial s m as well a dures. Once mined as the from the ori a spherical imal count in
of the endoca nai) for a patien ents/Programs-Gated-SPECT ensity (or ed d criteria; e.g ese methods information ed categorie the QGS surface gene as endocardi the LV is i e origin of t igin both lon l sampling m n the myoca ardial (solid) a nt at end diasto -and-Services/M -QGS.aspx. Co dges) 2) part g. thresholdi are beyond in the follo es to obtain th software i eration was i ial and epi isolated, its the sampling ngitudinally model(74) (Fi ardium or the and epicardial ole in septal, a Medicine-Depa opyright (2016 titioning of ing, region g d the focus o owing refere he expected in 1995 fo important.(74 cardial surf center of m g coordinate and latitudi igure 2). Th e estimated (grid) surfaces apex and inferio artment/Artific 6) by Cedars-Si regions that growing, reg f our discus ences.(76,77) LV mask.(70 or accurate 4) To accura faces, the Q mass (within e system. Th inally, every he local max mid-myocar s calculated by or views. Retri cial-Intelligenc inai(78) t are gion sion The 0,74) EF ately QGS n the hen, y 10º xima rdial y the ieved
ce-in-To be sure of the first estimated mid-myocardial surface, it is fitted to an ellipsoid and previous procedure of placing the original coordinate system or center of mass along the ellipsoid’s long-axis and sampling is iteratively performed until the long-axis angular variation is less than 0.5 degree.(74) The count profiles from sampling the center of the final ellipsoid then are fitted to asymmetric Gaussian curves. The peak of Gaussian curves represent mid-myocardial surface, while the endocardial and epicardial surfaces are determined by the calculation of Gaussian standard deviations, and the valve plane is determined by fitting a plane to the most basal myocardial points.(70)
The important matter at this point is the preservation of myocardial mass throughout the cardiac cycle which is imposed to the algorithm as a constraint. Once all the myocardial surfaces are calculated for each gating interval, quantitative analysis for LV cavity volumes can be performed. Multiplying the individual voxel volume by the number of voxels contained in the 3-D space between the endocardium and the valve plane yields the LV volume.(70) Based on calculating at end-diastole or end-systole, the volume would be the largest or smallest one from which the LVEF is derived as following:
= − × 100 (1)
Where, the EDV and ESV stand for end-diastolic and end-systolic volumes respectively.
Left ventricular synchrony parameters (QGS)
QGS software added a phase analysis plug-in option in 2008 and introduced several parameters for ventricular synchrony measurements. All of these parameters are used in synchrony assessments throughout the present thesis.
The QGS considers several spatial sampling points along the mid -myocardial surface and tracks the local maximum myocardial counts at each time interval. This creates a unidimensional array that represents a time-varying or periodic function. The number of counts varies with time, meaning that the counts increase at end-systole and decrease at end diastole and this happens cyclically. The QGS takes advantage of this periodic function by transforming it into the frequency domain to be able to work easier and more efficient with the sinusoidal signal in this domain. Using 8 or 16 frames per cardiac cycle is insufficient to have a continuous sinusoidal curve. QGS uses the first harmonic of Fourier function to increase the temporal resolution and to replace the discrete curves by the continuous ones.
The characteristics of a continuous sinusoidal signal during a cardiac cycle in the frequency domain can be determined by first, the phase angle which is the timing of mechanical contraction, the basis of all synchrony parameters, and second, the amplitude which is the magnitude of contraction or representative of regional stroke volume. In fact, the amplitude is only used by the algorithm to eliminate phase measurements that their corresponding amplitudes are considered too low to yield accurate measurements.(65) As it has been reported, around 5% of the samples with lowest amplitudes across the sampling region are automatically removed from the QGS analysis; since phase measurements are inaccurate for signals with low temporal variations.(65)
Once the phase signals are calculated for all the sampling points, a histogram of the distribution of those phase angles can be displayed in the software (Figure 3). On the basis of the whole-ventricle, wall-based, vessel-based, and segment-based statistics, phase histograms can be displayed and multiple global and regional LV synchrony parameters can be extracted from these histograms.(65) The mean and standard deviation are calculated as a routine part of
histogra which i calculat region o T estimate how ra myocard by the O when th contract assumpt synchro am distributi s the width ted. Moreove of interest is Figure 3.The The entropy e the random ndom and dium. The u O’Connell et he synchron tion is comp tion is to co ony with the
ion measure of the phase er, the entrop also defined e phase histogra y is a famil mness within uncoordinat use of entrop t al. (79) in 20 ny supposed pletely rando onsider the r e other, wh ements in th e band or ra py or the ran d in the QGS am and polarm liar term in n a system or
ted the sam py in cardiac 005 to distin to be zero. om and nonh region of int ere each su he software. ange that con ndomness of S software as map display of t n various sc r process. In mple points c mechanical nguish betwe In this cas homogeneou erest be mad ub-region is Also, the b ntains 95% o f the phase d s a part of ph the GMPS asse cience and e n fact, the en contract wi l synchrony een two form se, first assu
us in the reg de of two su highly syn bandwidth o of the histog distribution w hase parame essed by QGS engineering ntropy here i ithin the en analysis fir ms of ventric umption is to gion of inter ub-regions, nchronous, y of the histog gram sample within the wh eters. software. application is an estimat ntire ventric st was propo cular contrac o think that rest. The sec one 180° ou yet their sum
gram es is hole ns to te of cular osed ction t the cond ut of m is
not.(79) Using the entropy hence, the actual randomness of the contraction could be determined within the region when the synchrony of contraction is diminished. The simplest and most common approach for entropy measurement is the histogram-based estimation via the following formula:(79)
= − ∑ × log ( ) log ( )
(2)
in which M represents the number of histogram bins and Pi is the frequency of the occurrence of phase angle i. Thus, the entropy is the number of measured phase angles that fall within bin i divided by the total number of bins or phase measurements in the histogram in a logarithmic form ranging from 0 to 1. In the ventricular synchrony assessments, if only one phase value exists in the histogram, entropy would be equal to zero and synchrony of contraction would be at maximum level.(65) We take benefits of all mentioned QGS synchrony parameters to assess ventricular mechanical synchrony under stress in our experimental models.
MHI4MPI software
The MHI4MPI is a fully automated in-house algorithm that assists in the diagnostic evaluation
of mechanical synchrony in gated myocardial perfusion SPECT by segmentation of the LV and computation of the synchrony of wall contractions.(80) Although the QGS software is
valuable on its own in segmentation and phase analysis, it does not consider the amplitude of contraction in its computations. However, besides the phase of contraction, the amplitude or the magnitude of wall contraction is important in wall thickening or motion abnormalities, since a dyssynchronous wall contraction with greater magnitude can more affect the entire contraction efficiency.(81) MHI
4MPI algorithm takes both the phase and amplitude of
T with au using in defined algorith geometr algorith and evo till the vertices than the exercise surface Figure 4. triangular The algorith tomatic trac ntensity and by searchin hm (3D-Snak ric structure hm starts fro olves with ap shape fits t s along the d e current po ed to keep e dimensions. The dynamic m r shapes and su hm first start cking points gradient va ng for maxi ke) is then e whose sh om a simple pplying som the ventricle direction nor sition (Figu each vertex n . mid-myocardia urface tetrahed ts with segm throughout alues.(80) Aft mal intensit used to seg hape evolve 3-D structu me external an e volume. T rmal to the m ure 4). In ord
near the ave
al surface of ap rons. mentation of the systolic erward, the ty points in gment the L es following ure like a po nd internal f The external myocardial der to keep erage of its n pproximately 3 f the LV by and diastoli initial static ungated im LV volume. g an iterati olyhedron w forces in an l forces are surface, tow the surface neighbors, w 360 vertices wh identifying ic frames in c mid-myoca mage. A defo A deforma ive process. with some fac
iterative pro e submitted wards pixel i smooth, int while conser
hich are linked
the basal p n a cardiac c ardial surfac ormable sur able model .(82) Hence, ces and vert ocess (64 tim
on each of intensity gre ternal forces rving the glo
d together maki lane ycle ce is rface is a the tices mes) f the eater s are obal ing