Community in Québec and its Regions
Philippe PARENTEAU Marie-Odile MAGNAN and Caroline V. THIBAULT
Socio-economic Portrait
of the English-speaking
Community in Québec and its Regions
Philippe PARENTEAU
Marie-Odile MAGNAN
and Caroline V. THIBAULT
Edited by Madeleine GAUTHIER
Translated by Peter Frost
Institut national de la recherche scientifique Urbanisation, Culture et Société
Editorial responsibility: Madeleine Gauthier madeleine.gauthier@ucs.inrs.ca
Institut national de la recherche scientifique Urbanisation, Culture et Société
www.obsjeunes.qc.ca
Distribution:
Institut national de la recherche scientifique Urbanisation, Culture et Société
385 rue Sherbrooke Est Montréal (Québec) H2X 1E3
Phone: (514) 499-4000
Fax: (514) 499-4065
www.ucs.inrs.ca
Research project funded by Canada Economic Development
This handbook is a translation of Parenteau, Philippe, Marie-Odile Magnan et Caroline V. Thibault, Portrait socio-économique de la communauté anglophone au Québec et dans
ses régions, Institut national de la recherche scientifique Urbanisation Culture et Société,
Québec, 2006, xxviii, 246 pages.
ISBN 978-2-89575-130-4
Legal deposit - Bibliothèque et Archives nationales du Québec, 2008 - Library and Archives Canada, 2008
TABLE OF CONTENTS
EXECUTIVE SUMMARY ... V
REGIONAL FACT SHEETS ... XI
INTRODUCTION ... 1
METHODOLOGY ... 3
1 SOCIO-ECONOMIC PORTRAIT OF QUÉBEC'S ENGLISH-SPEAKING COMMUNITY – OVERVIEW ... 5
1.1 Size of English-speaking population ... 5
1.2 Territorial distribution ... 6
1.3 Age structure ... 11
1.4 Language knowledge and use ... 13
1.5 Mixed marriages and language transfers ... 14
1.6 Socio-economic well being ... 17
1.7 Migration and immigration ... 22
1.8 Conclusion ... 28
2 SOCIO-ECONOMIC PORTRAIT OF ENGLISH-SPEAKING COMMUNITIES IN QUÉBEC'S REGIONS ... 31
2.1 CENSUS METROPOLITAN AREA OF MONTRÉAL ... 32
2.2 MONTÉRÉGIE ... 52 2.3 OUTAOUAIS ... 63 2.4 LAURENTIDES ... 74 2.5 ESTRIE ... 84 2.6 CAPITALE-NATIONALE ... 94 2.7 GASPÉSIE—ÎLES-DE-LA-MADELEINE ... 105 2.8 LANAUDIÈRE ... 116 2.9 CÔTE-NORD ... 127 2.10 CHAUDIÈRE-APPALACHES ... 138 2.11 MAURICIE ... 149 2.12 ABITIBI-TÉMISCAMINGUE ... 160 2.13 CENTRE-DU-QUÉBEC ... 171 2.14 SAGUENAY—LAC-SAINT-JEAN ... 182 2.15 NORD-DU-QUÉBEC ... 193 2.16 BAS-SAINT-LAURENT ... 203 2.17 CONCLUSION ... 214 BIBLIOGRAPHY ... 217
APPENDIX A1 – QUÉBEC (PROVINCE) TABLES ... 219
APPENDIX A2 – MONTRÉAL CMA TABLES ... 225
Executive Summary
Study aims
This socio-economic portrait aims to improve our knowledge of Québec’s English-speaking community. This community is herein defined by mother tongue, mother tongue being the first language learned and still understood at the time of the census (Statistics Canada).
Methodology
The data are from different data banks and research reports, all of which are based on Statistics Canada censuses. At the time that this report is being written, the latest census is the one from 2001. The data banks and reports use two ways to classify answers to questions about mother tongue. When the answer is both English and French, the respondents are classified either as English or French or as French and English. This difference in data processing has a minor impact on the results. The classifications are explained in detail in the "Methodology" section.
The situation of English-speakers is compared, when appropriate, to that of French-speakers and sometimes to that of people who speak other languages. In this report, the terms English-speakers, French-speakers, and Speakers of other languages identify individuals by mother tongue.
Socio-economic portrait of English-speakers in Québec – overview
Québec's English-speaking population: 1971-2001
In the 2001 census, Québec had 591,378 individuals who spoke English as their mother tongue. From 1971 to 2001, the English-speaking population dropped by 25% and its share of Québec's population fell from 13.1% to 8.3%. Meanwhile, the French-speaking population held relatively steady, rising from 80.7% to 82.5%. Speakers of other languages almost doubled and their share of the total population rose from 6.2% in 1971 to 10.3% in 2001.
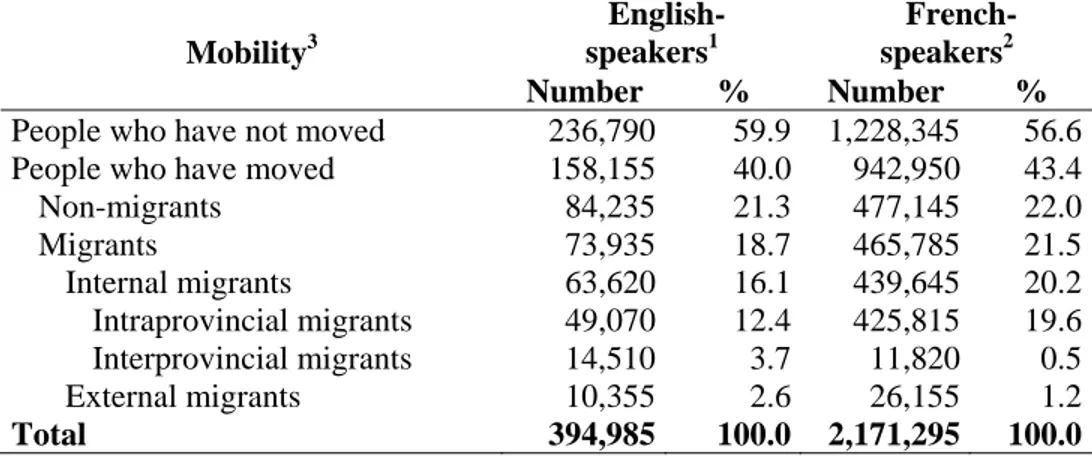
Interprovincial migration and immigration
Québec's English-speakers largely declined in number because of net interprovincial out-migration between 1971 and 2001.1 Between 1996 and 2001, 53,300 English-speakers left Québec for other provinces, while only 24,100 came to Québec from other provinces.
In addition, only 8,205 English-speakers came from other countries to settle in Québec during the same period.
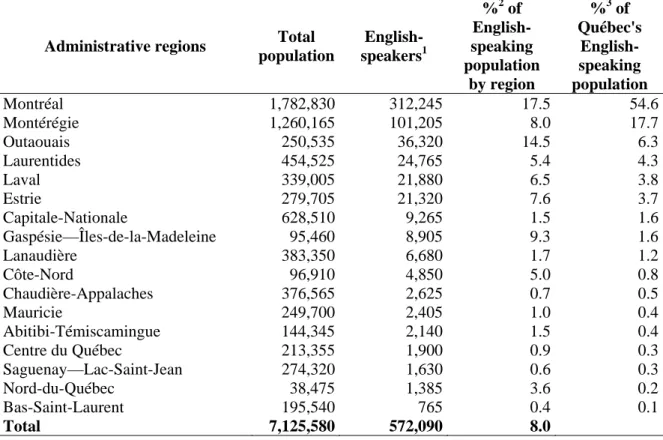
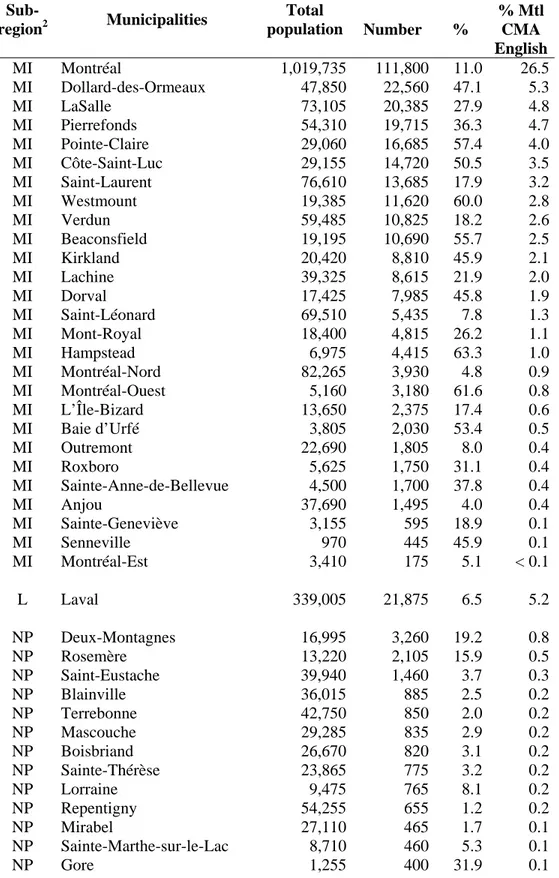
Territorial concentration and dispersion
Three-quarters of Québec's English-speaking population (74.6%) are concentrated entirely in the census metropolitan area (CMA) of Montréal. Another 7.7% inhabit areas adjoining the Montréal CMA, i.e., the non-metropolitan portions of Montérégie, Laurentides, and Lanaudière. Thus, over 82% of Québec's English-speakers inhabit the Montréal CMA and its periphery. The other 18% mostly live in the Gatineau CMA (5.7%) and Estrie (3.7%). Elsewhere, they are mainly concentrated in Outaouais outside the Gatineau CMA (2.2%), Gaspésie—Îles-de-la-Madeleine (1.6%), and the Québec City CMA (1.5%).
Nearly 82% of English-speakers inhabit urban centres with 10,000 or more inhabitants (census metropolitan areas (CMAs) and census agglomerations (CAs)). The English-speaking population makes up 8.3% of Québec's urban population (CMA/CA) and 4.8% of the non-urban population (rural areas and towns with less than 10,000 inhabitants). English-speakers account for about 12% of the total population in the Montréal and Gatineau CMAs. Other areas with significant proportions are Gaspésie—Îles-de-la-Madeleine (9.3% of the region's population), Estrie (7.6%), and Côte-Nord (5%).
Among municipalities with 5,000 or more people, English-speakers formed the majority (over 50%) in Hampstead, Montréal-Ouest, Westmount, Pointe-Claire, Beaconsfield, and Côte-Saint-Luc in the Montréal area and in Lac-Brome in Montérégie.
Age structure
The median age of English-speakers in 2001 (37.2 years old) was 1.5 years lower than that of French-speakers (38.7 years old). Proportionately more were in the 0-19 and 60 + age groups. The proportion in the 20-39 age group has been declining in recent years, falling from 32.4% in 1991 to 27.5% in 2001. It is the 25-34 year-olds who have been the most prone to leave the province since 1991. The median age has risen by nearly two years among English-speakers since 1991—an aging trend that may continue into the future.
Education
English-speakers are better educated than French-speakers. Proportionately more have completed at least CEGEP or university (51% versus 38.8%). Almost twice as few have less than Grade 9 (8% versus 15.1% of French-speakers).
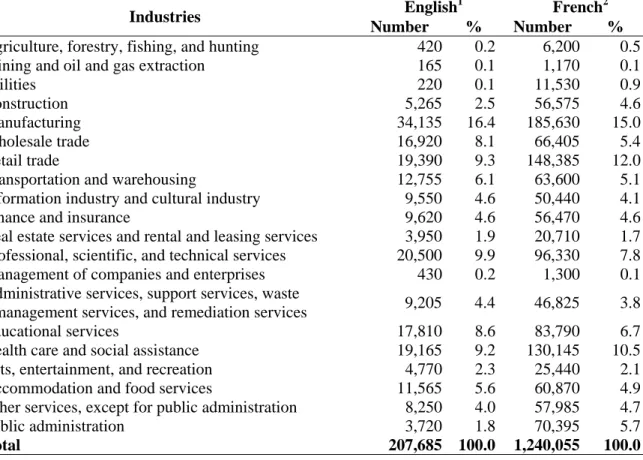
Occupations and job market
English-speakers tend to work in sales and services (21.8%), as do French-speakers (22.9%). Proportionately more work in business, finance, and administrative (21.2% versus 18.2% of French-speakers) and management (13.4% versus 8.8%). These occupations usually require a high educational level.
English-speakers do not fare quite as well in the job market as do French-speakers. In 2001, their employment rate was two percentage points lower (58% versus 60% of French-speakers) and their unemployment rate higher by one percentage point (8.7% versus 7.7%). In their job market performance, English-speakers vary by region, generally differing more from French-speakers in the Montréal area and the outlying regions (see explanations below).
Income
Despite a higher unemployment rate, English-speakers generally earn higher incomes than do French-speakers. Their mean income in 2001 was over $4,500 higher ($31,693 versus $27,145 of French-speakers). Proportionately twice as many earned over $75,000 (6.6% versus 3.4% of French-speakers).
The gap between the two language groups is lower in median income ($21,619 versus $21,166 for French-speakers). This is because English-speakers have more individuals with very high incomes. In addition, English-speakers have a higher share of income from sources other than employment or government transfers (15% versus 11% of French-speakers). This "Other income" category includes investment income, retirement pensions and annuities, and other pecuniary income.2
Languages
English-speakers are the language group with the most people who can converse in both French and English. In 2001, over 67% of English-speakers reported that they were bilingual in French and English, as compared to 51% of speakers of other languages and 37% of French-speakers. Bilingualism has risen among English-speakers since 1996, when the rate was 63%.
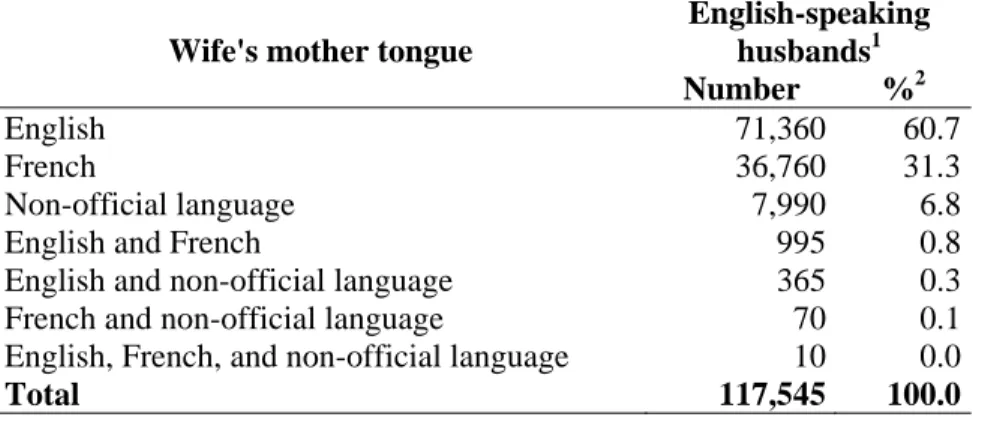
Most English-speakers live with a spouse whose mother tongue is English. This is as true for men (61.3% have an English-speaking wife) as it is for women (60.7% have an English-speaking husband). Almost all (97.4%) use English at home. English is the mother tongue of almost all children under 18 who live in a family where both parents speak it as their mother tongue (97.3%).
The situation is different when French is the mother tongue of one of the two spouses. In these couples, less than 60% of English-speakers most often use English at home. Most children under 18 tend to speak French as their mother tongue (55.7%).
SOCIO-ECONOMIC PORTRAIT OF QUÉBEC'S ENGLISH-SPEAKERS
We will divide Québec's English-speaking communities into three areas, in line with the regional geographic classification of Canada Economic Development.
1) Greater Montréal area
Over 82% of Québec's English-speakers are in the census metropolitan area (CMA) of Montréal (75%) and in the adjacent regions of Montérégie, Laurentides, and Lanaudière. In the Montréal CMA, they make up nearly 13% of the total population.
In these regions, English-speakers are close to French-speakers in median age3 (e.g., 35.7 years old versus 37.8 years old in the Montréal CMA), although proportionately more are in younger age groups (0-19) and older age groups (60 +).
In the greater Montréal area, English-speakers are better educated than French-speakers and more bilingual than the average for Québec's English-speakers. They tend to work more in management occupations than do French-speakers. They earn more on average than do French-speakers and a higher proportion have incomes over $75,000.
In the Montréal CMA, however, English-speakers have a lower employment rate (58.9% versus 63.6% of French-speakers) and a higher unemployment rate (8.2% versus 6.2%). English-speakers who leave Québec tend to be those who are better educated and less subject to unemployment. Thus, within the English-speaking population, 25-34 year-olds were most likely to leave the province from 1996 to 2001 (15.8% out-flow rate). Finally the Montréal CMA took in 83% of the English-speaking immigrants who came to Québec between 1996 and 2001. These newcomers may have trouble integrating into the job market, especially if they cannot carry on a conversation in French or if their degrees are not recognized. Montréal CMA English-speakers nonetheless have an unemployment rate (8.2% in 2001) lower than the average unemployment rate of all Québec regions (8.7% in 2001).
2) Central regions
Of Québec's English-speaking population, nearly 13% inhabit the central regions, mainly Outaouais (6.3%; Gatineau CMA: 5.7%), Estrie (3.7%; Sherbrooke CMA: 1.3%) and Capitale-Nationale (1.6%; Québec City CMA: 1.5%). Relatively few (1.2%) inhabit the other central regions of Chaudière-Appalaches, Mauricie, and Centre-du-Québec.
The Outaouais region has the second largest concentration of English-speakers (14.5% of the region's population), after Montréal Island (17.5%). As a whole, the socio-economic situation of its English-speakers is similar to that of its French-speakers. Over 17.3% of them work in public administration (French-speakers: 21.5%). The two groups have similar age structures and similar education, job market, and income indicators. The bilingualism rate among Outaouais English-speakers is lower than the Québec mean (61.9% versus 65.9%). Over 80% of them most often use English at work.
Proportionately more English-speakers than French-speakers are 40 years of age or older in the regions of Estrie, Capitale-Nationale, Mauricie, and Centre-du-Québec. Whereas 13.6% of English-speakers are 60 years of age or older in all of Québec, the proportion is 28.5% in Mauricie, 24.2% in Estrie, 23.2% in Capitale-Nationale, and 19.2% in Centre-du-Québec.
In these regions, English-speakers are better educated than French-speakers and are notable for their high bilingualism rates (over 80%, except in Estrie (64.9%)). They mainly work in sales and services in most of these regions.
English-speakers vary from one region to the next in job-market performance. In Chaudière-Appalaches and Capitale-Nationale, their employment rates are higher than those of French-speakers and are the highest of all the central regions. In Centre-du-Québec too, their unemployment rate is lower than that of French-speakers. In all three regions, proportionately more English-speakers than French-speakers earn over $60,000 and fewer earn under $20,000. Conversely, in Estrie and Mauricie, they have lower employment rates than do French-speakers and slightly higher unemployment rates. In Estrie, moreover, proportionately more English-speakers than French-speakers earn under $20,000.
3) Outlying regions
Less than 4% of Québec's English-speakers, i.e., 21,740 individuals, inhabit the regions of Gaspésie—Îles-de-la-Madeleine, Côte-Nord, Abitibi-Témiscamingue, Saguenay— Lac-Saint-Jean, Bas-Saint-Laurent, and Nord-du-Québec. Over half the English-speakers of the outlying regions live in Gaspésie—Îles-de-la-Madeleine (8,900 people or 1.6% of Québec's English-speakers) and Côte-Nord (4,850 or 0.8%). Gaspésie—Îles-de-la-Madeleine has one of the highest proportions of English-speakers (9.3% of its population) among Québec's regions. In Côte-Nord, English-speakers are 5% of the population. The other regions have fewer than 2,200 English-speakers, whose proportion of the population ranges from 3.6% in Nord-du-Québec to only 0.4% in Bas-Saint-Laurent.
In the regions of Gaspésie—Îles-de-la-Madeleine and Côte-Nord, the English-speaking and French-speaking populations have very similar age structures. Proportionately more English-speakers are 60 or over in Gaspésie—Îles-de-la-Madeleine than in Côte-Nord (23.3% versus 16%). In Gaspésie—Îles-de-la-Madeleine and Côte-Nord, they are more
concentrated in farming, forestry, and fishing (18.2% and 11.6%) than are their French-speaking counterparts (10.9% and 4%).
These regions have the least educated English-speakers of all of Québec's regions. Over 25% have less than Grade 9. Fewer than half are bilingual.
In these two regions, English-speakers have employment rates lower than those of French-speakers. In Gaspésie—Îles-de-la-Madeleine, their unemployment rate in 2001 (29.5%) was almost eight percentage points higher than that of French-speakers (21.8%). A very high percentage of English-speakers in Gaspésie—Îles-de-la-Madeleine and Côte-Nord earn under $20,000, i.e., 68% and 61.7% respectively, proportions higher than for their French-speaking counterparts (62.1% and 51.8%). English-speakers may not perform as well as French-speakers do job-wise and income-wise because more of them work in farming, forestry, and fishing. These industries are often seasonal and pay relatively low-paying. In Gaspésie—Îles-de-la-Madeleine, English-speakers are more numerous at the top and bottom of the age pyramid. This age structure may account for their lower rate of participation in the labour force, the youngest ones being students and the oldest ones being less active in the job market.
Regional Fact Sheets
Sixteen regional fact sheets are provided in this section. Each fact sheet presents seven indicators that comprehensively and succinctly portray each Québec's regional English-speaking communities, except for Montréal Island and Laval which are included in Montréal CMA. The indicators are taken from the portraits of Québec's regional English-speaking communities in the second part of this report. The fact sheets may be used to compare English-speaking communities from Québec's different regions and from the census metropolitan area. These communities may also be compared with French-speaking communities within the same regions.
English-speaking population / Total population: 572,090 / 7,125,580 8.0%
Proportion of Québec's English-speaking population: 100.0%
Main occupation of English-speakers (>10%)
Sales and services 21.8
Business, finance, and administration 21.2
Management 13.4
%
Âge selon la langue maternelle* (%)
27.9 25.0 29.2 17.8 26.4 27.1 31.6 14.9 0 10 20 30 40 50
0-19 ans 20-39 ans 40-59 ans 60 et +
Connaissance des langues officielles selon la langue maternelle* (%) 30.6 0.5 68.8 0.0 58.9 41.1 0 20 40 60 80 100 Anglais seulement Français seulement Anglais et français
Langue utilisée le plus souvent au travail selon la langue maternelle* (%)
61.9 28.9 9.0 3.8 91.9 4.1 0 20 40 60 80 100
Anglais Français Anglais et français Taux d'activité, taux d'emploi et taux de chômage selon la langue maternelle* (%)
61.2 55.7 9.5 67.1 63.0 6.2 0 20 40 60 80 100
Taux d’activité Taux d’emploi Taux de chômage
Plus haut niveau de scolarité atteint selon la langue maternelle* (%)
8.1 38.5 9.5 23.9 20.0 14.1 36.3 11.2 22.5 15.9 0 10 20 30 40 50
8e année et - 9e à 13e année École de métiers Collégial Universitaire
Composition revenu total en 2000 pop. 15 ans et + selon la langue maternelle* (%)
71.6 15.9 12.5 76.3 13.2 10.5 0 20 40 60 80 100
Revenu d'emploi Transferts gouv. Autre
English
16-Montérégie
*
Âge selon la langue maternelle* (%)15.6 27.8 33.4 23.2 21.9 32.0 18.1 28.0 0 10 20 30 40 50
0-19 ans 20-39 ans 40-59 ans 60 et +
Connaissance des langues officielles selon la langue maternelle* (%) 6.7 3.7 89.4 0.0 69.7 30.3 0 20 40 60 80 100 Anglais seulement Français seulement Anglais et français
Langue utilisée le plus souvent au travail selon la langue maternelle* (%)
28.2 63.8 7.7 1.4 96.7 1.8 0 20 40 60 80 100
Anglais Français Anglais et français Taux d'activité, taux d'emploi et taux de chômage selon la langue maternelle* (%)
63.9 65 4.3 62.7 57.0 9.2 0 20 40 60 80 100
Taux d’activité Taux d’emploi Taux de chômage
Plus haut niveau de scolarité atteint selon la langue maternelle* (%)
8.2 30.8 8.9 19.5 32.6 12.6 31.6 11.3 23.8 20.7 0 10 20 30 40 50
8e année et - 9e à 13e année École de métiers Collégial Universitaire
Composition revenu total en 2000 pop. 15 ans et + selon la langue maternelle* (%)
69.3 15.9 15.1 73.9 15.7 10.4 0 20 40 60 80 100 Revenu d'emploi Transferts gouv. Autre French 03 Capitale-Nationale
*
Âge selon la langue maternelle* (%)
27.9 25.0 29.2 17.8 26.4 27.1 31.6 14.9 0 10 20 30 40 50
0-19 ans 20-39 ans 40-59 ans 60 et +
Connaissance des langues officielles selon la langue maternelle* (%) 30.6 0.5 68.8 0.0 58.9 41.1 0 50 100 Anglais seulement Français seulement Anglais et français
Langue utilisée le plus souvent au travail selon la langue maternelle* (%)
61.9 28.9 9.0 3.8 91.9 4.1 0 20 40 60 80 100
Anglais Français Anglais et français Taux d'activité, taux d'emploi et taux de chômage selon la langue maternelle* (%)
61.2 55.7 9.5 67.1 63.0 6.2 0 20 40 60 80 100
Taux d’activité Taux d’emploi Taux de chômage
Plus haut niveau de scolarité atteint selon la langue maternelle* (%)
8.1 38.5 9.5 23.9 20.0 14.1 36.3 11.2 22.5 15.9 0 10 20 30 40 50
8e année et - 9e à 13e année École de métiers Collégial Universitaire
Composition revenu total en 2000 pop. 15 ans et + selon la langue maternelle* (%)
71.6 15.9 12.5 76.3 13.2 10.5 0 20 40 60 80 100 Revenu d'emploi Transferts gouv. Autre 16-Montérégie
*
Age by mother tongue* (%)
13.6 23.7 20.3 42.4 26.6 12.0 18.2 43.2 0 10 20 30 40 50 0-19 20-39 40-59 60+
Knowledge of official languages by mother tongue* (%) 33.4 0.6 65.9 0.0 63.3 36.7 0 25 50 75 100
English only French only English and French
Main working language by mother tongue* (%) 68.7 21.8 8.9 4.3 91.9 3.7 0 20 40 60 80 100
English French English and French Participation rate, employment rate, and unemployment rate by mother tongue* (%)
63.0 58.0 8.7 7.7 60.0 65.0 0 20 40 60 80 100
Participation Employment Unemployment
Highest educational level by mother tongue* (%)
8.0 33.2 7.8 23.0 28.0 15.1 34.7 11.4 21.9 16.9 0 10 20 30 40 50
Grade 8 and - Grades 9 to 13 Trade school CEGEP University
Total income composition in 2000 pop. 15 years old and over by mother tongue* (%)
12.0 15.0 73.2 11.0 13.7 75.7 0 20 40 60 80 100 Employment income Government transfers Other All of Québec
*
English-speaking population / Total population: 427,166 / 3,346,090** 12.8%
Proportion of Québec's English-speaking population: 74,7%***
Main occupations of English-speakers (>10%)
Business, finance, and administration 22.7
Sales and services 21.9
Management 14.4
** Montréal area (06) : 312,245 / 1,782,380 17.5% *** Montréal area (06) : 54.6%
%
Âge selon la langue maternelle* (%)
27.9 25.0 29.2 17.8 26.4 27.1 31.6 14.9 0 10 20 30 40 50
0-19 ans 20-39 ans 40-59 ans 60 et +
Connaissance des langues officielles selon la langue maternelle* (%) 30.6 0.5 68.8 0.0 58.9 41.1 0 20 40 60 80 100 Anglais seulement Français seulement Anglais et français
Langue utilisée le plus souvent au travail selon la langue maternelle* (%)
61.9 28.9 9.0 3.8 91.9 4.1 0 20 40 60 80 100
Anglais Français Anglais et français Taux d'activité, taux d'emploi et taux de chômage selon la langue maternelle* (%)
61.2 55.7 9.5 67.1 63.0 6.2 0 20 40 60 80 100
Taux d’activité Taux d’emploi Taux de chômage
Plus haut niveau de scolarité atteint selon la langue maternelle* (%)
8.1 38.5 9.5 23.9 20.0 14.1 36.3 11.2 22.5 15.9 0 10 20 30 40 50
8e année et - 9e à 13e année École de métiers Collégial Universitaire
Composition revenu total en 2000 pop. 15 ans et + selon la langue maternelle* (%)
71.6 15.9 12.5 76.3 13.2 10.5 0 20 40 60 80 100
Revenu d'emploi Transferts gouv. Autre
English French 16-Montérégie
*
Âge selon la langue maternelle* (%)15.6 27.8 33.4 23.2 21.9 32.0 18.1 28.0 0 10 20 30 40 50
0-19 ans 20-39 ans 40-59 ans 60 et +
Connaissance des langues officielles selon la langue maternelle* (%) 6.7 3.7 89.4 0.0 69.7 30.3 0 20 40 60 80 100 Anglais seulement Français seulement Anglais et français
Langue utilisée le plus souvent au travail selon la langue maternelle* (%)
28.2 63.8 7.7 1.4 96.7 1.8 0 20 40 60 80 100
Anglais Français Anglais et français Taux d'activité, taux d'emploi et taux de chômage selon la langue maternelle* (%)
63.9 65 4.3 62.7 57.0 9.2 0 20 40 60 80 100
Taux d’activité Taux d’emploi Taux de chômage
Plus haut niveau de scolarité atteint selon la langue maternelle* (%)
8.2 30.8 8.9 19.5 32.6 12.6 31.6 11.3 23.8 20.7 0 10 20 30 40 50
8e année et - 9e à 13e année École de métiers Collégial Universitaire
Composition revenu total en 2000 pop. 15 ans et + selon la langue maternelle* (%)
69.3 15.9 15.1 73.9 15.7 10.4 0 20 40 60 80 100 Revenu d'emploi Transferts gouv. Autre 03 Capitale-Nationale
*
Âge selon la langue maternelle* (%)
27.9 25.0 29.2 17.8 26.4 27.1 31.6 14.9 0 10 20 30 40 50
0-19 ans 20-39 ans 40-59 ans 60 et +
Connaissance des langues officielles selon la langue maternelle* (%) 30.6 0.5 68.8 0.0 58.9 41.1 0 50 100 Anglais seulement Français seulement Anglais et français
Langue utilisée le plus souvent au travail selon la langue maternelle* (%)
61.9 28.9 9.0 3.8 91.9 4.1 0 20 40 60 80 100
Anglais Français Anglais et français Taux d'activité, taux d'emploi et taux de chômage selon la langue maternelle* (%)
61.2 55.7 9.5 67.1 63.0 6.2 0 20 40 60 80 100
Taux d’activité Taux d’emploi Taux de chômage
Plus haut niveau de scolarité atteint selon la langue maternelle* (%)
8.1 38.5 9.5 23.9 20.0 14.1 36.3 11.2 22.5 15.9 0 10 20 30 40 50
8e année et - 9e à 13e année École de métiers Collégial Universitaire
Composition revenu total en 2000 pop. 15 ans et + selon la langue maternelle* (%)
71.6 15.9 12.5 76.3 13.2 10.5 0 20 40 60 80 100 Revenu d'emploi Transferts gouv. Autre 16-Montérégie
*
Age by mother tongue* (%)
17.0 26.2 28.2 28.6 30.1 15.7 24.8 29.4 0 10 20 30 40 50 0-19 20-39 40-59 60+
Knowledge of official languages by mother tongue* (%) 31.3 0.5 68.1 0.1 49.5 50.3 0 25 50 75 100
English only French only English and French
Main working language by mother tongue* (%) 69.6 19.6 10.2 6.2 87.9 5.7 0 20 40 60 80 100
English French English and French Participation rate, employment rate, and unemployment rate by mother tongue* (%)
64.2 58.9 8.2 6.2 63.6 67.8 0 20 40 60 80 100
Participation Employment Unemployment
Highest educational level by mother tongue* (%)
6.3 30.7 7.2 24.2 31.5 12.3 32.7 10.0 23.3 21.6 0 10 20 30 40 50
Grade 8 and - Grades 9 to 13 Trade school CEGEP University
Total income composition in 2000 pop. 15 years old and over by mother tongue* (%)
10.8 14.810.6 74.3 11.4 77.9 0 20 40 60 80 100 Employment income Government transfers Other 1. Montréal CMA
*
English-speaking population / Total population: 101,205 / 1,260,165 8.0%
Proportion of Québec's English-speaking population: 17.7%
Main occupations of English-speakers (>10%)
Business, finance, and administration 22.1
Sales and services 21.1
Management 12.8
Trades, transport, and equipment 12.7 % Age by mother tongue* (%)
27.9 25.0 29.2 17.8 26.4 27.1 31.6 14.9 0 10 20 30 40 50 0-19 20-39 40-59 60+
Knowledge of official languages by mother tongue* (%) 30.6 0.5 68.8 0.0 58.9 41.1 0 25 50 75 100
English only French only English and French
Language most often used at work by mother tongue* (%) 61.9 28.9 9.0 3.8 91.9 4.1 0 20 40 60 80 100
English French English and French
Participation rate, employment rate, and unemployment rate by mother tongue* (%)
62.5 57.8 7.5 68.2 64.3 5.8 0 20 40 60 80 100
Participation Employment Unemployment
Highest educational level by mother tongue* (%)
8.1 38.5 9.5 23.9 20.0 14.1 36.3 11.2 22.5 15.9 0 10 20 30 40 50
Grade 8 and - Grades 9 to 13 Trade school CEGEP University
Total income composition in 2000 pop. 15 years old and over by mother tongue* (%)
73.4 13.1 13.5 77.8 11.7 10.4 0 20 40 60 80 100 Employment income Government transfers Other English French 2. Montérégie
*
English-speaking population / Total population: 36,320 / 250,535 14.5%
Proportion of Québec's English-speaking population: 6.3%
Main occupations of English-speakers (>10%)
Business, finance, and administration 21.2
Sales and services 21.2
Trades, transport, and equipment 12.5
Management 11.8
% Age by mother tongue* (%)
27.8 27.3 30.2 14.7 26.5 28.7 31.0 13.8 0 10 20 30 40 50 0-19 20-39 40-59 60+
Knowledge of official languages by mother tongue* (%) 38.0 0.1 61.9 0.4 46.5 53.1 0 25 50 75 100
English only French only English and French
Language most often used at work by mother tongue* (%) 82.7 11.5 5.7 22.0 70.3 7.7 0 20 40 60 80 100
English French English and French
Participation rate, employment rate, and unemployment rate by mother tongue* (%)
67.4 62.4 7.4 68.6 64.6 5.8 0 20 40 60 80 100
Participation Employment Unemployment
Highest educational level by mother tongue* (%)
9.7 37.2 9.1 23.0 21.0 13.9 35.6 9.3 21.7 19.4 0 10 20 30 40 50
Grade 8 and - Grades 9 to 13 Trade school CEGEP University
Total income composition in 2000 pop. 15 years old and over by mother tongue* (%)
75.9 12.9 11.4 78.5 12.1 9.4 0 20 40 60 80 100 Employment income Government transfers Other English French 3. Outaouais
*
English-speaking population / Total population: 24,765 / 454,525 5.4%
Proportion of Québec's English-speaking population: 4.3%
Main occupations of English-speakers (>10%)
Sales and services 23.1
Business, finance, and administration 20.1
Management 14.9
Trades, transport, and equipment 13.9 % Age by mother tongue* (%)
22.9 24.0 32.0 21.0 27.3 31.2 14.2 27.3 0 10 20 30 40 50 0-19 20-39 40-59 60+
Knowledge of official languages by mother tongue* (%) 24.6 1.0 74.3 0.0 59.9 40.1 0 25 50 75 100
English only French only English and French
Language most often used at work by mother tongue* (%) 54.4 34.2 11.0 3.5 91.8 4.6 0 20 40 60 80 100
English French English and French
Participation rate, employment rate, and unemployment rate by mother tongue* (%)
60.6 54.8 9.6 67.5 62.9 6.8 0 20 40 60 80 100
Participation Employment Unemployment
Highest educational level by mother tongue* (%)
9.0 40.0 8.8 22.3 19.9 14.4 38.1 12.0 21.4 14.1 0 10 20 30 40 50
Grade 8 and - Grades 9 to 13 Trade school CEGEP University
Total income composition in 2000 pop. 15 years old and over by mother tongue* (%)
70.2 14.3 15.3 76.7 13.1 10.3 0 20 40 60 80 100 Employment income Government transfers Other English French 4. Laurentides
*
English-speaking population / Total population: 21,320 / 279,705 7.6%
Proportion of Québec's English-speaking population: 3.7%
Main occupations of English-speakers (>10%)
Sales and services 20.8
Processing, manufacturing, and public utilities
Business, finance, and administration 14.1
Trades, transport, and equipment 14.0 14.2 % Age by mother tongue* (%)
23.525.4 27.0 30.7 24.2 17.0 29.3 23.2 0 10 20 30 40 50 0-19 20-39 40-59 60+
Knowledge of official languages by mother tongue* (%) 34.2 0.6 64.9 0.0 64.9 35.1 0 25 50 75 100
English only French only English and French
Language most often used at work by mother tongue* (%) 60.5 31.8 7.5 2.3 95.2 2.5 0 20 40 60 80 100
English French English and French
Participation rate, employment rate, and unemployment rate by mother tongue* (%)
55.8 51.6 7.6 65.5 61.1 6.6 0 20 40 60 80 100
Participation Employment Unemployment
Highest educational level by mother tongue* (%)
14.2 40.6 9.4 18.5 17.2 16.6 35.1 12.6 20.7 15.0 0 10 20 30 40 50
Grade 8 and - Grades 9 to 13 Trade school CEGEP University
Total income composition in 2000 pop. 15 years old and over by mother tongue* (%)
62.9 20.5 16.7 73.2 15.4 11.3 0 20 40 60 80 100 Employment income Government transfers Other English French 5. Estrie
*
English-speaking population / Total population: 9,265 / 628,510 1.5%
Proportion of Québec's English-speaking population: 1.6%
Main occupations of English-speakers (>10%)
Sales and services 25.8
Social sciences, education, public administration, and religion
Business, finance, and administration 15.2
Management 10.8
18.7 %
Âge selon la langue maternelle* (%)
27.9 25.0 29.2 17.8 26.4 27.1 31.6 14.9 0.0 10.0 20.0 30.0 40.0 50.0 0-19 20-39 40-59 60+
Connaissance des langues officielles selon la langue maternelle* (%) 30.6 0.5 68.8 0.0 58.9 41.1 0 20 40 60 80 100
English only French only English and French
Langue utilisée le plus souvent au travail selon la langue maternelle* (%)
61.9 28.9 9.0 3.8 91.9 4.1 0 20 40 60 80 100
English French English and French Taux d'activité, taux d'emploi et taux de chômage selon la langue maternelle* (%)
62.5 57.8 7.5 68.2 64.3 5.8 0 20 40 60 80 100
Participation Employment Unemployment
Plus haut niveau de scolarité atteint selon la langue maternelle* (%)
8.1 38.5 9.5 23.9 20.0 14.1 36.3 11.2 22.5 15.9 0 10 20 30 40 50
Grade 8 and - Grades 9 to 13 Trade school CEGEP University
Composition revenu total en 2000 pop. 15 ans et + selon la langue maternelle* (%)
73.4 13.1 13.5 77.8 11.7 10.4 0 20 40 60 80 100 Employment income Government transfers Other English French 16-Montérégie
*
Age by mother tongue* (%)
27.8 33.4 23.2 21.9 18.1 15.6 28.0 32.0 0 10 20 30 40 50 0-19 20-39 40-59 60+
Knowledge of official languages by mother tongue* (%) 6.7 3.7 89.4 0.0 69.7 30.3 0 25 50 75 100
English only French only English and French
Language most often used at work by mother tongue* (%) 28.2 63.8 7.7 1.4 96.7 1.8 0 20 40 60 80 100
English French English and French
Participation rate, employment rate, and unemployment rate by mother tongue* (%)
63.8 59.5 6.8 63.8 59.0 7.5 0 20 40 60 80 100
Participation Employment Unemployment
Highest educational level by mother tongue* (%)
8.2 30.8 8.9 19.5 32.6 12.6 31.6 11.3 23.8 20.7 0 10 20 30 40 50
Grade 8 and - Grades 9 to 13 Trade school CEGEP University
Total income composition in 2000 pop. 15 years old and over by mother tongue* (%)
71.8 12.9 15.7 74.1 13.8 12.4 0 20 40 60 80 100 Employment income Government transfers Other 6. Capitale-Nationale
*
English-speaking population / Total population: 8,905 / 95,460 9.3%
Proportion of Québec's English-speaking population: 1.6%
Main occupations of English-speakers (>10%)
Sales and services 23.4
Resource industry occupations
Trades, transport, and equipment 16.6
Business, finance, and administration 11.2
Social sciences, education, public administration, and religion
%
17.4
10.7
Âge selon la langue maternelle* (%)
27.9 25.0 29.2 17.8 26.4 27.1 31.6 14.9 0.0 10.0 20.0 30.0 40.0 50.0 0-19 20-39 40-59 60+
Connaissance des langues officielles selon la langue maternelle* (%) 30.6 0.5 68.8 0.0 58.9 41.1 0 20 40 60 80 100
English only French only English and French
Langue utilisée le plus souvent au travail selon la langue maternelle* (%)
61.9 28.9 9.0 3.8 91.9 4.1 0 20 40 60 80 100
English French English and French Taux d'activité, taux d'emploi et taux de chômage selon la langue maternelle* (%)
62.5 57.8 7.5 68.2 64.3 5.8 0 20 40 60 80 100
Participation Employment Unemployment
Plus haut niveau de scolarité atteint selon la langue maternelle* (%)
8.1 38.5 9.5 23.9 20.0 14.1 36.3 11.2 22.5 15.9 0 10 20 30 40 50
Grade 8 and - Grades 9 to 13 Trade school CEGEP University
Composition revenu total en 2000 pop. 15 ans et + selon la langue maternelle* (%)
73.4 13.1 13.5 77.8 11.7 10.4 0 20 40 60 80 100 Employment income Government transfers Other English French 16-Montérégie
*
Âge selon la langue maternelle* (%)15.6 27.8 33.4 23.2 21.9 32.0 18.1 28.0 0.0 10.0 20.0 30.0 40.0 50.0 0-19 20-39 40-59 60+
Connaissance des langues officielles selon la langue maternelle* (%) 6.7 3.7 89.4 0.0 69.7 30.3 0 20 40 60 80 100
English only French only English and French
Langue utilisée le plus souvent au travail selon la langue maternelle* (%)
28.2 63.8 7.7 1.4 96.7 1.8 0 20 40 60 80 100
English French English and French Taux d'activité, taux d'emploi et taux de chômage selon la langue maternelle* (%)
63.8 59.5 6.8 63.8 59.0 7.5 0 20 40 60 80 100
Participation Employment Unemployment
Plus haut niveau de scolarité atteint selon la langue maternelle* (%)
8.2 30.8 8.9 19.5 32.6 12.6 31.6 11.3 23.8 20.7 0 10 20 30 40 50
Grade 8 and - Grades 9 to 13 Trade school CEGEP University
Composition revenu total en 2000 pop. 15 ans et + selon la langue maternelle* (%)
71.8 12.9 15.7 74.1 13.8 12.4 0 20 40 60 80 100 Employment income Government transfers Other 03 Capitale-Nationale
*
Âge selon la langue maternelle* (%)
27.9 25.0 29.2 17.8 26.4 27.1 31.6 14.9 0.0 10.0 20.0 30.0 40.0 50.0 0-19 20-39 40-59 60+
Connaissance des langues officielles selon la langue maternelle* (%) 30.6 0.5 68.8 0.0 58.9 41.1 0 50 100
English only French only English and French
Langue utilisée le plus souvent au travail selon la langue maternelle* (%)
61.9 28.9 9.0 3.8 91.9 4.1 0 20 40 60 80 100
English French English and French Taux d'activité, taux d'emploi et taux de chômage selon la langue maternelle* (%)
62.5 57.8 7.5 68.2 64.3 5.8 0 20 40 60 80 100 P a rt ic ip a tio n Empl oy me nt Unempl oy ment
Plus haut niveau de scolarité atteint selon la langue maternelle* (%)
8.1 38.5 9.5 23.9 20.0 14.1 36.3 11.2 22.5 15.9 0 10 20 30 40 50
Grade 8 and - Grades 9 to 13 Trade school CEGEP University
Composition revenu total en 2000 pop. 15 ans et + selon la langue maternelle* (%)
73.4 13.1 13.5 77.8 11.7 10.4 0 20 40 60 80 100 Employment income Government transfers Other 16-Montérégie
*
Age by mother tongue* (%)
23.3 29.6 25.5 21.6 33.8 19.7 23.1 23.5 0 10 20 30 40 50 0-19 20-39 40-59 60+
Knowledge of official languages by mother tongue* (%) 54.9 0.6 44.5 0.0 80.8 19.2 0 25 50 75 100
English only French only English and French
Language most often used at work by mother tongue* (%) 63.6 30.0 6.2 1.1 96.5 2.4 0 20 40 60 80 100
English French English and French Participation rate, employment rate, and unemployment rate by mother tongue* (%)
29.5 42.6 32.9 46.7 21.8 54.4 0 20 40 60 80 100
Participation Employment Unemployment
Highest educational level by mother tongue* (%)
25.2 43.6 7.8 14.4 9.2 26.4 36.0 10.7 18.1 8.8 0 10 20 30 40 50
Grade 8 and - Grades 9 to 13 Trade school CEGEP University
Total income composition in 2000 pop. 15 years old and over by mother tongue* (%)
56.0 33.8 10.6 8.0 26.5 65.6 0 20 40 60 80 100 Employment income Government transfers Other 7. Gaspésie—Îles-de-la-Madeleine
*
English-speaking population / Total population: 6,680 / 383,350 1.7%
Proportion of Québec's English-speaking population: 1.2%
Main occupations of English-speakers (>10%)
Business, finance, and administration 22.1
Sales and services 21.0
Trades, transport, and equipment 18.6
Management 12.8
%
Âge selon la langue maternelle* (%)
27.9 25.0 29.2 17.8 26.4 27.1 31.6 14.9 0.0 10.0 20.0 30.0 40.0 50.0 0-19 20-39 40-59 60+
Connaissance des langues officielles selon la langue maternelle* (%) 30.6 0.5 68.8 0.0 58.9 41.1 0 20 40 60 80 100
English only French only English and French
Langue utilisée le plus souvent au travail selon la langue maternelle* (%)
61.9 28.9 9.0 3.8 91.9 4.1 0 20 40 60 80 100
English French English and French Taux d'activité, taux d'emploi et taux de chômage selon la langue maternelle* (%)
62.5 57.8 7.5 68.2 64.3 5.8 0 20 40 60 80 100
Participation Employment Unemployment
Plus haut niveau de scolarité atteint selon la langue maternelle* (%)
8.1 38.5 9.5 23.9 20.0 14.1 36.3 11.2 22.5 15.9 0 10 20 30 40 50
Grade 8 and - Grades 9 to 13 Trade school CEGEP University
Composition revenu total en 2000 pop. 15 ans et + selon la langue maternelle* (%)
73.4 13.1 13.5 77.8 11.7 10.4 0 20 40 60 80 100 Employment income Government transfers Other English French 16-Montérégie
*
Âge selon la langue maternelle* (%)15.6 27.8 33.4 23.2 21.9 32.0 18.1 28.0 0.0 10.0 20.0 30.0 40.0 50.0 0-19 20-39 40-59 60+
Connaissance des langues officielles selon la langue maternelle* (%) 6.7 3.7 89.4 0.0 69.7 30.3 0 20 40 60 80 100
English only French only English and French
Langue utilisée le plus souvent au travail selon la langue maternelle* (%)
28.2 63.8 7.7 1.4 96.7 1.8 0 20 40 60 80 100
English French English and French Taux d'activité, taux d'emploi et taux de chômage selon la langue maternelle* (%)
63.8 59.5 6.8 63.8 59.0 7.5 0 20 40 60 80 100
Participation Employment Unemployment
Plus haut niveau de scolarité atteint selon la langue maternelle* (%)
8.2 30.8 8.9 19.5 32.6 12.6 31.6 11.3 23.8 20.7 0 10 20 30 40 50
Grade 8 and - Grades 9 to 13 Trade school CEGEP University
Composition revenu total en 2000 pop. 15 ans et + selon la langue maternelle* (%)
71.8 12.9 15.7 74.1 13.8 12.4 0 20 40 60 80 100 Employment income Government transfers Other 03 Capitale-Nationale
*
Âge selon la langue maternelle* (%)
27.9 25.0 29.2 17.8 26.4 27.1 31.6 14.9 0.0 10.0 20.0 30.0 40.0 50.0 0-19 20-39 40-59 60+
Connaissance des langues officielles selon la langue maternelle* (%) 30.6 0.5 68.8 0.0 58.9 41.1 0 50 100
English only French only English and French
Langue utilisée le plus souvent au travail selon la langue maternelle* (%)
61.9 28.9 9.0 3.8 91.9 4.1 0 20 40 60 80 100
English French English and French Taux d'activité, taux d'emploi et taux de chômage selon la langue maternelle* (%)
62.5 57.8 7.5 68.2 64.3 5.8 0 20 40 60 80 100 P a rt ic ip a tio n Empl oy me nt Unempl oy ment
Plus haut niveau de scolarité atteint selon la langue maternelle* (%)
8.1 38.5 9.5 23.9 20.0 14.1 36.3 11.2 22.5 15.9 0 10 20 30 40 50
Grade 8 and - Grades 9 to 13 Trade school CEGEP University
Composition revenu total en 2000 pop. 15 ans et + selon la langue maternelle* (%)
73.4 13.1 13.5 77.8 11.7 10.4 0 20 40 60 80 100 Employment income Government transfers Other 16-Montérégie
*
Age by mother tongue* (%)
18.8 37.4 18.1 25.8 31.7 14.2 27.9 26.2 0 10 20 30 40 50 0-19 20-39 40-59 60+
Knowledge of official languages by mother tongue* (%) 11.2 3.1 85.6 0.0 69.0 31.0 0 25 50 75 100
English only French only English and French
Language most often used at work by mother tongue* (%) 28.9 57.6 12.9 2.0 95.2 2.7 0 20 40 60 80 100
English French English and French Participation rate, employment rate, and unemployment rate by mother tongue* (%)
59.9 55.1 7.9 6.6 61.5 65.9 0 20 40 60 80 100
Participation Employment Unemployment
Highest educational level by mother tongue* (%)
14.1 43.6 9.1 21.2 12.1 15.9 39.8 12.5 20.5 11.3 0 10 20 30 40 50
Grade 8 and - Grades 9 to 13 Trade school CEGEP University
Total income composition in 2000 pop. 15 years old and over by mother tongue* (%)
69.6 17.313.9 13.4 9.7 76.4 0 20 40 60 80 100 Employment income Government transfers Other 8. Lanaudière
*
English-speaking population / Total population: 4,850 / 96,910 5.0%
Proportion of Québec's English-speaking population: 0.8%
Main occupations of English-speakers (>10%)
Sales and services 23.8
Trades, transport, and equipment 16.6
Resource industry occupations
Processing, manufacturing, and public utilities
Business, finance, and administration 11.0 %
13.2
11.9
Âge selon la langue maternelle* (%)
27.9 25.0 29.2 17.8 26.4 27.1 31.6 14.9 0 10 20 30 40 50
0-19 ans 20-39 ans 40-59 ans 60 et +
Connaissance des langues officielles selon la langue maternelle* (%) 30.6 0.5 68.8 0.0 58.9 41.1 0 20 40 60 80 100 Anglais seulement Français seulement Anglais et français
Langue utilisée le plus souvent au travail selon la langue maternelle* (%)
61.9 28.9 9.0 3.8 91.9 4.1 0 20 40 60 80 100
Anglais Français Anglais et français Taux d'activité, taux d'emploi et taux de chômage selon la langue maternelle* (%)
61.2 55.7 9.5 67.1 63.0 6.2 0 20 40 60 80 100
Taux d’activité Taux d’emploi Taux de chômage
Plus haut niveau de scolarité atteint selon la langue maternelle* (%)
8.1 38.5 9.5 23.9 20.0 14.1 36.3 11.2 22.5 15.9 0 10 20 30 40 50
8e année et - 9e à 13e année École de métiers Collégial Universitaire
Composition revenu total en 2000 pop. 15 ans et + selon la langue maternelle* (%)
71.6 15.9 12.5 76.3 13.2 10.5 0 20 40 60 80 100
Revenu d'emploi Transferts gouv. Autre
English French 16-Montérégie
*
Âge selon la langue maternelle* (%)15.6 27.8 33.4 23.2 21.9 32.0 18.1 28.0 0 10 20 30 40 50
0-19 ans 20-39 ans 40-59 ans 60 et +
Connaissance des langues officielles selon la langue maternelle* (%) 6.7 3.7 89.4 0.0 69.7 30.3 0 20 40 60 80 100 Anglais seulement Français seulement Anglais et français
Langue utilisée le plus souvent au travail selon la langue maternelle* (%)
28.2 63.8 7.7 1.4 96.7 1.8 0 20 40 60 80 100
Anglais Français Anglais et français Taux d'activité, taux d'emploi et taux de chômage selon la langue maternelle* (%)
63.9 65 4.3 62.7 57.0 9.2 0 20 40 60 80 100
Taux d’activité Taux d’emploi Taux de chômage
Plus haut niveau de scolarité atteint selon la langue maternelle* (%)
8.2 30.8 8.9 19.5 32.6 12.6 31.6 11.3 23.8 20.7 0 10 20 30 40 50
8e année et - 9e à 13e année École de métiers Collégial Universitaire
Composition revenu total en 2000 pop. 15 ans et + selon la langue maternelle* (%)
69.3 15.9 15.1 73.9 15.7 10.4 0 20 40 60 80 100 Revenu d'emploi Transferts gouv. Autre 03 Capitale-Nationale
*
Âge selon la langue maternelle* (%)
27.9 25.0 29.2 17.8 26.4 27.1 31.6 14.9 0 10 20 30 40 50
0-19 ans 20-39 ans 40-59 ans 60 et +
Connaissance des langues officielles selon la langue maternelle* (%) 30.6 0.5 68.8 0.0 58.9 41.1 0 50 100 Anglais seulement Français seulement Anglais et français
Langue utilisée le plus souvent au travail selon la langue maternelle* (%)
61.9 28.9 9.0 3.8 91.9 4.1 0 20 40 60 80 100
Anglais Français Anglais et français Taux d'activité, taux d'emploi et taux de chômage selon la langue maternelle* (%)
61.2 55.7 9.5 67.1 63.0 6.2 0 20 40 60 80 100
Taux d’activité Taux d’emploi Taux de chômage
Plus haut niveau de scolarité atteint selon la langue maternelle* (%)
8.1 38.5 9.5 23.9 20.0 14.1 36.3 11.2 22.5 15.9 0 10 20 30 40 50
8e année et - 9e à 13e année École de métiers Collégial Universitaire
Composition revenu total en 2000 pop. 15 ans et + selon la langue maternelle* (%)
71.6 15.9 12.5 76.3 13.2 10.5 0 20 40 60 80 100 Revenu d'emploi Transferts gouv. Autre 16-Montérégie
*
Age by mother tongue* (%)
16.0 28.8 24.7 30.5 33.0 14.3 25.3 27.3 0 10 20 30 40 50 0-19 20-39 40-59 60+
Knowledge of official languages by mother tongue* (%) 63.0 1.1 35.8 0.0 81.2 18.8 0 25 50 75 100
English only French only English and French
Language most often used at work by mother tongue* (%) 75.0 20.6 4.3 0.9 97.2 1.7 0 20 40 60 80 100
English French English and French Participation rate, employment rate, and unemployment rate by mother tongue* (%)
41.4 31.5 63.1 13.8 60.4 54.4 0 20 40 60 80 100
Participation Employment Unemployment
Highest educational level by mother tongue* (%)
28.8 40.9 9.9 12.2 7.8 18.5 37.4 13.6 20.7 9.7 0 10 20 30 40 50
Grade 8 and - Grades 9 to 13 Trade school CEGEP University
Total income composition in 2000 pop. 15 years old and over by mother tongue* (%)
4.6 79.3 13.9 7.1 28.4 66.7 0 20 40 60 80 100 Employment income Government transfers Other 9. Côte-Nord
*
English-speaking population / Total population: 2,625 /376,565 0.7%
Proportion of Québec's English-speaking population: 0.5%
Main occupations of English-speakers (>10%)
Sales and services 23.3
Business, finance, and administration 20.5
Social sciences, education, public administration, and religion
Trades, transport, and equipment 11.5 12.1 %
Âge selon la langue maternelle* (%)
27.9 25.0 29.2 17.8 26.4 27.1 31.6 14.9 0 10 20 30 40 50
0-19 ans 20-39 ans 40-59 ans 60 et +
Connaissance des langues officielles selon la langue maternelle* (%) 30.6 0.5 68.8 0.0 58.9 41.1 0 20 40 60 80 100 Anglais seulement Français seulement Anglais et français
Langue utilisée le plus souvent au travail selon la langue maternelle* (%)
61.9 28.9 9.0 3.8 91.9 4.1 0 20 40 60 80 100
Anglais Français Anglais et français Taux d'activité, taux d'emploi et taux de chômage selon la langue maternelle* (%)
61.2 55.7 9.5 67.1 63.0 6.2 0 20 40 60 80 100
Taux d’activité Taux d’emploi Taux de chômage
Plus haut niveau de scolarité atteint selon la langue maternelle* (%)
8.1 38.5 9.5 23.9 20.0 14.1 36.3 11.2 22.5 15.9 0 10 20 30 40 50
8e année et - 9e à 13e année École de métiers Collégial Universitaire
Composition revenu total en 2000 pop. 15 ans et + selon la langue maternelle* (%)
71.6 15.9 12.5 76.3 13.2 10.5 0 20 40 60 80 100
Revenu d'emploi Transferts gouv. Autre
English French 16-Montérégie
*
Âge selon la langue maternelle* (%)15.6 27.8 33.4 23.2 21.9 32.0 18.1 28.0 0 10 20 30 40 50
0-19 ans 20-39 ans 40-59 ans 60 et +
Connaissance des langues officielles selon la langue maternelle* (%) 6.7 3.7 89.4 0.0 69.7 30.3 0 20 40 60 80 100 Anglais seulement Français seulement Anglais et français
Langue utilisée le plus souvent au travail selon la langue maternelle* (%)
28.2 63.8 7.7 1.4 96.7 1.8 0 20 40 60 80 100
Anglais Français Anglais et français Taux d'activité, taux d'emploi et taux de chômage selon la langue maternelle* (%)
63.9 65 4.3 62.7 57.0 9.2 0 20 40 60 80 100
Taux d’activité Taux d’emploi Taux de chômage
Plus haut niveau de scolarité atteint selon la langue maternelle* (%)
8.2 30.8 8.9 19.5 32.6 12.6 31.6 11.3 23.8 20.7 0 10 20 30 40 50
8e année et - 9e à 13e année École de métiers Collégial Universitaire
Composition revenu total en 2000 pop. 15 ans et + selon la langue maternelle* (%)
69.3 15.9 15.1 73.9 15.7 10.4 0 20 40 60 80 100 Revenu d'emploi Transferts gouv. Autre 03 Capitale-Nationale
*
Âge selon la langue maternelle* (%)
27.9 25.0 29.2 17.8 26.4 27.1 31.6 14.9 0 10 20 30 40 50
0-19 ans 20-39 ans 40-59 ans 60 et +
Connaissance des langues officielles selon la langue maternelle* (%) 30.6 0.5 68.8 0.0 58.9 41.1 0 50 100 Anglais seulement Français seulement Anglais et français
Langue utilisée le plus souvent au travail selon la langue maternelle* (%)
61.9 28.9 9.0 3.8 91.9 4.1 0 20 40 60 80 100
Anglais Français Anglais et français Taux d'activité, taux d'emploi et taux de chômage selon la langue maternelle* (%)
61.2 55.7 9.5 67.1 63.0 6.2 0 20 40 60 80 100
Taux d’activité Taux d’emploi Taux de chômage
Plus haut niveau de scolarité atteint selon la langue maternelle* (%)
8.1 38.5 9.5 23.9 20.0 14.1 36.3 11.2 22.5 15.9 0 10 20 30 40 50
8e année et - 9e à 13e année École de métiers Collégial Universitaire
Composition revenu total en 2000 pop. 15 ans et + selon la langue maternelle* (%)
71.6 15.9 12.5 76.3 13.2 10.5 0 20 40 60 80 100 Revenu d'emploi Transferts gouv. Autre 16-Montérégie
*
Age by mother tongue* (%)
14.9 34.7 17.9 33.9 31.0 16.3 25.8 26.9 0 10 20 30 40 50 0-19 20-39 40-59 60+
Knowledge of official languages by mother tongue* (%) 4.6 6.3 89.0 0.0 80.9 19.1 0 25 50 75 100
English only French only English and French
Language most often used at work by mother tongue* (%) 19.4 74.3 6.6 1.1 97.6 1.3 0 20 40 60 80 100
English French English and French Participation rate, employment rate, and unemployment rate by mother tongue* (%)
71.8 65.9 8.2 6.0 65.9 61.9 0 20 40 60 80 100
Participation Employment Unemployment
Highest educational level by mother tongue* (%)
6.5 34.9 11.5 20.0 25.6 18.6 35.6 12.8 21.0 11.9 0 10 20 30 40 50
Grade 8 and - Grades 9 to 13 Trade school CEGEP University
Total income composition in 2000 pop. 15 years old and over by mother tongue* (%)
77.7 11.615.6 10.5 9.4 75.2 0 20 40 60 80 100 Employment income Government transfers Other 10. Chaudière-Appalaches
*
English-speaking population / Total population: 2,405 / 249,700 1.0%
Proportion of Québec's English-speaking population: 0.4%
Main occupations of English-speakers (>10%)
Social sciences, education, public administration, and religion
Sales and services 18.6
Business, finance, and administration
Trades, transport, and equipment 12.9
Management 10.5
%
20.0
16.7
Âge selon la langue maternelle* (%)
27.9 25.0 29.2 17.8 26.4 27.1 31.6 14.9 0 10 20 30 40 50
0-19 ans 20-39 ans 40-59 ans 60 et +
Connaissance des langues officielles selon la langue maternelle* (%) 30.6 0.5 68.8 0.0 58.9 41.1 0 20 40 60 80 100 Anglais seulement Français seulement Anglais et français
Langue utilisée le plus souvent au travail selon la langue maternelle* (%)
61.9 28.9 9.0 3.8 91.9 4.1 0 20 40 60 80 100
Anglais Français Anglais et français Taux d'activité, taux d'emploi et taux de chômage selon la langue maternelle* (%)
61.2 55.7 9.5 67.1 63.0 6.2 0 20 40 60 80 100
Taux d’activité Taux d’emploi Taux de chômage
Plus haut niveau de scolarité atteint selon la langue maternelle* (%)
8.1 38.5 9.5 23.9 20.0 14.1 36.3 11.2 22.5 15.9 0 10 20 30 40 50
8e année et - 9e à 13e année École de métiers Collégial Universitaire
Composition revenu total en 2000 pop. 15 ans et + selon la langue maternelle* (%)
71.6 15.9 12.5 76.3 13.2 10.5 0 20 40 60 80 100
Revenu d'emploi Transferts gouv. Autre
English French 16-Montérégie
*
Âge selon la langue maternelle* (%)15.6 27.8 33.4 23.2 21.9 32.0 18.1 28.0 0 10 20 30 40 50
0-19 ans 20-39 ans 40-59 ans 60 et +
Connaissance des langues officielles selon la langue maternelle* (%) 6.7 3.7 89.4 0.0 69.7 30.3 0 20 40 60 80 100 Anglais seulement Français seulement Anglais et français
Langue utilisée le plus souvent au travail selon la langue maternelle* (%)
28.2 63.8 7.7 1.4 96.7 1.8 0 20 40 60 80 100
Anglais Français Anglais et français Taux d'activité, taux d'emploi et taux de chômage selon la langue maternelle* (%)
63.9 65 4.3 62.7 57.0 9.2 0 20 40 60 80 100
Taux d’activité Taux d’emploi Taux de chômage
Plus haut niveau de scolarité atteint selon la langue maternelle* (%)
8.2 30.8 8.9 19.5 32.6 12.6 31.6 11.3 23.8 20.7 0 10 20 30 40 50
8e année et - 9e à 13e année École de métiers Collégial Universitaire
Composition revenu total en 2000 pop. 15 ans et + selon la langue maternelle* (%)
69.3 15.9 15.1 73.9 15.7 10.4 0 20 40 60 80 100 Revenu d'emploi Transferts gouv. Autre 03 Capitale-Nationale
*
Âge selon la langue maternelle* (%)
27.9 25.0 29.2 17.8 26.4 27.1 31.6 14.9 0 10 20 30 40 50
0-19 ans 20-39 ans 40-59 ans 60 et +
Connaissance des langues officielles selon la langue maternelle* (%) 30.6 0.5 68.8 0.0 58.9 41.1 0 50 100 Anglais seulement Français seulement Anglais et français
Langue utilisée le plus souvent au travail selon la langue maternelle* (%)
61.9 28.9 9.0 3.8 91.9 4.1 0 20 40 60 80 100
Anglais Français Anglais et français Taux d'activité, taux d'emploi et taux de chômage selon la langue maternelle* (%)
61.2 55.7 9.5 67.1 63.0 6.2 0 20 40 60 80 100
Taux d’activité Taux d’emploi Taux de chômage
Plus haut niveau de scolarité atteint selon la langue maternelle* (%)
8.1 38.5 9.5 23.9 20.0 14.1 36.3 11.2 22.5 15.9 0 10 20 30 40 50
8e année et - 9e à 13e année École de métiers Collégial Universitaire
Composition revenu total en 2000 pop. 15 ans et + selon la langue maternelle* (%)
71.6 15.9 12.5 76.3 13.2 10.5 0 20 40 60 80 100 Revenu d'emploi Transferts gouv. Autre 16-Montérégie
*
Age by mother tongue* (%)
28.5 36.8 13.3 22.7 32.7 20.5 22.5 24.3 0 10 20 30 40 50 0-19 20-39 40-59 60+
Knowledge of official languages by mother tongue* (%) 4.0 4.0 92.1 0.0 78.6 21.4 0 25 50 75 100
English only French only Anglais et français
Language most often used at work by mother tongue* (%) 21.7 71.5 5.1 1.0 97.9 1.0 0 20 40 60 80 100
English French English and French Participation rate, employment rate, and unemployment rate by mother tongue* (%)
49.2 44.1 10.4 57.8 52.0 10.0 0 20 40 60 80 100
Participation Employment Unemployment
Highest educational level by mother tongue* (%)
12.2 36.3 12.0 18.7 21.4 17.1 35.5 13.2 21.6 12.6 0 10 20 30 40 50
Grade 8 and - Grades 9 to 13 Trade school CEGEP University
Total income composition in 2000 pop. 15 years old and over by mother tongue* (%)
64.1 18.318.4 17.8 12.5 69.3 0 20 40 60 80 100 Employment income Government transfers Other 11. Mauricie
*
English-speaking population / Total population: 2,140 / 144,345 1.5%
Proportion of Québec's English-speaking population: 0.4%
Main occupations of English-speakers (>10%)
Sales and services 21.7
Trades, transport, and equipment 14.9
Management 11.6
Business, finance, and administration 11.1
Social sciences, education,
public administration, and religion 10.6 %
Âge selon la langue maternelle* (%)
27.9 25.0 29.2 17.8 26.4 27.1 31.6 14.9 0 10 20 30 40 50
0-19 ans 20-39 ans 40-59 ans 60 et +
Connaissance des langues officielles selon la langue maternelle* (%) 30.6 0.5 68.8 0.0 58.9 41.1 0 20 40 60 80 100 Anglais seulement Français seulement Anglais et français
Langue utilisée le plus souvent au travail selon la langue maternelle* (%)
61.9 28.9 9.0 3.8 91.9 4.1 0 20 40 60 80 100
Anglais Français Anglais et français Taux d'activité, taux d'emploi et taux de chômage selon la langue maternelle* (%)
61.2 55.7 9.5 67.1 63.0 6.2 0 20 40 60 80 100
Taux d’activité Taux d’emploi Taux de chômage
Plus haut niveau de scolarité atteint selon la langue maternelle* (%)
8.1 38.5 9.5 23.9 20.0 14.1 36.3 11.2 22.5 15.9 0 10 20 30 40 50
8e année et - 9e à 13e année École de métiers Collégial Universitaire
Composition revenu total en 2000 pop. 15 ans et + selon la langue maternelle* (%)
71.6 15.9 12.5 76.3 13.2 10.5 0 20 40 60 80 100
Revenu d'emploi Transferts gouv. Autre
English French 16-Montérégie
*
Âge selon la langue maternelle* (%)15.6 27.8 33.4 23.2 21.9 32.0 18.1 28.0 0 10 20 30 40 50
0-19 ans 20-39 ans 40-59 ans 60 et +
Connaissance des langues officielles selon la langue maternelle* (%) 6.7 3.7 89.4 0.0 69.7 30.3 0 20 40 60 80 100 Anglais seulement Français seulement Anglais et français
Langue utilisée le plus souvent au travail selon la langue maternelle* (%)
28.2 63.8 7.7 1.4 96.7 1.8 0 20 40 60 80 100
Anglais Français Anglais et français Taux d'activité, taux d'emploi et taux de chômage selon la langue maternelle* (%)
63.9 65 4.3 62.7 57.0 9.2 0 20 40 60 80 100
Taux d’activité Taux d’emploi Taux de chômage
Plus haut niveau de scolarité atteint selon la langue maternelle* (%)
8.2 30.8 8.9 19.5 32.6 12.6 31.6 11.3 23.8 20.7 0 10 20 30 40 50
8e année et - 9e à 13e année École de métiers Collégial Universitaire
Composition revenu total en 2000 pop. 15 ans et + selon la langue maternelle* (%)
69.3 15.9 15.1 73.9 15.7 10.4 0 20 40 60 80 100 Revenu d'emploi Transferts gouv. Autre 03 Capitale-Nationale
*
Âge selon la langue maternelle* (%)
27.9 25.0 29.2 17.8 26.4 27.1 31.6 14.9 0 10 20 30 40 50
0-19 ans 20-39 ans 40-59 ans 60 et +
Connaissance des langues officielles selon la langue maternelle* (%) 30.6 0.5 68.8 0.0 58.9 41.1 0 50 100 Anglais seulement Français seulement Anglais et français
Langue utilisée le plus souvent au travail selon la langue maternelle* (%)
61.9 28.9 9.0 3.8 91.9 4.1 0 20 40 60 80 100
Anglais Français Anglais et français Taux d'activité, taux d'emploi et taux de chômage selon la langue maternelle* (%)
61.2 55.7 9.5 67.1 63.0 6.2 0 20 40 60 80 100
Taux d’activité Taux d’emploi Taux de chômage
Plus haut niveau de scolarité atteint selon la langue maternelle* (%)
8.1 38.5 9.5 23.9 20.0 14.1 36.3 11.2 22.5 15.9 0 10 20 30 40 50
8e année et - 9e à 13e année École de métiers Collégial Universitaire
Composition revenu total en 2000 pop. 15 ans et + selon la langue maternelle* (%)
71.6 15.9 12.5 76.3 13.2 10.5 0 20 40 60 80 100 Revenu d'emploi Transferts gouv. Autre 16-Montérégie
*
Age by mother tongue* (%)
14.9 31.6 27.0 27.1 30.7 14.7 27.9 26.6 0 10 20 30 40 50 0-19 20-39 40-59 60+
Knowledge of official languages by mother tongue* (%) 33.2 1.0 65.9 0.0 75.1 24.9 0 25 50 75 100
English only French only English and French
Language most often used at work by mother tongue* (%) 44.0 47.9 7.0 1.6 96.3 2.0 0 20 40 60 80 100
English French English and French Participation rate, employment rate, and unemployment rate by mother tongue* (%)
60.5 13.9 51.1 15.4 53.0 61.6 0 20 40 60 80 100
Participation Employment Unemployment
Highest educational level by mother tongue* (%)
13.8 44.3 13.2 18.4 10.6 20.5 37.9 12.2 18.0 11.4 0 10 20 30 40 50
Grade 8 and - Grades 9 to 13 Trade school CEGEP University
Total income composition in 2000 pop. 15 years old and over by mother tongue* (%)
17.1 11.2 75.0 17.4 7.6 71.8 0 20 40 60 80 100 Employment income Government transfers Other 12. Abitibi-Témiscamingue
*
English-speaking population / Total population 1,900 / 213,355 0.9%
Proportion of Québec's English-speaking population: 0.3%
Main occupations of English-speakers (>10%)
Sales and services 18.6
Trades, transport, and equipment 17.1
Business, finance, and administration 15.1
Social sciences, education, public administration, and religion
Management 11.1
%
13.1
Âge selon la langue maternelle* (%)
27.9 25.0 29.2 17.8 26.4 27.1 31.6 14.9 0 10 20 30 40 50
0-19 ans 20-39 ans 40-59 ans 60 et +
Connaissance des langues officielles selon la langue maternelle* (%) 30.6 0.5 68.8 0.0 58.9 41.1 0 20 40 60 80 100 Anglais seulement Français seulement Anglais et français
Langue utilisée le plus souvent au travail selon la langue maternelle* (%)
61.9 28.9 9.0 3.8 91.9 4.1 0 20 40 60 80 100
Anglais Français Anglais et français Taux d'activité, taux d'emploi et taux de chômage selon la langue maternelle* (%)
61.2 55.7 9.5 67.1 63.0 6.2 0 20 40 60 80 100
Taux d’activité Taux d’emploi Taux de chômage
Plus haut niveau de scolarité atteint selon la langue maternelle* (%)
8.1 38.5 9.5 23.9 20.0 14.1 36.3 11.2 22.5 15.9 0 10 20 30 40 50
8e année et - 9e à 13e année École de métiers Collégial Universitaire
Composition revenu total en 2000 pop. 15 ans et + selon la langue maternelle* (%)
71.6 15.9 12.5 76.3 13.2 10.5 0 20 40 60 80 100
Revenu d'emploi Transferts gouv. Autre
English French 16-Montérégie
*
Âge selon la langue maternelle* (%)15.6 27.8 33.4 23.2 21.9 32.0 18.1 28.0 0 10 20 30 40 50
0-19 ans 20-39 ans 40-59 ans 60 et +
Connaissance des langues officielles selon la langue maternelle* (%) 6.7 3.7 89.4 0.0 69.7 30.3 0 20 40 60 80 100 Anglais seulement Français seulement Anglais et français
Langue utilisée le plus souvent au travail selon la langue maternelle* (%)
28.2 63.8 7.7 1.4 96.7 1.8 0 20 40 60 80 100
Anglais Français Anglais et français Taux d'activité, taux d'emploi et taux de chômage selon la langue maternelle* (%)
63.9 65 4.3 62.7 57.0 9.2 0 20 40 60 80 100
Taux d’activité Taux d’emploi Taux de chômage
Plus haut niveau de scolarité atteint selon la langue maternelle* (%)
8.2 30.8 8.9 19.5 32.6 12.6 31.6 11.3 23.8 20.7 0 10 20 30 40 50
8e année et - 9e à 13e année École de métiers Collégial Universitaire
Composition revenu total en 2000 pop. 15 ans et + selon la langue maternelle* (%)
69.3 15.9 15.1 73.9 15.7 10.4 0 20 40 60 80 100 Revenu d'emploi Transferts gouv. Autre 03 Capitale-Nationale
*
Âge selon la langue maternelle* (%)
27.9 25.0 29.2 17.8 26.4 27.1 31.6 14.9 0 10 20 30 40 50
0-19 ans 20-39 ans 40-59 ans 60 et +
Connaissance des langues officielles selon la langue maternelle* (%) 30.6 0.5 68.8 0.0 58.9 41.1 0 50 100 Anglais seulement Français seulement Anglais et français
Langue utilisée le plus souvent au travail selon la langue maternelle* (%)
61.9 28.9 9.0 3.8 91.9 4.1 0 20 40 60 80 100
Anglais Français Anglais et français Taux d'activité, taux d'emploi et taux de chômage selon la langue maternelle* (%)
61.2 55.7 9.5 67.1 63.0 6.2 0 20 40 60 80 100
Taux d’activité Taux d’emploi Taux de chômage
Plus haut niveau de scolarité atteint selon la langue maternelle* (%)
8.1 38.5 9.5 23.9 20.0 14.1 36.3 11.2 22.5 15.9 0 10 20 30 40 50
8e année et - 9e à 13e année École de métiers Collégial Universitaire
Composition revenu total en 2000 pop. 15 ans et + selon la langue maternelle* (%)
71.6 15.9 12.5 76.3 13.2 10.5 0 20 40 60 80 100 Revenu d'emploi Transferts gouv. Autre 16-Montérégie
*
Age by mother tongue* (%)
19.2 35.8 12.1 32.6 30.5 16.9 26.2 26.4 0 10 20 30 40 50 0-19 20-39 40-59 60+
Knowledge of official languages by mother tongue* (%) 11.8 3.4 83.8 81.0 0.0 19.0 0 25 50 75 100
English only French only English and French
Language most often used at work by mother tongue* (%) 26.7 66.7 6.2 0.9 97.8 1.2 0 20 40 60 80 100
English French English and French Participation rate, employment rate, and unemployment rate by mother tongue* (%)
59.4 55.7 6.3 64.5 59.9 7.2 0 20 40 60 80 100
Participation Employment Unemployment
Highest educational level by mother tongue* (%)
13.3 41.4 10.7 23.8 11.6 19.0 37.0 13.1 20.6 10.3 0 10 20 30 40 50
Grade 8 and - Grades 9 to 13 Trade school CEGEP University
Total income composition in 2000 pop. 15 years old and over by mother tongue* (%)
16.3 15.3 73.3 16.5 10.1 68.7 0 20 40 60 80 100 Employment income Government transfers Other 13. Centre-du-Québec