HAL Id: hal-00617440
https://hal-mines-paristech.archives-ouvertes.fr/hal-00617440
Submitted on 29 Aug 2011
HAL is a multi-disciplinary open access archive for the deposit and dissemination of sci-entific research documents, whether they are pub-lished or not. The documents may come from teaching and research institutions in France or abroad, or from public or private research centers.
L’archive ouverte pluridisciplinaire HAL, est destinée au dépôt et à la diffusion de documents scientifiques de niveau recherche, publiés ou non, émanant des établissements d’enseignement et de recherche français ou étrangers, des laboratoires publics ou privés.
3D MHD unsteady state modeling of a high voltage
-low current plasma torch operating with air
Alexandre Lebouvier, Clarisse Delalondre, François Fresnet, Frédéric Fabry,
Valérie Boch, Vandad-Julien Rohani, François Cauneau, Laurent Fulcheri
To cite this version:
Alexandre Lebouvier, Clarisse Delalondre, François Fresnet, Frédéric Fabry, Valérie Boch, et al.. 3D MHD unsteady state modeling of a high voltage - low current plasma torch operating with air. 20th International Symposium on Plasma Chemistry - ISPC20, Jul 2011, Philadelphia, United States. 4 p. �hal-00617440�
3D MHD unsteady state modeling of a high voltage - low current
plasma torch operating with air
A. Lebouvier1,2, C. Delalondre3, F. Fresnet2, F. Fabry1, V. Boch2, V. Rohani1, F. Cauneau1 and L. Fulcheri1
1
Center for Energy and Processes, MINES ParisTech, 06904 Sophia Antipolis, France
2
Technocentre Renault, DREAM/DTAA - Service 68240, 78288 Guyancourt Cedex, France
3
EDF R&D, Département MFEE, 6 quai Watier, 78400 Chatou, France
Abstract: A non-transferred high voltage – low current DC plasma torch
operating with air has been simulated using Code_Saturne CFD software for current lower than 1 A. The 3D MHD model considers two injection configurations: axial and vortex. The current and the air flow rate have been tuned in the range 0.3 to 0.6 A and 0.16 to 0.5 g/s, respectively. The influence of these parameters on the arc behavior and the arc characteristics has been studied in terms of temperature, velocity, electrical potential and Joule heating.
Keywords: MHD modeling, low current, plasma torch.
1. Introduction
Thermal plasma models become of interest because they are more and more sophisticated and get close to realistic conditions. Numerous MHD fluid models have been reported in the literature mostly on direct current (DC) arc discharge modeling operating at high current, typically I > 100 A [1,2].
Unfortunately, the literature is very poor concerning MHD arc discharge modeling for low current – high voltage plasma torches. One of the explanation for the lack of studies dedicated to this purpose is probably that below 1 A, the self-magnetic field becomes negligible and the convection effects induce a highly irregular motion of the arc column which imply very unstable physical phenomena. Thus, one of the most challenging issues in the field of plasma modeling is to be able to simulate very low-current plasma (typically lower than 1 A) as a result of many numerical instabilities deriving from physical instabilities.
A non-transferred high voltage – low current DC plasma torch operating with air has been simulated using Code_Saturne CFD software for current lower than 1 A and air flow rate up to 0.5 g/s which conditions correspond to typical experimental parameters. The study has been carried out with two injection configurations: axial and vortex. The current and the air flow rate have been tuned in the range 0.3 to 0.6 A and 0.16 to 0.5 g/s respectively.
The influence of these parameters on the arc behavior and the arc characteristics has been studied in terms of temperature, velocity, electrical potential and Joule heating. When possible, the model results have been compared to experimental data.
2. Mathematical model
The three-dimensional model studied is based on the following main assumptions:
‐ The plasma is considered as a single continuous fluid (Air).
‐ The plasma is optically thin and at Local Thermodynamic Equilibrium (LTE).
‐ The gas is treated as incompressible.
‐ The gas flow is laminar and time-dependent. ‐ Gravitational effects are taken into account. Let us point out that whereas high current arcs or high power-density plasmas [3] are commonly assumed to be at LTE. For low current or low power density arcs, this hypothesis is generally not correct and this assumption can imply great differences in the arc behavior. However, in this study, due to highly challenging numerical issues linked with the low current, the LTE assumption has been made with the objective of getting preliminary information on transport phenomena including mass, momentum, and energy as well as on the gas flow and temperature fields.
The model is defined by the set of fluid dynamics
Navier-Stokes equations and Maxwell
electromagnetic equations respectively. The resistive
MHD equations have been solved using
Code_Saturne v. 1.3, developed by EDF R&D [4]. The Code_Saturne electric arc module has been used.
Fig. 1 presents the schematic of the plasma torch. The mesh is composed of 348 800 hexa-cells. As we work in inversed polarity, we apply to the anode a positive voltage and the cathode is grounded. The time step is set to 10 µs. At the first time step, the anode potential is 1000 V, and we create a hot channel between both electrodes to ignite the plasma. For 50 µs, low inflow is injected to stabilize the arc. Then, an inflow velocity ramp is applied.
Figure 1. Schematic of the plasma torch.
3. Results and Discussion
3.1. I = 400 mA. Qair = 0.32 g/s. Axial injection. The results presented have been performed with a current of 400 mA and an air flow rate of 0.32 g/s. Fig. 2 shows the evolution of the temperature versus time. We can see that the arc root moves linearly in the same section plane as for this first preliminary model, the injection is axial. The arc column seems very stable. The arc root is attached at the cathode tip, a few millimeters above the outlet. This phenomenon was also observed experimentally (see Fig. 3). The displacement of the arc root inside the nozzle, once the velocity ramp has reached its maximum value, is 15.2 m/s, the injection velocity being 12.3 m/s. This difference is due to thermal expansion of the gas which increases the arc root velocity. The temperature of the arc core reaches 5500 K.
In Fig. 4, between 1.3 and 6 ms, we observe that the voltage undergoes numerical instabilities with a 20
kHz frequency due to sudden stretch of the plasma arc. The voltage increases almost linearly with the arc length. From 10 ms, the arc root reaches the cathode tip, and a voltage fluctuation around 2.7 kV is observed. This fluctuation comes from a coming and going movement of the arc plume with a 1.85 kHz frequency. Experimentally, we observe a voltage fluctuation of the same order of magnitude, between 0.5 and 3 kHz, but with a voltage of 1.9 kV in these conditions. The overestimation of the voltage is probably due to the LTE assumption, as demonstrated by Trelles et al. [5].
The magnetic field is very low for a current of 400 mA (< 10 µT). Consequently, the Lorentz forces are also very low (< 120 N/m3). Convective effects become predominant over the magnetic effects and lead to the instabilities observed.
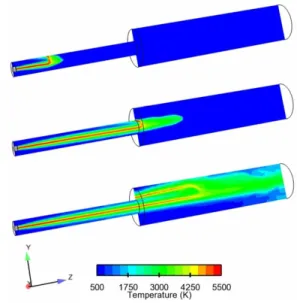
Figure. 2. Evolution of the temperature for three different times
(t = 2, 5 and 20 ms). I = 400 mA. Qair = 0.32 g/s.
Fig. 3 shows also that the experimental cathodic arc root emits more radiation than the rest of the arc column. As the model does not include the metal vapor emitted by the electrodes, the model underestimates the radiative emission of the arc root (cf. Fig. 5). The radius of the experimental arc is estimated to 1 mm by naked eye. According to the model results, the radiation losses are the largest within a radius of 0.83 mm, which is very close.
Figure 3. Photograph of the experimental plasma arc.
Figure 4. Numerical voltage versus time. I = 400 mA. Qair = 0.32 g/s.
Figure 5. Numerical radiation losses. I = 400 mA. Qair = 0.32 g/s.
3.2. Influence of the current
The current was varied over a range of 300 mA to 600 mA, corresponding to the range of experiments. The air mass flow rate is set to 0.32 g/s.
Fig. 6 shows that, the higher the current, the lower the voltage drop and the higher the deposited power (1000, 1100 and 1200 W for I = 300, 400 and 600 mA, respectively), a phenomenon observed experimentally. We can also notice that the higher the current, the higher the instabilities magnitude before and after 10 ms. The oscillation are in the same frequency range, and thus do not depend on the current.
The lower the current, the higher the difference between simulated and experimental mean voltage. This phenomenon is probably due to the non-equilibrium effects which increase when decreasing the current.
Fig. 7 shows that the higher the current, the warmer the arc core, and the wider the temperature profile. Consequently, the arc root velocity in the nozzle increases (14.3, 15.2 and 16 m/s for I = 300, 400 and 600 mA respectively).
Figure 6. Numerical voltage versus time for three different
currents. Qair = 0.32 g/s.
Figure 7. Numerical temperature profile over radial distance
for three different currents in the middle of the cathode. Qair = 0.32 g/s.
3.3. Influence of the air mass flow rate
The air flow rate has been varied over a range of 0.16 to 0.5 g/s, the current being 400 mA.
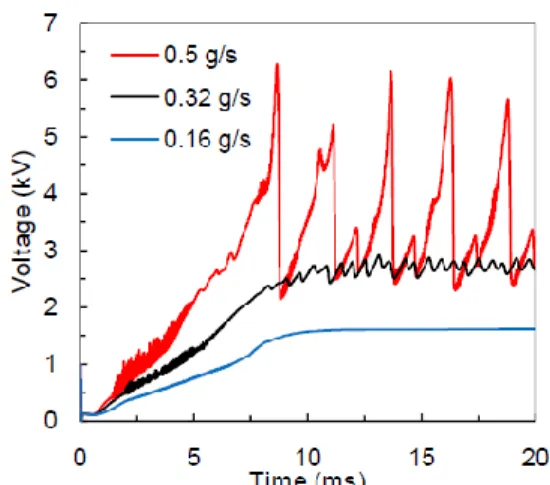
Figs. 8 and 9 show the influence of the air flow rate on the voltage and the temperature profile in the middle of the cathode. The higher the air flow rate,
the longer the arc, the higher the voltage and the higher the instabilities magnitude. For a flow rate of 0.5 g/s, the arc is very disturbed by the flow instabilities. The arc must increase its voltage to self-sustain. These instabilities are probably due to Kelvin-Helmholtz instabilities but need further investigations to confirm this hypothesis.
The higher the flow rate, the narrower the temperature profile because the energy released is carried by the gas flow. The maximum temperatures reached for the three cases are very close (~ 5200 K).
Figure 8. Numerical voltage versus time for three different air
flow rates. I = 400 mA.
Figure 9. Numerical temperature profile vs. radial distance for
three different air flow rates. I = 400 mA.
3.4. Vortex injection results.
The vorticity of the flow can be tuned. Fig. 10 shows a helical shape of the arc column. The shape has been confirmed by a high-speed camera video. If the
vorticity is too high, the arc cannot be no longer sustained. The mean voltage is 2.17 kV and thus closer to experimental results.
Figure 10. Iso-temperature (3200 K) for the vortex injection.
t = 80 ms. I = 0.4 A. Qair = 0.32 g/s.
4. Conclusions and Perspectives
A 3D MHD unsteady model of a low current arc has been successfully implemented. The model allows obtaining significant information on low current arc which are sorely experimentally measurable.
The results have been compared to experimental results and show good correlations and good trends. Indeed, the arc root attachment and the arc shape are very similar to the experimental observations. The model overestimates the voltage drop probably because of the LTE assumption. The non-equilibrium effects are significant and result in a discrepancy between experimental and numerical voltage values. The vortex injection model shows a helical shape of the arc and a better voltage estimation.
This preliminary work is likely to open the way towards a better understanding of low current arc discharges which technologies are currently encountering an important development in many application fields.
References
1 A. Gleizes, J. Gonzalez, P. Freton, J. Phys. D, Appl. Phys., 38-9 (2005) R153–R183
[2] J. P. Trelles, C. Chazelas, A. Vardelle, J. V. R. Heberlein, J. Therm. Spray Tech., 18 5-6 (2009), 728– 752
[3] F. Archambeau, N. Mechitoua, M. Sakiz, International Journal on Finite Volumes, 1-1 (2004). [4] Y. Tanaka, Thin Solid Films, 518-3 (2009), 936–942. [5] J. P. Trelles, J. V. R. Heberlein, and E. Pfender, J. Phys. D, Appl. Phys., 40-19 (2007), 5937–5952.