HAL Id: hal-01897570
https://hal.inria.fr/hal-01897570v3
Submitted on 21 Jan 2019
HAL is a multi-disciplinary open access
archive for the deposit and dissemination of
sci-entific research documents, whether they are
pub-lished or not. The documents may come from
teaching and research institutions in France or
abroad, or from public or private research centers.
L’archive ouverte pluridisciplinaire HAL, est
destinée au dépôt et à la diffusion de documents
scientifiques de niveau recherche, publiés ou non,
émanant des établissements d’enseignement et de
recherche français ou étrangers, des laboratoires
publics ou privés.
A Framework for Edge Infrastructures Monitoring
Mohamed Abderrahim, Meryem Ouzzif, Karine Guillouard, Jérôme François,
Xavier Lorca, Charles Prud’Homme, Adrien Lebre
To cite this version:
Mohamed Abderrahim, Meryem Ouzzif, Karine Guillouard, Jérôme François, Xavier Lorca, et al..
A Framework for Edge Infrastructures Monitoring. [Research Report] RR-9215, Orange Labs; Inria
Nancy - Grand Est; IMT-Atlantique. 2018, pp.1-14. �hal-01897570v3�
ISSN 0249-6399 ISRN INRIA/RR--9215--FR+ENG
RESEARCH
REPORT
N° 9215
Octorber 2018 Project-Team StackA Framework for Edge
Infrastructures
Monitoring
Mohamed Abderrahim, Meryem Ouzzif, Karine Guillouard, Jérôme
Francois, Xavier Lorca, Charles Prud’homme, Adrien Lebre
RESEARCH CENTRE
RENNES – BRETAGNE ATLANTIQUE
Campus universitaire de Beaulieu 35042 Rennes Cedex
A Framework for Edge Infrastructures Monitoring
Mohamed Abderrahim, Meryem Ouzzif, Karine Guillouard,
Jérôme Francois, Xavier Lorca, Charles Prud’homme, Adrien
Lebre
Project-Team Stack
Research Report n° 9215 — Octorber 2018 — 14 pages
Abstract: By relying on small sized and massively distributed infrastructures, the Edge computing paradigm aims at supporting the low latency and high bandwidth requirements of the next generation services that will leverage IoT devices (e.g., video cameras, sensors). To favor the advent of this paradigm, management services, similar to the ones that made the success of Cloud computing platforms, should be proposed. However, they should be designed in order to cope with the limited capabilities of the resources that are located at the edge. In that sense, they should mitigate as much as possible their footprint. Among the different management services that need to be revisited, we investigate in this paper the monitoring one. Monitoring functions tend to become compute-, storage- and network-intensive, in particular because they will be used by a large part of applications that rely on real-time data. To reduce as much as possible the footprint of the whole monitoring service, we propose to mutualize identical processing functions among different tenants while ensuring their quality-of-service (QoS) expectations.We formalize our approach as a constraint satisfaction problem and show through micro-benchmarks its relevance to mitigate compute and network footprints.
Un Canevas Logiciel pour la Supervision des Infrastructures Edge
Résumé : En s’appuyant sur des infrastructures de petite taille et massivement distribuées, le Edge Computing cherche à répondre aux besoins en faible latence et grande bande passante des applications de nouvelle génération qui favorisent l’utilisation de l’Internet des objets (par exemple, les caméras vidéo, les capteurs). Pour mettre en œuvre ce paradigme, des services de gestion, similaires à ceux qui ont permis le succès des plates-formes du Cloud Computing, doivent être proposés. Cependant, ils doivent être conçus de manière à faire face aux capacités limitées des ressources situées à la périphérie du réseau. Autrement dit, ils doivent réduire autant que possible leur empreinte. Parmi les différents services de gestion qui doivent être revisités, nous étudions dans cet article le service de supervision. Les fonctions de supervision ont tendance à nécessiter de grandes capacités de calcul, de stockage et de réseau parce qu’elles sont utilisées par une grande partie d’applications qui nécessite une supervision en temps réel. Afin de réduire au maximum l’empreinte du service de supervision, nous proposons de mutualiser des fonctions de traitement identiques entre différents tenants tout en garantissant leurs attentes en qualité de service (QoS). Nous formalisons notre approche en tant qu’un problème de satisfaction de contraintes et montrons à l’aide de micro-test sa pertinence pour atténuer l’empreinte de calcul et réseau.
3
A Framework for Edge Infrastructures
Monitoring
Mohamed Abderrahim
1, Meryem Ouzzif
1, Karine Guillouard
1, Jérôme Francois
2,
Xavier Lorca
3, Charles Prud’homme
4and Adrien Lebre
41
Orange Labs, France
[email protected]
2
Inria, France
[email protected]
3
IMT Mines Albi, France
[email protected]
4
IMT Atlantique, France
[email protected]
By relying on small sized and massively distributed infrastructures, the Edge computing paradigm aims at supporting the low latency and high bandwidth requirements of the next genera-tion services that will leverage IoT devices (e.g., video cameras, sensors). To favor the advent of this paradigm, management services, similar to the ones that made the success of Cloud com-puting platforms, should be proposed. However, they should be designed in order to cope with the limited capabilities of the resources that are located at the edge. In that sense, they should mit-igate as much as possible their footprint. Among the different management services that need to be revisited, we investigate in this paper the monitoring one. Monitoring functions tend to be-come compute-, storage- and network-intensive, in particular because they will be used by a large part of applications that rely on real-time data. To reduce as much as possible the footprint of the whole monitoring service, we propose to mutualize identical processing functions among different tenants while ensuring their quality-of-service (QoS) expectations. We formalize our ap-proach as a constraint satisfaction problem and show through micro-benchmarks its relevance to mitigate compute and network footprints.
I. INTRODUCTION
The proliferation of Internet of Things (IoT) applications [1], as well as the advent of new technologies such as Mobile Edge computing [2], Software-Defined Networking [3] and Network Function Virtualization [4] (NFV) have been ac-celerating the need for Edge computing infrastruc-tures [5]. Meanwhile, progress on how to operate and use such infrastructures is marginal. Existing operational solutions such as Akamai+Cloudlet [6] or Amazon Lambda@Edge [7] allow to run only domain-specific applications on infrastruc-tures composed of centralized clouds and NFV-enabled hardware at the edge.
In order to satisfy the expectations of operators and users of Edge infrastructures, we claim that resource management services with similar capa-bilities that made the success of Cloud computing should be designed as follows. First, they should let an operator aggregate, supervise and expose the massively distributed resources of an Edge infrastructure. Secondly, they should let third party users implement new kinds of services on top of them. Reusing available management systems such as OpenStack or OpenMANO cannot be done in a straightforward manner as most of them have been designed for centralized data-centers [8]. In other words, they do not take into account
net-4 Abderrahim et al. work specifics (e.g., latency, bandwidth,
intermit-tent connectivity) to handle the distribution of the Edge resources. Moreover, they do not consider mitigating the management footprint to cope with the limited capabilities of Edge resources.
Among the management services that should be revised, the monitoring service is an important one. It is mandatory for all the infrastructure tenants to detect faults, ensure security, observe the QoS and provision resources. Besides, it has to cope with the multitude of tenants resources that may be owned by the infrastructure operator (e.g., servers, routers, network links), by edge resources providers (e.g., home gateways, smartphones, lap-tops), by services providers (e.g., media contents, Web sites) and by services users (e.g., virtual machines, virtual network functions, temperature sensors). The large number of resources being observed leads to a large number of measurements to be processed and transmitted through the Edge infrastructure. For instance, the sensors observ-ing Twitter’s infrastructure generate 2.8 Billion measurements per minute[9] and a single sensor which monitors electricity consumption generates 50 Billion measurements per year [10].
In order to mitigate as much as possible the monitoring footprint on the Edge infrastructure, we aim at designing a monitoring as a service solution [11] to be offered to the infrastructure tenants according to the utility computing model. In addition to performing the processing required by the different tenants, it limits the processing redundancy. For instance, the observations of an Internet-connected camera installed in a city may be of interest to both a police and a transportation office. Presently, such resources are monitored separately. As a result, a redundant processing is performed. We aim at limiting such redundancies by designing a monitoring service that mutualizes processing among different tenants while keeping their functional and QoS requirements fully satis-fied.
We proceed using elementary functions deduced from our previous work [12] to express the mon-itoring processing requests in a unified way. The best composition of functions is then achieved by mutualizing as many functions as possible among the different tenants while taking into account their QoS constraints in addition to the infrastructure
capabilities.
The contributions are: (i) the proposal of the monitoring functions mutualization among differ-ent tenants as an approach to reduce the moni-toring footprint, (ii) the design of a monimoni-toring service that relies on our approach (iii) the formal-ization of our approach as a constraint satisfaction problem that considers the Edge infrastructure capabilities and the tenants requirements, and (iv) the validation of our approach through different scenarios.
The rest of the paper is organized as follows. Section II discusses the related work. Section III exposes the design specifics. Section IV details how we model the problem. Section V evaluates our approach. Finally, Section VI concludes the paper and gives some perspectives for this work.
II. RELATEDWORK
Sharing sensors information among different tenants has been identified in the IoT literature as an opportunity to increase the business value [13]. In order to promote it, different studies have been conducted. For instance, a three-layered architec-ture has been proposed to abstract the IoT devices heterogeneity [14], a metadata model has been proposed to unify the IoT data description [15] and semantic methods have been proposed to identify similarity between data sent by heterogeneous sensors [16]. These studies deal only with sharing the sensors raw measurements. However, they do not address sharing the measurements processing. Processing unbounded streams of data while considering the Edge infrastructure capabilities has been recently studied in the stream processing literature. The latter is a very active research in data mining. In [17], relying on Edge infrastruc-tures to process data streams near to the users is investigated. In [18], the authors formalize the problem of placing stream processors in an Edge infrastructure to meet users requirements while considering the infrastructure capabilities. How-ever, these works do not consider the possibility of mutualising processing among different tenants. The mutualisation concept has been proposed in the network service function chaining prob-lem [19]. It consists in efficiently passing users network flows through a sequence of network
A Framework for Edge Infrastructures Monitoring 5 functions (e.g., firewall, intrusion detection
sys-tems, load balancer. . . ) to reduce the overall net-work service footprint. In this context, studies as [20] and [21] propose models where the same network function is dedicated to process different users flows. Thus, the allocated hosting resources are used more efficiently since their idle time is reduced. However, these works do not specifically consider the case of users having identical flows. Consequently, such flows are processed redun-dantly.
To the best of our knowledge, we are the first to propose mutualising identical processing and flows among different tenants to reduce the Edge infrastructure footprint.
III. MONITORINGSERVICEDESIGN
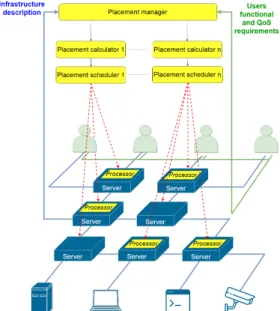
Our approach of mutualizing identical process-ing and flows among different tenants is motivated by the multi-tenant aspect of the Edge infras-tructure. In fact, the tenants sharing the same resources are likely to have overlapping moni-toring requirements (e.g., a IaaS user and the infrastructure operator may be both interested in monitoring virtual servers, a police and a transport office may be both interested in monitoring video-cameras). By mutualising processing and flows among them, we aim to reduce the compute and the network footprint of the monitoring service. The architecture, which we propose, is depicted in Figure 1.
The monitoring service gets as input two kinds of requirements. The first one is the functional requirements. They consist of preliminary process-ing to perform on the observed measurements. As detailed in our previous study [12], a prelimi-nary processing may be measurement aggregation, measurement filtering, alarm triggering. . . The di-versity of these requirements challenges the de-termination of the mutualization. To address this issue, it is mandatory to unify their expression. For this aim, we intend to design a user requirements language based on a general purpose stream pro-cessing language (such as [22]) since a measure-ment flow is a data stream. Using such a language, the users mention the resources to observe, the chains of algebraic functions to perform (e.g., aggregate, filter, join) and the destination functions (e.g., user dashboard, user database). The second
Fig. 1: Monitoring service architecture kind of requirements gotten as input specify the expected QoS. We focus on the satisfaction of the latency requirement to cope with the distribution of the Edge infrastructure. Thus, the users should mention the maximum end-to-end latency they tolerate.
The monitoring service gets also as input a description of the infrastructure topology and ca-pabilities. This input is mandatory to ensure the satisfaction of users QoS requirements. To cope with the heterogeneity of the infrastructure, we envision to rely on a language that unifies the re-sources description. To the best of our knowledge, there is no existing language that considers the Edge infrastructure specifics. For this reason, we envision to extend an existing language that has been designed to describe Cloud infrastructures such as [23].
The "placement manager" is the element that handles both inputs (i.e., the users requirements and the infrastructure description). It performs three tasks. First, it analyses the users require-ments to check that each user has the access permissions to the resources that he requests to observe. Secondly, to parallelize the placement calculation, it partitions the inputs. It determines the portion of the infrastructure that may host each user processing requirements based on the latency
6 Abderrahim et al. constraints. Finally, it instantiates a "placement
calculator" to calculate the placement of the users requirements that may be hosted on the same portion of the infrastructure.
The "placement calculator" is the element in charge of determining the mutualized placement. It performs two tasks. First, it optimizes users functional requirements expression to leverage the mutualization. It performs the "separation" opti-mization [24] to split the required processing into finest-grained ones. For instance, a function that filters two events may be split into two consecutive functions such as each one of them filters one of the events. In addition, it performs the "reorder-ing" optimization [24] to prioritize the execution of the processing that is required by most of the users. Thus, such processing is performed on the same incoming flow and can be mutualized. Secondly, it calculates the mutualized placement and transmits it to the "placement scheduler". The latter is in charge of the deployment and the configuration of the "processors". We focus here on the placement calculation. We formalize it as a constraint satisfaction problem whose mathemati-cal model is presented in the following section.
IV. THEMUTUALIZEDPLACEMENTPROBLEM
The mutualization of monitoring processing and flows among different users should keep the func-tional requirements of each one of them satisfied. We model these requirements as a directed graph whose vertices are elementary algebraic functions (e.g., aggregate, filter, join, split) and whose arcs are the flows between them. To ensure their sat-isfaction, we model the mutualization as an edge contraction [25] that merges this graph vertices while keeping the same vertices chain for each user. This problem has been proven to be NP-complete [26]
Moreover, the mutualization should keep the users QoS (i.e., end-to-end performance) require-ments satisfied. This comes down to a place-ment problem, where the infrastructure capabil-ities are considered. We model it as an inexact graph matching [27] that consists in determining a mapping between two graphs having a different number of vertices. In our case, the first graph represents the merged users requirements graph and the second one represents the infrastructure.
The graph matching problem has been also proved to be NP-complete [25].
Since the determination of the mutualized placement is constraint-oriented and NP-complete, we opt here for formalizing it as a constraint satisfaction problem [28]. Table I summarizes our model. In the following, it is detailed.
A. Notions and Notations
In order to model the mutualized placement problem, we define four notions:
• Function: A function may be either a probe function, a processing function (e.g., filter, aggregate, join) or a user function (e.g., user dashboard, user database).
• Flow: A flow is the set of data sent from a function to another (along a chain of links that connects them).
• Server: A server is a compute resource of
the Edge infrastructure. It may host functions requiring less cumulative capabilities than those it offers.
• Link: A link is a network resource that
con-nects the servers of the Edge infrastructure. It may host flows that require less cumulative capabilities than those it offers and that tol-erate more latency than the one it introduces. We represent a directed and labeled graph G as a tuple G = (V, A, l1, l2, ..., ln) such as V is the
set of its vertices, A is the set of its arcs (A ⊆ V × V ) and l1,l2,...,ln are its labeling functions.
A labeling function li may be a vertex labeling
function li : V → Li or an arc labeling function
li: A → Li such as Li is the set of vertex or arc
labels, respectively.
Finally, we define the following operators:
• paths(graph): For a given graph, this oper-ator returns all the arcs which form paths.
• source(arcs) and dest(arcs): For a given set of arcs which form a path, these operators return respectively the source vertex and the destination vertex of the path.
• head(arc) and tail(arc): For a given arc,
these operators return respectively the head vertex and the tail vertex.
A Framework for Edge Infrastructures Monitoring 7
Inputs P The set of probe functions M The set of processing functions U The set of user functions
F The set of all the functions: F = P ∪M ∪U R The set of flows exchanged by the functions lf f For a given pair of F × F , this function
returns true if both elements of the pair are identical (i.e., have the same type and parameters). Otherwise, it returns false. lf C For a given element of F , this function
returns the required server capability by that element.
lf S For a given element of F , this function
returns the server of S that should host it or null if there is no constraint on the hosting server.
lf L For a given element of F , this function
returns the tolerated latency between that element and the probes.
loC For a given flow of F × F , this function
returns the required link capability by that flow.
GU The users requirements modeling graph.
GU= (F, R, lf C, lf f, lf S, lf L, loC)
S The set of servers L The set of network links
lsC For a given server of S, this function returns
the capability of that server.
llC For a given link of S × S, this function
returns the capability of that link. llL For a given link of S × S, this function
returns the latency introduced by that link. GI The infrastructure modeling graph: GI =
(S, L, lsC, llC, llL).
Variables and their domains
VM The set of the functions of the monitoring
service. Its domain is DVM ⊆ F .
AM The set of the flows of the monitoring
service. Its domain is DAM ⊆ F × F .
xsfi The server which is hosting fi ∈ F .
The set which gathers all these variables is XSF= {xsfi|i ∈J1; |F |K}. Their domain is DXSF = S.
xloi The set of links which are hosting oi∈ F ×
F . The set which gathers all these variables is XLO= {xloi|i ∈J1; |F × F |K}. Their domain is DXLO= paths(GI).
xori The flow of the monitoring service which
is equivalent to the flow ri ∈ R. The set
which gathers all these variables is XOR=
{xori| i ∈ J1; |R|K}. Their domain is DXOR⊆ F × F .
Constraints Functional Equations: 1, 2 and 3. QoS Equations: 4, 5, 6, 7, 8 and 9. Channeling Equations: 10 and 11.
Objective function
Xf p The overall monitoring service footprint
(Equation 12)
TABLE I: Model summary
B. Problem Inputs
The inputs of the problem are the users re-quirements and the infrastructure description. We model each one of them by a directed graph.
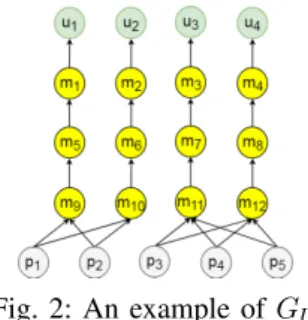
First, we model the users requirements by the directed graph GU = (F, R, lf C, lf f, lf S, lf L,
loC). Figure 2 depicts an example of this graph.
The set of vertices F of GU represents the probes,
processing and user functions: F = P ∪ M ∪ U . The set of its arcs R represents the required flows between the different functions. The roles of its labeling functions are detailed in Table I.
Fig. 2: An example of GU
Secondly, we model the infrastructure by the directed graph GI = (S, L, lsC, llC, llL). Figure 3
depicts an example of this graph. The set of vertices S of GI represents the servers of the
infrastructure. The set of its arcs L represents the network links connecting the servers. Bidirectional links are modeled with two opposed arcs. An arc connects each vertex to itself. It represents a logical link that is intended to host flows between the functions deployed on the same server. The roles of GI labeling functions are detailed in
Table I.
Fig. 3: An example of GI
C. Variables Definition
The mutualized placement problem issues four outputs, namely the functions instances, the flows
8 Abderrahim et al. between them, the servers hosting the functions
instances and the links hosting the flows. Each element is modeled by a variable. First, we de-fine the variables VM and AM. They represent
respectively the functions of the monitoring ser-vice and the flows between them. Thus, GM =
(VM, AM) is the graph that models the mutualized
monitoring service to be determined. Secondly, we define XSF = {xsfi|i ∈ J1, |F |K} the set of variables xsfi that represent the hosting server of
a function fi, ∀i ∈ J1, |F |K. Finally, we define XLO = {xloi|i ∈J1, |F ×F |K} the set of variables xloithat represent the set of hosting links of a flow
oi, ∀i ∈J1, |F × F |K.
As depicted in Figure 4, XSF and XLO
sim-plify the expression of the GM and GI matching
constraints. In order to simplify the expression of the GU and GM matching constraints, we
introduce XOR = {xori|i ∈ J1, |R|K} the set of variables xori that represent the flows of GM that
are functionally equivalent to the flows ri of GU,
∀i ∈J1, |R|K.
Fig. 4: Roles of the variables in graphs matching Thus, each solution of our problem is an instan-tiation of VM, AM, XSF, XLO and XOR that
minimizes the overall footprint while satisfying simultaneously both the functional and the QoS requirements.
D. Domains Definition
GM is built from GU because the monitoring
service is instantiated according to users require-ments. Figure 5 shows an example of a GM that
is built from the GU depicted by Figure 2. The
differences between them are highlighted in red: a dashed red line is used to mark the vertices and the arcs of GU that are deleted in GM and a
continuous red line is used to mark the arcs that are added on GM. These differences are due to
the mutualization of equivalent functions among different users. In fact, functions m9and m10are
mutualized among u1and u2. In addition, m11and
m12are mutualized among u3and u4. Finally, m7
and m8 are mutualized among u3 and u4.
Fig. 5: A derivative GM of GU
As illustrated in Figure 5, a mutualization of a function fiwith a function fjcan be described
us-ing graph terminology as an edge contraction [25] that consists of two operations. First, each outgo-ing arc from fj is replaced by an outgoing arc
from fi such as the head vertex of the added arc
is the same as the head vertex of the arc it is replacing. Similarly, each incoming arc to fj is
replaced by an incoming arc to fi such as the
tail vertex of the added arc is the same as the tail vertex of the arc it is replacing. Secondly, for each vertex fj, the incoming arcs and the outgoing arcs
are suppressed.
Hence, the mutualization does not add vertices to GM that are not in GU. So, VM ⊆ F . Let DVM
denote the domain of VM, DVM ⊆ F . However,
the mutualization may add arcs to GM that are not
in GU. Thus, AM 6⊆ R. Since AM ⊆ VM × VM
and VM ⊆ F then AM ⊆ F ×F . Let DAM denote
the domain of AM, DAM ⊆ F × F .
Let DXSF denote the domain of XSF, DXSF
is the set of servers that may host the monitoring functions and DXSF = S. Let DXLO denote the
domain of XLO, DXLOis the set of links that may
host the flows between the monitoring functions. To host a flow, the links should form a path. Thus, DXLO = paths(GI). Finally, let DXOR denote
the domain of XOR, DXOR is the set of flows
of GM which are equivalent to the flows of GU.
This set is represented by the variable AM. Thus,
DXOR = DAM ⊆ F × F .
E. Problem Constraints
The first three constraints verify the satisfaction of the user functional requirements. They establish
A Framework for Edge Infrastructures Monitoring 9 the matching between GU and GM. First, each
users requirements flow r that is incoming to a user (head(r) ∈ U ) should have an equivalent monitoring service flow xor that is incoming to
that user.
∀r ∈ R, head(r) /∈ U ∨ head(xor) = head(r)
(1) Secondly, for each users requirements flow r, an equivalent monitoring service flow xor should be
incoming from an identical function to that of r. ∀r ∈ R, lf f(tail(r), tail(xor)) = true (2)
Finally, for each users requirements flow r, an equivalent monitoring service flow xor should
result from the entire required chain of processing functions. Thus, recursively, the incoming flows xor0 to xor should be equivalent to the flows r0
that are incoming to r. ∀r ∈ R,
∀r0∈ R, head(r0) 6= tail(r)∨head(xor0) = tail(xor)
(3) The QoS constraints to satisfy by the monitor-ing service establish the matchmonitor-ing between GM
and GI. They can be divided into two kinds of
constraints. The first kind verifies that the physical architecture of the monitoring service is suitable with the topology of the infrastructure. It is com-posed of three constraints. First, each flow o of the monitoring service should have hosting links xlo.
∀o ∈ AM, xlo6= ∅ (4)
Secondly, each function of the monitoring service f ∈ VM that has a predefined hosting server
should be hosted on that server (users and probe functions are those which are the most concerned with this constraint because they may have to be hosted near the users or the observed resources, respectively).
∀f ∈ VM, lf S(f ) = null ∨ xsf = lf S(f ) (5)
Finally, for each set of links xlo that hosts a
flow o, the source (the destination, resp.) server
of the path they form should host the source (the destination, resp.) function of o.
∀xsf ∈ XSF,
(∀o1∈ F ×F, head(o1) 6= f ∨xsf = dest(xlo1))∧
(∀o2∈ F ×F, tail(o2) 6= f ∨xsf = source(xlo2))
(6) The second kind of QoS constraints are the perfor-mance ones. In our case, there are three of them. First, the capability of each hosting server should be satisfied. Thus, each server of the infrastructure s should have more capability than the sum of capabilities that are required by the monitoring service functions f that it hosts xsf = s.
∀s ∈ S, X
f ∈VM
xsf=s
lf C(f ) ≤ lsC(s) (7)
Secondly, the capability of each hosting link should be satisfied. Thus, each link l of the in-frastructure should have more capability than the sum of capabilities that are required by the mon-itoring service flows o that it hosts l ∈ xlo. The
capability that is required by o is the maximum of capabilities that are required by its equivalent flows r of the users requirements (o ∈ xor).
∀l ∈ L, X ∀o∈AM l∈xlo ( max ∀r∈R o∈xor loC(r)) ≤ llC(l) (8)
Finally, the latency that is required by the users should be satisfied, along all the paths. Thus, the links hosting flows that form a path to a user should have a latency that is lower than the one this user tolerates.
∀p ∈ paths(GU),
∀r ∈ p, dest(p) /∈ U ∨ X
l∈xlxor
llL(l) ≤ lf L(dest(p))
(9) In addition to the functional and the QoS con-straints, we define two channeling constraints. They verify existing dependencies between the variables that do not appear in the previously exposed constraints. First, the set of vertices VM
is the set of the heads and tails of the set of arcs AM. VM = [ o∈AM {head(o), tail(o)} (10) RR n° 9215
10 Abderrahim et al. Secondly, since it represents a flow of the
monitor-ing service, each xor should be in AM (i.e., XOR
⊆ AM). Meanwhile, each flow of the monitoring
service should be equivalent to a users require-ments flow (i.e., AM ⊆ XOR).
XOR= AM (11)
F. Problem Objective Function
Mutualizing the processing among different users reduces the compute footprint. However, it may increase the network footprint. In fact, the mutualized processing may be located far from part of users in order to satisfy the latency con-straint of others. For this reason, as an objective function, we consider minimizing the monitoring service overall compute and network footprint rather than maximizing the mutualization. We evaluate the sum of both footprints by the variable Xf pto minimize. We consider that both footprints
have the same cost, but depending on the context, different coefficients may be used in this sum.
Xf p= X s∈S f ∈VM xsf=s lsC(f ) + X l∈L o∈AM l∈xlo ( max ∀r∈R o∈xor loC(r)) (12) V. EVALUATION
In order to evaluate the relevance of our ap-proach, we compare the mutualized placement (M) with the non-mutualized placement (NM) regard-ing their footprint on the infrastructure and their required calculation time.
To calculate the NM, we modified the model by removing the matching between GU and GM and
considering that GM = GU. Thus, the variables
VM, AM and xori| i ∈ J1; |R|K are replaced by F , R and ri| i ∈ J1; |R|K, respectively. In addition, Constraints 1, 2, 3, 10 and 11 related to these variables, are removed. We keep the same objective function. Thus, the resources usage is still minimized but without functions and flows mutualization.
In the calculation of both placements, a strat-egy is defined to explore the search space. It is a combination of the "last conflict" [29] and the "smallest domain first" strategies. It prior-itizes the selection of the variables that were involved in the last conflict. If there are no con-flicts, the strategy selects the variables having
the smallest domains and assigns to them the lowest values in their domains. We implemented both placement models using the Choco [30] 4.0.6 constraint solver. The source code is avail-able online : https://github.com/edgeMonitoring/ PlacementCalculator. We performed all the exper-iments on a machine with a Xeon E5-2640V4 processor and 64 GB of RAM using the Ubuntu 16.04 operating system and a Java 1.8.0 virtual machine.
A. Test scenarios
We consider two test categories to analyze sep-arately the impact of users requirements changes (Test UR1 and Test UR2) and the impact of infrastructure changes (Test I1 and Test I2).
Regarding users requirements, Tests UR1 and UR2 consider a basic users requirements GU,
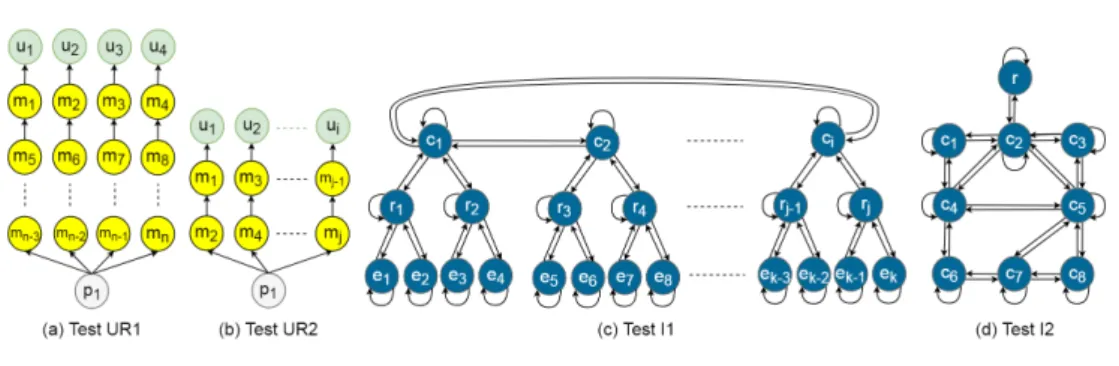
where all users need to perform the same number of processing functions on a common probe. In Test UR1, we vary the number of the required pro-cessing functions per user (|M|/|U|) while keeping the number of users fixed to 4 (|U|=4) as depicted in Figure 6 (a). Conversely, in Test UR2, we vary the number of users (|U|) while keeping the number of the required processing functions per user fixed to 3 (|M|/|U|=3) as depicted in Figure 6 (b). We assume that each function requires 1 MB of RAM and that each communication between the functions requires 1 Mbps of bandwidth (these values have been arbitrary chosen). We generate the functions types and parameters randomly with three assumptions. First, the predefined hosting server of a probe function is an edge device (when such a device exists in the infrastructure). Secondly, between the predefined hosting servers of each user and its probes, there is at least one path whose latency is inferior or equal to the maximum tolerated by that user. Finally, 60% of the processing functions that have the same rank in the different processing chains are identical (the outgoing flows of these functions satisfy Constraint 2). As a matter of fact, this assumption does not determine the expected mutualization rate because it does not guarantee the satisfaction of the rest of the functional constraints (i.e., Con-straints 1 and 3). For both tests, the infrastructure is composed of 4 trees of servers and it has the
A Framework for Edge Infrastructures Monitoring 11
Fig. 6: Tests inputs same configuration with Test I1 infrastructures that
is detailed in the following paragraph.
Regarding the impact of the infrastructure, Test I1 and Test I2 are based on two different infras-tructure topologies. In Test I1, the topology is a ring of trees. Each tree is composed of 7 servers: a central point of presence (ci), two regional points
of presence (ri) and four edge devices (ei) such
as each ci is connected to two ri and each ri
is connected to two ei (We model each point of
presence by a high-performance server because the latency inside a data center is lower than 1 ms [31]). In this test, we vary the number of trees (|S|/7) as depicted in Figure 6 (c). In Test I2, we consider a partially connected topology. We take as example a part of the topology of RENATER, the French NREN [32]. It is composed of eight central points of presence c1..c8, which are located
in Rennes, Paris, Strasbourg, Bordeaux, Lyon, Toulouse, Marseille and Nice, respectively as well as a regional point of presence r located in Orsay. Figure 6 (d) depicts this infrastructure. For Test I1, we assume that the latencies of the links interconnecting the different ci, connecting a ci
with an ri and connecting an ri with an ei are 22
ms, 12 ms and 8 ms, respectively. For Test I2, we consider the links latencies that are afforded by RENATER [33]. For both kinds of infrastructures, we assume that the available hosting capabilities of the ci, ri and ei are 10 GB, 1 GB and 100
MB, respectively. In addition, we consider that the bandwidths of the links interconnecting the ci, connecting a ci with an ri and connecting
an ri with an ei are 10 Gbps, 1 Gbps and 100
Mbps, respectively. These values of the hosting capabilities have been chosen to guarantee the existence of a NM. Otherwise, it may be possible
to find M solutions and no NM ones. For the sake of simplicity, we do not consider this case. In both Tests I1 and I2, we assume that there is no routing restrictions (This is the most challenging configu-ration since it maximizes the number of network paths). Finally, the users requirements input is composed of 4 users (|U|=4) each requiring to perform 3 processing functions (|M|/|U|=3) on the same probe. The compute and network capabilities it requires are as those of Tests UR1 and UR2 users requirements.
B. Test results
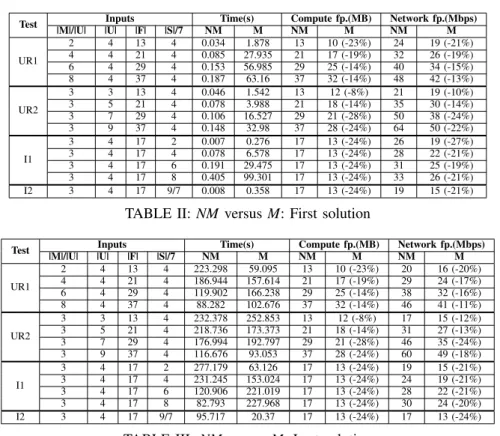
In this section, we compare the M and the NM approaches based on the calculation time that they require as well as their compute and their network footprint. We consider the first and last solutions found within 10 minutes. Results are depicted in Table II and Table III. Each value in these tables is the mean of the results of 30 experiments that differ in the randomly generated parameters. The footprint gain realized by the M is represented as a percentage of the NM footprint. In 3% of the experiments of Test I1 where the number of trees (|S|/7) is equal to 2, the search space could be entirely explored during the calculation of the NM. Meanwhile, 10 minutes were not enough to find an Msolution in 13% of the experiments of Test UR1 where |M|/|U|=6 and in 27% of the experiments of Test UR1 where |M|/|U|=8.
1) Footprint analyses: The NM results show that the compute footprint is the same in the first and the last solutions. It is equal to the sum of the compute capabilities that are required by the functions (i.e., |F | × 1M B) because there is no functions mutualization. For the M results, the
12 Abderrahim et al.
Test Inputs Time(s) Compute fp.(MB) Network fp.(Mbps)
|M|/|U| |U| |F| |S|/7 NM M NM M NM M UR1 2 4 13 4 0.034 1.878 13 10 (-23%) 24 19 (-21%) 4 4 21 4 0.085 27.935 21 17 (-19%) 32 26 (-19%) 6 4 29 4 0.153 56.985 29 25 (-14%) 40 34 (-15%) 8 4 37 4 0.187 63.16 37 32 (-14%) 48 42 (-13%) UR2 3 3 13 4 0.046 1.542 13 12 (-8%) 21 19 (-10%) 3 5 21 4 0.078 3.988 21 18 (-14%) 35 30 (-14%) 3 7 29 4 0.106 16.527 29 21 (-28%) 50 38 (-24%) 3 9 37 4 0.148 32.98 37 28 (-24%) 64 50 (-22%) I1 3 4 17 2 0.007 0.276 17 13 (-24%) 26 19 (-27%) 3 4 17 4 0.078 6.578 17 13 (-24%) 28 22 (-21%) 3 4 17 6 0.191 29.475 17 13 (-24%) 31 25 (-19%) 3 4 17 8 0.405 99.301 17 13 (-24%) 33 26 (-21%) I2 3 4 17 9/7 0.008 0.358 17 13 (-24%) 19 15 (-21%)
TABLE II: NM versus M: First solution
Test Inputs Time(s) Compute fp.(MB) Network fp.(Mbps)
|M|/|U| |U| |F| |S|/7 NM M NM M NM M UR1 2 4 13 4 223.298 59.095 13 10 (-23%) 20 16 (-20%) 4 4 21 4 186.944 157.614 21 17 (-19%) 29 24 (-17%) 6 4 29 4 119.902 166.238 29 25 (-14%) 38 32 (-16%) 8 4 37 4 88.282 102.676 37 32 (-14%) 46 41 (-11%) UR2 3 3 13 4 232.378 252.853 13 12 (-8%) 17 15 (-12%) 3 5 21 4 218.736 173.373 21 18 (-14%) 31 27 (-13%) 3 7 29 4 176.994 192.797 29 21 (-28%) 46 35 (-24%) 3 9 37 4 116.676 93.053 37 28 (-24%) 60 49 (-18%) I1 3 4 17 2 277.179 63.126 17 13 (-24%) 19 15 (-21%) 3 4 17 4 231.245 153.024 17 13 (-24%) 24 19 (-21%) 3 4 17 6 120.906 221.019 17 13 (-24%) 28 22 (-21%) 3 4 17 8 82.793 227.968 17 13 (-24%) 30 24 (-20%) I2 3 4 17 9/7 95.717 20.37 17 13 (-24%) 17 13 (-24%)
TABLE III: NM versus M: Last solution compute footprint is also the same in the first and
the last solutions but it is lower than the sum of the compute capabilities that are required by the functions. Thus, a GM is found. However, it is the
only one because the calculation of its possible placements requires more than 10 minutes as in the most cases for NM.
Since for both placements, the first and the last solutions have the same number of functions, these solutions have also the same number of flows. However, for both placements, the last solution has a lower network footprint than the first one. This is due to the fact that the solver manages to place the flows on a lower number of links. Test I1 shows how the number of links connecting the servers affects the network footprint since for the same users requirements input, the network foot-print increases when the scale of the infrastructure increases.
As expected, the first and the last solutions of the M have less compute and network footprint than the first and the last solutions of the NM, respectively. The realized gain for the compute
footprint ranges from -8% to -28% and it ranges from -10% to -27% for the network one. In most cases, the first solution of the M has even less compute and network footprints than the last so-lution of the NM. This is due to the fact that the M solutions are not attainable by the NM calculation. 2) Calculation time analyses: The inputs scale affects significantly the calculation time. Table II shows that the time required to find the first solutions increases exponentially when the input scale increases linearly. This is due to the NP-completeness of the M and NM problems.
For the different tests, Table II shows that the first solution of the M case required more time than the one of the NM case. In addition, as detailed previously, 10 minutes were not enough to find a solution in some experiments for the M calculation. Meanwhile, they were enough in other experiments to explore the search space entirely for the NM calculation. This is due to the fact that the M problem complexity is higher than the NM one. The former consists of two NP-complete problems (i.e., edge contraction and
A Framework for Edge Infrastructures Monitoring 13 graph matching) whereas the latter consists of only
one (i.e., graph matching). Since any NM is a viable solution for the M calculation, it is possible to begin the M calculation by looking for an NM. This comes down to adding this constraint: ∀r ∈ R, head(xor) = head(r) ∧ tail(xor) = tail(r)
and to relaxing it once a solution is found. Thus, it is possible to reduce the M calculation time.
For the same number of functions, Table II shows that it is harder for both placements to find a first solution in the tests having the higher number of processing functions. In fact, these functions introduce more unknowns to the problem than the other functions (i.e., users and probes) since it is unknown whether they have to be mutualized or not. In addition, their hosting servers are unknown. Compared to an infrastructure of Test I1 that is composed of two trees (|S|=14, |L|=40), the infras-tructure of Test I2 has a lower number of servers and links (|S|=9, |L|=35). However, Table II shows that for both placements, it is harder to find the first solution in the latter test than in the former. This is due to the difference of the infrastructures topologies, which results in different numbers of network paths. In fact, for the infrastructure of Test I1 that is composed of 2 trees, there is only one path between any pair of servers. However, for the infrastructure of Test I2, there are at least two paths between any pair of servers except c2 and
r, which are connected with one path only. VI. CONCLUSION ANDFUTUREWORK
In this paper, we investigated the footprint challenge of Edge infrastructures monitoring. To address this issue, we proposed a monitoring ser-vice that leverages the mutualization of identical processing and flows among different tenants. Our approach is motivated by the multi-tenant aspect of the Edge infrastructure since the tenants sharing the same resources may have the same monitor-ing interests. We designed the monitormonitor-ing service architecture. In addition, we formalized the mutu-alization determination as a constraint satisfaction problem whose objective is to reduce the overall monitoring service footprint while meeting the QoS requirements of each tenant.
The micro-benchmarks we performed showed the pertinence of our approach in reducing the
monitoring footprint. However, because of the NP-completeness of the problem, the mutualization increases the placement calculation time. To cope with this limit, it is possible to target a non-mutualised placement as a first solution then con-tinue the search for a mutualised one. In addition, in order to significantly reduce the calculation time, we envision to further decentralize the mu-tualization calculation. To assign the inputs to the different calculators, we intend to consider the inputs nature in addition to their scale as our evaluation showed that the rate of the processing functions in the users requirements and the topol-ogy of the infrastructure affect the duration of the calculation. Finally, to cope with the dynamicity of the infrastructure, we envision to rely on dynamic resolution methods [34]. In addition, we envision to extend the objective function of the model in order to minimize the migration cost [35] of the functions and flows placed beforehand.
REFERENCES
[1] L. Atzori, A. Iera, and G. Morabito, “The internet of things: A survey,” Computer networks, vol. 54, no. 15, pp. 2787–2805, 2010.
[2] A. Ahmed and E. Ahmed, “A survey on mobile edge computing,” in 2016 10th International Conference on Intelligent Systems and Control (ISCO), Jan 2016, pp. 1–8.
[3] D. Kreutz, F. Ramos, P. Esteves Verissimo, C. Es-teve Rothenberg, S. Azodolmolky, and S. Uhlig, “Software-defined networking: A comprehensive survey,” Proceedings of the IEEE, vol. 103, no. 1, pp. 14–76, Jan. 2015.
[4] R. Mijumbi, J. Serrat, J.-L. Gorricho, N. Bouten, F. De Turck, and R. Boutaba, “Network function virtu-alization: State-of-the-art and research challenges,” IEEE Communications Surveys & Tutorials, vol. 18, no. 1, pp. 236–262, 2015.
[5] W. Shi, J. Cao, Q. Zhang, Y. Li, and L. Xu, “Edge computing: Vision and challenges,” IEEE Internet of Things Journal, vol. 3, no. 5, pp. 637–646, 2016. [6] “Akamai Cloudlets,” http://cloudlets.akamai.com,
(Ac-cessed: 2018-03-08).
[7] “Amazon Lambda@Edge,” https://aws.amazon.com/ lambda/edge/, (Accessed: 2018-03-08).
[8] A. Lebre, J. Pastor, A. Simonet, and F. Desprez, “Re-vising openstack to operate fog/edge computing infras-tructures,” in Cloud Engineering (IC2E), 2017 IEEE International Conference on. IEEE, 2017, pp. 138–148. [9] A. Asta, “Observability at twitter: tech-nical overview, part i, 2016,” https: //blog.twitter.com/engineering/en_us/a/2016/
observability-at-twitter-technical-overview-part-i.html, accessed: 2018-04-01.
[10] M. P. Andersen and D. E. Culler, “Btrdb: Optimizing stor-age system design for timeseries processing.” in FAST, 2016, pp. 39–52.
14 Abderrahim et al.
[11] L. Romano, D. De Mari, Z. Jerzak, and C. Fetzer, “A novel approach to qos monitoring in the cloud,” in Data Compression, Communications and Processing (CCP), 2011 First International Conference on. IEEE, 2011, pp. 45–51.
[12] M. Abderrahim, M. Ouzzif, K. Guillouard, J. Francois, and A. Lebre, “A holistic monitoring service for fog/edge infrastructures: A foresight study,” in 2017 IEEE 5th International Conference on Future Internet of Things and Cloud (FiCloud), Aug 2017, pp. 337–344. [13] S. Jernigan, D. Kiron, and S. Ransbotham, “Data sharing
and analytics are driving success with iot,” MIT Sloan Management Review, vol. 58, no. 1, 2016.
[14] Y. Benazzouz, C. Munilla, O. Gunalp, M. Gallissot, and L. Gurgen, “Sharing user iot devices in the cloud,” in Internet of Things (WF-IoT), 2014 IEEE World Forum on. IEEE, 2014, pp. 373–374.
[15] B. Xu, L. Da Xu, H. Cai, C. Xie, J. Hu, and F. Bu, “Ubiquitous data accessing method in iot-based infor-mation system for emergency medical services,” IEEE Transactions on Industrial Informatics, vol. 10, no. 2, pp. 1578–1586, 2014.
[16] M. Antunes, D. Gomes, and R. L. Aguiar, “Towards iot data classification through semantic features,” Future Generation Computer Systems, 2017.
[17] M. D. de Assuncao, A. da Silva Veith, and R. Buyya, “Distributed data stream processing and edge computing: A survey on resource elasticity and future directions,” Journal of Network and Computer Applications, vol. 103, pp. 1–17, 2018.
[18] V. Cardellini, V. Grassi, F. Lo Presti, and M. Nardelli, “Optimal operator replication and placement for dis-tributed stream processing systems,” ACM SIGMETRICS Performance Evaluation Review, vol. 44, no. 4, pp. 11– 22, 2017.
[19] J. Halpern and C. Pignataro, “Service function chaining (sfc) architecture,” Tech. Rep., 2015.
[20] M. C. Luizelli, L. R. Bays, L. S. Buriol, M. P. Bar-cellos, and L. P. Gaspary, “Piecing together the nfv provisioning puzzle: Efficient placement and chaining of virtual network functions,” in Integrated Network Man-agement (IM), 2015 IFIP/IEEE International Symposium on. IEEE, 2015, pp. 98–106.
[21] N. Tastevin, M. Obadia, and M. Bouet, “A graph ap-proach to placement of service functions chains,” in Integrated Network and Service Management (IM), 2017 IFIP/IEEE Symposium on. IEEE, 2017, pp. 134–141. [22] M. Hirzel, H. Andrade, B. Gedik, V. Kumar, G. Losa,
M. Nasgaard, R. Soule, and K. Wu, “Spl stream pro-cessing language specification,” NewYork: IBM Research Division TJ. Watson Research Center, IBM Research Report: RC24897 (W0911 044), 2009.
[23] M. Ghijsen, J. Van Der Ham, P. Grosso, C. Dumitru, H. Zhu, Z. Zhao, and C. De Laat, “A semantic-web approach for modeling computing infrastructures,” Com-puters & Electrical Engineering, vol. 39, no. 8, pp. 2553– 2565, 2013.
[24] M. Hirzel, R. Soulé, S. Schneider, B. Gedik, and R. Grimm, “A catalog of stream processing optimiza-tions,” ACM Computing Surveys (CSUR), vol. 46, no. 4, p. 46, 2014.
[25] T. Asano and T. Hirata, “Edge-deletion and edge-contraction problems,” in Proceedings of the fourteenth annual ACM symposium on Theory of computing. ACM, 1982, pp. 245–254.
[26] A. M. Abdulkader, “Parallel algorithms for labelled graph matching,” Ph.D. dissertation, Colorado School of Mines, 1998.
[27] E. Bengoetxea, “Inexact graph matching using estima-tion of distribuestima-tion algorithms,” Ph.D. dissertaestima-tion, Ecole Nationale Supérieure des Télécommunications, Paris, France, Dec 2002.
[28] V. Kumar, “Algorithms for constraint-satisfaction prob-lems: A survey,” AI magazine, vol. 13, no. 1, p. 32, 1992. [29] C. Lecoutre, L. Saïs, S. Tabary, and V. Vidal, “Reasoning from last conflict (s) in constraint programming,” Artifi-cial Intelligence, vol. 173, no. 18, pp. 1592–1614, 2009. [30] N. Jussien, G. Rochart, and X. Lorca, “Choco: an open source java constraint programming library,” in CPAIOR’08 Workshop on Open-Source Software for In-teger and Contraint Programming (OSSICP’08), 2008, pp. 1–10.
[31] S. M. Rumble, D. Ongaro, R. Stutsman, M. Rosenblum, and J. K. Ousterhout, “It’s time for low latency.” in HotOS, vol. 13, 2011, pp. 11–11.
[32] V. Schafer, “Part of a whole: Renater, a twenty-year-old network within the internet,” Information & Culture, vol. 50, no. 2, pp. 217–235, 2015.
[33] “IPv4 MULTICAST Service,” https://pasillo.renater. fr/test/get_qosmetrics_resultsMULTICASTv4.php, (Ac-cessed: 2018-03-08).
[34] R. J. Wallace, D. Grimes, and E. C. Freuder, “Solving dynamic constraint satisfaction problems by identifying stable features.” in IJCAI, vol. 9, 2009, pp. 621–627. [35] A. Strunk, “Costs of virtual machine live migration:
A survey,” in Services (SERVICES), 2012 IEEE Eighth World Congress on. IEEE, 2012, pp. 323–329.
RESEARCH CENTRE
RENNES – BRETAGNE ATLANTIQUE
Campus universitaire de Beaulieu 35042 Rennes Cedex
Publisher Inria
Domaine de Voluceau - Rocquencourt BP 105 - 78153 Le Chesnay Cedex inria.fr