HAL Id: hal-02999451
https://hal.archives-ouvertes.fr/hal-02999451
Submitted on 10 Nov 2020HAL is a multi-disciplinary open access archive for the deposit and dissemination of sci-entific research documents, whether they are pub-lished or not. The documents may come from teaching and research institutions in France or abroad, or from public or private research centers.
L’archive ouverte pluridisciplinaire HAL, est destinée au dépôt et à la diffusion de documents scientifiques de niveau recherche, publiés ou non, émanant des établissements d’enseignement et de recherche français ou étrangers, des laboratoires publics ou privés.
Perovskites for Producing High-Efficiency Solar Cells:
Electrical Response, Impedance, and Stability
Daming Zheng, Tao Zhu, Thierry Pauporté
To cite this version:
Daming Zheng, Tao Zhu, Thierry Pauporté. Using Monovalent- to Trivalent-Cation Hybrid Per-ovskites for Producing High-Efficiency Solar Cells: Electrical Response, Impedance, and Stability. ACS Applied Energy Materials, ACS, 2020, �10.1021/acsaem.0c00884�. �hal-02999451�
1
Please cite this paper as:
D. Zheng, T. Zhu, Th. Pauporté, Using Monovalent- to Trivalent-Cation Hybrid
Perovskites for Producing High-Efficiency Solar Cells: Electrical Response,
Impedance, and Stability. ACS Appl. Energy Mater. (2020)
DOI/10.1021/acsaem.0c00884
Mono- to Tri-Cation Hybrid Perovskites for High-Efficiency Solar
Cells: Electrical Response, Impedance and Stability.
Daming Zheng,
#Tao Zhu,
#Thierry Pauporté*
Chimie ParisTech, PSL Research University, CNRS, Institut de Recherche de Chimie Paris (IRCP), UMR8247, 11 rue P. et M. Curie, F-75005 Paris, France.
*Corresponding author, email: thierry.pauporte@chimieparistech.psl.eu # Both authors contributed equally to the work
Abstract
Solar cells based on Organometal halide perovskites have emerged recently as the most promising technology for high efficiency. During the last years, innovative film processings have been developed for increasing the devices performances and stability. The two most fruitful have been (i) to complexify the perovskite composition by mixing monovalent cations and (ii) to add additives in the precursor solution which are eliminated upon the film annealing and post-deposition processing step. In the present work, perovskite films varying in their monovalent cation content, from one to three (MAPbI3, Cs0.08FA0.80MA0.12Pb(I0.88Br0.12)3 and FA1-xMAxPbI3) and optimized to reach high efficiency up to 22.2 % have been thoroughly compared for their steady-state and impedance electrical responses. Much information has been extracted from the electrical impedance spectroscopy data after their fitting by equivalent electrical circuits. With the help of complementary measurements (photoluminescence, scanning electron microscopy, Voc measurements…), the spectral features have been assigned
2
to physical phenomena. The relative permittivities of MAPI, CsFAMA and FAMA have been extracted from the high-frequency capacitance C2. The high-frequency resistance R2 has been related to the slow lifetime of the time-resolved photoluminescence and assigned to the bulk recombination resistance of the perovskite. The low-frequency resistance R4 has been assigned to recombinations occurring at and near the interfaces. The Low-frequency capacitance C4 has been related to the J-V curves hysteresis and assigned to recombinations. Recombination in PSC is phase delayed due to the dynamics of ions and related defect formation. It induces an imaginary component in the impedance spectra that is analyzed as C4. Overall, the (ii) strategy of mediating the growth of FA1-xMAxPbI3 perovskite double cation by additive is found the best to suppress recombinations, suppress ion mobility, reach high efficiency with low hysteresis and stabilize the perovskite compound.
Keywords: Perovskite solar cells, Impedance spectroscopy, Mono- and Multi-cations,
Recombination, Ionic mobility.
1. Introduction
Organic-inorganic hybrid perovskites (OIHP) mix both organic and inorganic components and have the ABX3 general formula, with A a monovalent cation, B a divalent metal cation and X a halide anion. They have emerged recently as a versatile and exciting class of semiconductor materials for applications in opto-electronics.1 These compounds combine the key properties of traditional inorganic semiconductors such as gallium arsenide (GaAs) and silicon (Si), including high charge carrier mobility and device efficiency, with the advantageous properties of organic semiconductors such as preparation simplicity, temperature processing, low-cost and property tunability. Impressive progresses have been made recently on the application of OIHPs in various fields such as lasers,2 LEDs,3 photodetectors,4 scintillators5 and photovoltaic solar cells.1,6-19 This material family exhibits excellent optoelectronic properties, an adjustable bandgap, long charge carrier diffusion length,20 low-cost and low-temperature solution processibility.1,20 OIHPs thin films can be printed on flexible substrates for lightweight devices.21 The certified present record efficiency for a PSC is 25.5%.22
The structural unit of OIHP compounds contains an anionic corner-sharing octahedral network stabilized by cations. The stability of the 3D perovskite phase is limited by geometry and oxidation state restrictions, quantified by a tolerance factor (tf). The well-known Goldsmith
3
𝑡
𝑓=
𝑟𝑥 𝑟𝐵− 𝑛
𝐴(𝑛
𝐴−
𝑟𝐴 𝑟𝐵 ⁄ ln(𝑟𝐴⁄𝑟𝐵))
(1)where nA is the oxidation state of A (+1), ri is the ionic radius of ion i (2.70 Å for methyl
ammonium (MA), 2.79 Å for formamidinium (FA), 1.81 Å for Cs and 1.19 Å for Pb2+), rA > rB by definition. tf < 4.18 indicates that the perovskite structure is allowed. MA and FA are the
two main organic monovalent cations that can be employed as organic A. However, due to the large size of FA, increasing the complexity of the perovskite was proved necessary to increase the PSC stability and performances.24-26 Above the pioneering popular monovalent mono-cation MAPbI3 compound, a huge research effort has been directed towards the development of double-cation FA1-xMAxPbX3 and triple-cation May(FA1-x MAx)PbX3 (with Ma an alkali metal) perovskites to improve the device performances and stability. In the latter case, Cs is the most popular elemental monovalent cation incorporated. However, the full entropic stabilization of this triple cation perovskite also requires the addition of Br in complement to I for X.24
Alternative strategies of stabilization by using additives have been developed lately6,27 and, to get stable double cation perovskite, we have developed recently the use of MACl as an additive in the FA1-xMAxPbI3 precursor solution.6 This compound has allowed the direct deposition of the perovskite phase upon the spin-coating and then the growth of well-crystalized FA1-xMAxPbI3 layers upon the annealing post-deposition step.
The purpose of the present paper is to investigate the electrical response, especially the electrical impedance spectra, of high efficiency PSCs. The perovskite composition has been varied, especially the number of monovalent cation employed to stabilized the perovskite photoactive phase. Based on this compositional study and the literature data, we propose a better understanding of the main features found in their impedance spectra and provide an answer to the question: what are the expected impedance spectra for the best PSCs? More precisely, we compare the following perovskites: MAPbI3, FA0.94MA0.06PbI3 and Cs0.08FA0.80MA0.12Pb(I0.88Br0.12)3. They have been the subject of a thorough optimization work in the group for the last years.6,28 The best performances were achieved for the second one at 22.2 %. The basic electrical characterization of a PSC just consists in measuring their J-V curves in the reverse and forward scan directions and in quantifying the hysteresis amplitude. However, it provides poor information about the dynamic processes occurring in the cells. In the present work, these measurements have been completed by an investigation of the effect of light intensity on the steady-state Voc and by impedance spectroscopy measurements. The
4
former provides information and quantifications about the recombination mechanism. The latter gives an in-depth and complete view of the physical phenomena occurring in PSCs in operation. With the help of complementary measurements, the spectral features have been assigned to physical phenomena. The various relaxations have been decomposed and quantified using electrical elements. Their variation has been analyzed with the applied voltage and the chemical nature of the perovskite. The present comparative study has allowed us to clarify the assignment of some electrical elements and to confirm others. Moreover, we have attached a special attention to the stability of the systems under irradiation and electrical stresses since these measurements provide a good quantification of the PSC stability.11
2. Experimental
The Fluorine-doped SnO2 (FTO) substrates (TEC 7 from Pilkington) were etched, patterned and a compact TiO2 layer (c-TiO2) was deposited by spray pyrolysis as detailed in our Ref.18. A mesoporous TiO2 layer (mp-TiO2) was subsequently prepared by spin-coating as described in our Ref.28,29.
MAPI layers preparation: A 1.45 M MAPI precursor solution was prepared by mixing 668.5
mg PbI2 and 230.5 mg MAI in 1ml DMSO. The solution was stirred and kept warm at 100°C for 2h before use. The spin-coating program was 1000 rpm for 10s and 6000 rpm for 30 s. 100 µL of chlorobenzene was dripped 30s after the starting of the spinning routine. The layers were finally annealed on a hotplate at 105 °C for 60 min. The best performances were achieved after the device preparation. These layers are denoted MAPI throughout the paper.
CsFAMA layers preparation: A precursor solution corresponding to a Cs0.08FA0.80MA0.12Pb(I0.88Br0.12)3 perovskite layer composition was prepared. First, 179 mg of formamidinium iodide (FAI), 17.4 mg of methylammonium bromide (MABr), 27.0 mg of CsI, 548 mg of PbI2 and 57.1 mg of PbBr2 were mixed in 220 μL DMSO and 780 μL DMF. The solution was stirred for a minimum of 3-4 h at room temperature in a N2 filled glovebox before use.29,30,31 45 μL of this solution was placed on top of the substrates. A two-step spin-coating program was employed: first spinning at 1000 rpm for 10 s and then at 6000 rpm for 30 s. 100 µL of chlorobenzene was dripped 20 s after the starting of the spinning routine. The films were then annealed at 105 °C for 1 h in a dry atmosphere. The best performances and smallest
5
hysteresis index (HI) were achieved after 7-8 days of storage in the N2 filled glovebox. These layers are denoted CsFAMA throughout the paper.
FAMA layers preparation: A mixed cation precursor solution with a 1.2M concentration was
prepared by mixing 206 mg of formamidinium iodide (FAI, greatcell), 553 mg of PbI2 (TCI), and 38.9 mg of methylammonium chloride (MACl, Alfa aesar) in 800 μL DMF and 200 μL DMSO. The solutions were stirred for a minimum of 2h at room temperature in a nitrogen filled glovebox. 45 μL of this solution was placed on top of the substrates. A two-step spin-coating program was run: first spinning at 1000 rpm for 10 s and then at 6000 rpm for 30 s. 100 µL of chlorobenzene was dripped 20 s after the starting of the spinning routine. The films were then annealed at 153 °C for 13 min. The PEAI post-deposition treatment consisted in dropping 60 μL of a 10 mM 2-Phenylethylamine Hydroiodide (PEAI) solution (2.49 mg in 1 mL of isopropanol) onto the perovskite film after cooling. A one-step spin-coating program was employed: 2000 rpm/s acceleration, 3000rpm for 20s. The best performances and smallest HI were achieved after 3-4 days of storage in the N2 filled glovebox. These FA1-xMAxPbI3 layers are denoted FAMA throughout the paper.
The Spiro-OMeTAD hole transporting layer (HTL) was spin-coated on the top of the perovskite layers and a 70-80 nm thick gold back contact was thermally evaporated on the HTL as detailed in Ref.29 (see section A of the Supporting Information).
The sample morphologies were examined with a high resolution Ultra 55 Zeiss FEG field-emission scanning electron microscope (FE-SEM) in the in-lens mode. The time-resolved photoluminescence (TRPL) measurements were performed through a microscope lens (numerical aperture 0.7). The perovskites layers were spin-coated onto a glass/FTO/c-TiO2 /mp-TiO2 substrate. The top of the OIHP layers was excited by a 470 nm diode laser (Picoquant) and the emission was filtered by a 488-nm longpass filter. It was analyzed for time-resolved photoluminescence decay, by a PerkinElmer SPCM avalanche photodiode combined with a Picoharp acquisition card (500 ps characteristic time of the total system response function) used with the laser in a pulsed mode at a 10 nW excitation power (pulse duration 70 ps).
The J-V curves were recorded by a Keithley 2410 digital sourcemeter, using a 0.1 V.s-1 voltage scan rate.32 The solar cells were illuminated with a solar simulator (Abet Technology Sun 2000) equipped with a xenon lamp, which light was filtered to mimic AM 1.5G conditions (100 mW/cm2).32 The illuminated surface was delimited by a black mask with an aperture diameter of 3 mm. The power density was calibrated at 100 mW.cm-2 by the use of a reference
6
silicon solar cell.33 The electrical impedance spectra of the PSCs were measured in air, at room temperature and ambient humidity (~45% < RH < ~60%). A PGSTAT 12 apparatus from Autolab was employed. The frequency ranged between 1 MHz and 20 mHz, the ac signal amplitude was 20 mV. All the measured solar cells were unencapsulated and had the same contact geometries. The impedance spectra were measured at room temperature, over a large applied voltage (Vappl) range, under ∼90 mW/cm2 light power density irradiation supplied by a
halogen Schott lamp equipped with an optical fiber light guide. The cell illuminated area was delimited by a 0.16 cm2 mask. The full recording of the spectra and characterization of a cell lasted about 1h. The spectra were analyzed using the Z-view software from National Instrument.
3. Results and discussion
3.1 Perovskites characterizations.
The morphology of the three different perovskite films as revealed by SEM is disclosed in
Figure 1. Top views show their poly-crystallinity and that they are made of merged crystal
grains. The crystal grain size analysis and distribution were performed using the Image J software (Figure 1d). In the MAPI layer, they had an average size of 410 nm (Figure 1a). The layers were well-covering. The CsFAMA layers were made of smaller crystal grains with an average size of 160 nm (Figure 1b). They were compact, uniform with no pinholes. The bright grains observed on the surface have been assigned to PbI2 by EDX analysis. The FAMA layers were nicely compact, uniform and made of remarkably large crystal grains. Their average size was measured at 1020 nm (Figure 1c). The formation of large grains is due to the use of a chloride additive (MACl) in the precursor solution. Chloride is known to favor the growth of well-crystallized layers.33-37 In summary, using mixed cation precursor produces more compact layers while the presence of a chloride additive mediates the growth of the perovskite and produces large grains.
7 Figure 1. SEM top-views of the perovkite layers investigated. (a) MAPI, (b) CsFAMA and (c) FAMA. (d) Grain size statistical analysis of the perovskite layers.
Figure 2. SEM cross-sectional views of the perovskite layers. (a) MAPI, (b) CsFAMA and (c) FAMA.
Further information on the layers morphology was gained from SEM cross-sectional images of the perovskite films (Figure 2). They confirmed that the CsFAMA layer had the smallest grains (Figure 2b). The images of the FAMA layer in Figure 2c shows remarkably monolithic large crystal grains. The interesting point is that they extend through the entire perovskite layer
8
thickness and that each large crystal is contacted on one side by TiO2 and, on the other side, by Spiro-OMeTAD. This ideal morphology contrasts with the CsFAMA film one where many grain boundaries are present in the layer bulk. Therefore, under light irradiation, the charges photogenerated in CsFAMA layers can encounter grain boundaries, be trapped and recombined there, before to be collected. The layers thicknesses were evaluated from the SEM views and found to be 360-380 nm, 440-460 nm and 410-430 nm for MAPI, CsFAMA and FAMA, respectively.
Detailed structural, compositional and optical characterizations of the layers are provided in the Supporting Information (Section B). Briefly, XRD patterns revealed that the three samples were well-crystallized (Figure S1, Supporting Information). MAPI and FAMA layers were phase pure with no PbI2. Traces of PbI2 were present in the CsFAMA layer. The elemental analysis by EDX and 1H-NMR investigations6 provided the compositions: MAPbI3, Cs0.08FA0.80MA0.12Pb(I0.88Br0.12)3 and FA0.94MA0.06PbI3 for MAPI, CsFAMA and FAMA samples, respectively (Supporting Information). The full optical characterizations reported in the Supporting Information show a high absorbance for the FAMA layer. The optical bandgap (Eg) is smaller for FAMA (1.53 eV) compared to MAPI and CsFAMA (1.59 eV). For the latter
compound the presence of bromide enlarges Eg. A consequence is the higher PL emission
wavelength for FAMA (812 nm) compared to MAPI and CsFAMA (775 nm).
3.2 Perovskite solar cells performances
The architecture of the perovskite solar cells is presented in Figure 3a. The J-V curves are shown in Figure 3b and Figure S3 (Supporting Information) and the J-V curve parameters of the best cells are gathered in Table 1. The maximum power conversion efficiency (PCE) of MAPI cell achieved 18.93%, stabilized at 18.65%. It was 20.36%, stabilized at 20.03% for CsFAMA cells. We have demonstrated elsewhere that the intercalation of a 4-Chlorobenzoic acid self-assembled monolayer at the TiO2/CsFAMA interface boosts the performance to 21.35%.29 MAPI and CsFAMA compounds have the same E
g, however, CsFAMA cells present
a higher Jsc and Voc. The former is mainly due to a higher absorbance (Figure S2a, Supporting
Information) and absence of pinholes. Defects in the MAPI layer can result in recombination pathways between holes and electrons that lower the FF and Voc parameters. The better Voc of
9
The FAMA cells exhibited the highest efficiency. The PCE could reach a remarkable 22.18 % value and the stabilized PCE achieved 22.08%. Jsc was boosted due to a wider wavelength
range for the light-harvesting (Figure S2, Supporting Information) and to the high structural quality and big grains. These cells also presented the best FF. The lower bandgap is at the origin of the lower Voc of the FAMA cells compared to the CsFAMA ones. All the trends obtained for the best cells were confirmed by the statistical analysis disclosed in Figure 4a.
Figure 3. (a) Exploded schematic view of the perovskite solar cells. (b) Reverse J-V curves of MAPI, CsFAMA and FAMA cells.
Table 1. Typical photovoltaic J-V parameters of cells among the best.
Sample Scan direction Voc /V
Jsc mA/cm2 FF /% PCE /% Stabilized PCEa/% HIb/% MAPI Reverse 1.063 23.08 77.43 18.93 18.65 6.5 Forward 1.059 22.51 73.99 17.70 CsFAMA Reverse 1.110 23.13 79.27 20.36 20.03 6.1 Forward 1.101 23.13 75.00 19.10 FAMA Reverse 1.060 25.94 80.62 22.18 22.08 3.7 Forward 1.052 25.93 78.26 21.35
a Measured by tracking at the maximum power point. b HI : Hysteresis index defined as: [PCE(%)
rev-PCE(%)for]/PCE(%)rev
10
We also noted that the HI parameter is similar for the MAPI and the CsFAMA cells with values of ca 6-7% for the best cells. On average, it was 11-14% for MAPI and 6-8 % for CsFAMA cells. This parameter was significantly better in the case of the FAMA cells with reproducible and remarkably low values at only 3-4%.
Figure 4. (a) Statistical analysis of the PSCs performances and J-V curves parameters. (b) EQE spectra of the three perovskites with the integrated Jsc curves. (c) TRPL curves. The inset is a zoom view at
short times.
The ability of the PSCs to collect light and to generate charge with a high efficiency was studied by measuring their EQE spectra (Figure 4b). MAPI cells presented the lowest performances, especially at high wavelengths, for which the irradiation penetration depth is the longest. The integration of the spectra gave a Jsc of 21.1 mA.cm-2. For the CsFAMA cell, the
charge generation edge was similar but the EQE was higher compared to MAPI. The integration gave a Jsc of 22.2 mA.cm-2. Using the FAMA perovskite produced two major effects: firstly, it
(a)
11
shifted the charge generation edge toward higher wavelengths at about 820 nm, in good agreement with the absorbance spectra of Figure S2 (Supporting Information); secondly, a high efficiency of 90% or above was achieved in the full visible and near-IR range. The integration of the spectrum provided a calculated Jsc of 25.5 mA.cm-2 in good agreement with the J-V
measurements. Further information on the charge collection was extracted from TRPL experiments. In Figure 4c, at short times zoomed in the inset, CsFAMA and FAMA had a similar behavior. They presented a fast decay with characteristic times at 2.0 ns and 0.5 ns, respectively (Table S2, Supporting Information). The amplitude of the decay was markedly higher for FAMA compared to CsFAMA. The fast component is assigned to the non-radiative recombinations of the charges that are injected into TiO2.38 Our results show that the charge injection is faster and more efficient for FAMA compared to CsFAMA. For MAPI perovskite, the first decay component was much slower at 27 ns. It is the main relative contribution to the decay (75%) (Table S2, Supporting Information). It suggests that in the case of MAPI, the electron injection towards TiO2 is slower and more difficult in agreement with the lower EQE found (Figure 4b).
Figure 5. Variation of Voc as a function of the light power density. The curve slopes provide the ideality
factor values (nID, numbers in bold).
We measured the cells Voc under various continuous light power densities (I). A white light
12
superior Voc over all the investigated light intensity range. The VOC scaled logarithmically with
I and followed the relationship:
qVOC = Eg + nIDkT ln(I/I0) (2)
with q the elementary charge, k the Boltzmann constant, T the absolute temperature and nID the ideality factor. The latter parameter was determined from the curve fits. It is related to the main recombination phenomena occurring at the Voc.39 In classical semiconductor theory, a value of
1 for this parameter indicates a band-to-band recombination.39,40 Deviation of nID from 1 to 2 reflects the occurrence of trap-assisted Shockley-Read-Hall (SRH) recombination through perovskite intragap defects.39 The higher is nID, the higher is the SRH recombination processes.
nID was the lowest for FAMA at ~1.4 which had a superior quality compared to CsFAMA (nID ~1.5), and especially compared to MAPI (nID ~2.0) (Figure 5). SRH recombination increases from FAMA, CsFAMA and MAPI. However, we will see below that, in PSCs, interfacial recombination always occurs and must be taken into account. Figure 5 illustrates that for an optimized functioning over a large light power density, the nID parameter must be the lower.
3.3 Impedance spectroscopy
The electrical response of the cells has been in-depth investigated by electrical impedance spectroscopy (EIS), a technique which provides in operando characterizations and is safe for the devices.8,11,18,19,40-60 By sweeping the frequency over a wide range, the various electrical phenomena occurring in the PSCs at various time scales can be discriminated. To have a comprehensive overview of the electrical response and well-understand the J-V curves, we have measured spectra under illumination with an applied voltage (Vappl) varied from the short circuit
13 Figure 6. Impedance spectra of the investigated PSCs under illumination. Effect of the applied voltage for (a) MAPI, (b) CsFAMA and (c) FAMA. (d) Comparison of the EIS at 0.7V for the three cells.
Figure 6 shows the effect of Vappl and perovskite on the spectra Nyquist plots (imaginary versus real part plots). We can note that, for all these high-efficiency cells, no inductive loop at intermediate frequencies was observed. It confirms our previous observation18 that this loop is an electric response due to parasitic reactions and is therefore the signature of not optimized devices.18 They have been analyzed by using equivalent electrical circuits (EEC). The most general one, established in our previous work42 takes into account the possible presence of an inductive loop58 and is presented in Figure 7a. In the present work, we have kept the same notations. For each potential, the electrical elements have been extracted by fitting the spectra. For CsFAMA and FAMA, two circle arcs were observed on the spectra (Figure 6b and Figure
6c). They have been analyzed by using the type III EEC presented in Figure 7b which contains
three resistances and two constant phase elements (CPE). Rs is the series resistance due to the contacts and external wires electrical contributions. It is determined by extrapolating the real part of the spectra at high frequencies to the X-axis. Capacitances have been extracted from the CPE elements using the Brug’s protocole61 as explained in our previous work.18,19,42-44,60 and
14
detailed in section D of the Supporting Information. CPE2 and CPE4 have given C2 and C4, respectively. The type IV EEC shown in Figure 7c was employed for fitting the MAPI spectra (Figure 6a). For these cells, a shoulder was found at intermediate frequencies for most of the Vappl which led us to employ an EEC with three relaxations, a R3//CPE3 element being added.
Figure 7. (a) General equivalent electrical circuit. (b,c) EECs employed for fitting (b) the FAMA and CsFAMA spectra and (c) the MAPI spectra.
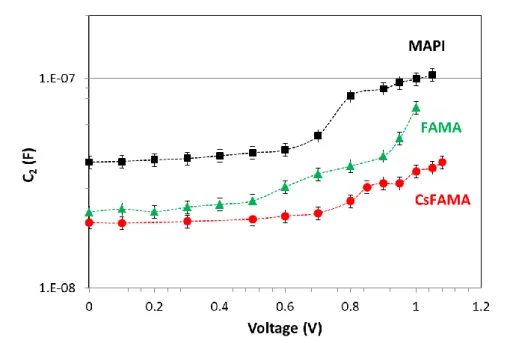
The C2 element is a light insensitive parameter19 which values were well-reproducible for each perovskite. Figure 8 displays the variation of C2 with the applied voltage (Vappl) for the three investigated perovskites. C2 was almost constant below 0.6V while, above this value, it increased and formed a S-shaped curve. In the case of FAMA cells, a fast C2 increase was observed at large Vappl. Below 0.6V, C2 is assigned to the bulk dielectric relaxation of the perovskite material. It is related to the relative permittivity of the perovskite, εr, according to:
C2=εrε0ρ/d (3)
with d the perovskite layer thickness, ρ the layer roughness factor and ε0 the vacuum permittivity (8.85×10⁻¹² F.m-1). The C2 average values for MAPI is 1.6 10-7 F.cm-2 with d
15
measured on SEM cross-sectional views at circa 370 nm (Figure 2a). Assuming ρ=1, εr is
calculated at ~66 for MAPI. This value is in good agreement with our previous study on a MAPI layer prepared using another protocole.19 The same calculation gives ε
r ~41 (C2~0.77 10-7 F.cm -2) for CsFAMA and ε
r ~41 (C2~0.89 10-7 F.cm-2) for MAPI. These values must be taken with care and are overestimated since they neglect any roughness of the layer.
Figure 8. C2 parameter versus the applied voltage. Comparison of the three perovskites.
R2, R4 and C4 elements are light sensitive and are related to the charges photogenerated in the devices.19 R2 versus Vappl curves for the various perovskites are shown in Figure 9a. For Vappl<0.9 V, this parameter varies in a large extent with the perovskite. It increases in the order MAPI, CsFAMA and FAMA cells. Above 0.9V, this parameter drops quickly for the FAMA cell and crosses the other cells curves. This behavior can be linked to the lower Voc measured
for these devices and identify R2 as a recombination resistance. At this point it is interesting to analyze more precisely the TRPL curves presented in Figure 4c. They have been fitted by a tri-exponentials function (Section B, Supporting Information) and the slow decay time (noted τslow)
is found to vary with the perovskite. τslow is measured at 59 ns, 93 ns and 117 ns for MAPI,
CsFAMA and FAMA, respectively (Table S2, Supporting Information). τslow is classically assigned to bulk recombinations (either radiative62,63 or non-radiative63,64) of the photogenerated charges in the perovskite. It scales with the crystal quality and it mitigates with the density of recombination sites in the bulk and at the grain boundaries. We find in Figure
16
R2=1/k2= A exp(τslow) (4)
A is a constant and the fit is excellent (R2=0.999). This relationship between R
2 and τslow has
been assessed by completing the series with a FAMA cell that did not undergo the PEAI treatment (FAMA* dot in Figure 9b). It allows us to assign the R2 component to the recombination occurring in the perovskite layer, especially at the grain boundaries. Recombination resistance R2 is inversely related to the recombination rate (k2) and it provides a direct quantitative view of the recombination rate. The higher is this resistance, the lower is the recombination rate.
Figure 9. (a) R2 parameters as a function of Vappl for the three perovskites. (b) R2 (measured at 0.3V)
versus τslow of TRPL (FAMA* is a FAMA cell without PEAI treatment). Data recorded under
illumination.
R4 is also a recombination resistance but originates from recombinations occurring at or near the interfaces hereafter called interfacial recombinations. In Figure 10a, for Vappl< 0.8V, MAPI and CsFAMA have about the same R4 value while FAMA has the highest R4. This cell presents the best interfaces. Above 0.9V, R4 of CsFAMA is shifted to higher potential compared to MAPI and FAMA. This is in agreement with the higher Voc for CsFAMA cells. The fact of shifting R2 and R4 curves toward higher voltage is favorable for the cell performances since it increases the cell VOC.
In Table S3 (Supporting Information) we report typical values of R2 and R4 at the Voc for the three kinds of cells. The R2/R4 ratio quantifies the relative interfacial versus bulk recombination rates (k4/k2). We observed that in all cases the interfacial recombination rate is dominant. It increases in the order FAMA (3.0), CsFAMA (4.3) and MAPI (7.3). Extracting the resistance values at the Voc, therefore, provides a finer view of the recombination
17
phenomena than steady-state Voc measurements. We have measured R2 at various light intensities and reported their value as a function of the Voc. An exponential fit was found and an ideality factor, noted n’ID, has been then determined.40,59 The ideality factors obtained from EIS and open-circuit potential measurements (nID, see section 3.2) are disclosed in Table S4 (Supporting Information). Similar values are found from both techniques and they change in a similar manner with the perovskite employed. It confirms R2 as a bulk recombination resistance.
Figure 10. (a) R4 and (b) 1/C4 parameters versus Vappl for the three perovskites. (c) Variation of R3 and
C3 of MAPI cells with Vappl.
C4 is a light-sensitive parameter which value dramatically increases with the light irradiation and can reach very high values.19 In our case, C4 attained more than 1.10-1 F.cm-2 at high Vappl.
Jacobs et al.41 have shown that such high values cannot be explained by a charge accumulation layer and cannot be the result of photogenerated charges separated across an interface. There is little doubt that C4 is related to the recombination of charges. Because charge recombination in PSC is a phase delayed phenomenon, in addition to the real component, an imaginary component is also introduced. This imaginary component is analyzed in our work as a capacitance in the equivalent electrical circuits used to fit our data (Figure 7). It is the main
18
contribution of C4. This delayed recombination process is a special behavior occurring in PSCs due to the ionic conductivity of the perovskite. The movements of ions introduce defects that act as recombination centers and affect the dynamics of the charges. To better follow the effect of Vappl and perovskite material, we have chosen to plot the 1/C4 parameter in Figure 10b. This parameter can be directly compared with the recombination resistances. As expected, it dramatically increases from MAPI to CsFAMA and FAMA. Recombinations are suppressed in the latter device. We can also remark that the plot of 1/C4 is similar to that of R2 (Figure 9a).
The low-frequency capacitance C4 modulates the electrical response of the cells under voltage scan at rather low rate in the J-V curve. It produces a current which depends on the scan direction, rate and the value of C4. The higher C4, the higher the current difference between the forward and reverse scans. A consequence is that C4 is related to the J-V curve hysteresis. It increases from FAMA, CsFAMA and MAPI which exhibit HI at ~3%, ~8% and ~14%, respectively (see Figure 10b). We confirm here that C4 is closely related to the hysteresis index: the higher is C4, the higher is the hysteresis amplitude.19,42
In the case of the MAPI cells, we have introduced an intermediate frequency relaxation to well-fit the spectra. The variations of the R3 and C3 parameters with Vappl are presented in
Figure 10c. They were batch dependent but we reproducibly observed rather flat curves for R3 and C3 between 0.0V and 0.6V. It reminds the behavior of C2 and may be related to bulk properties rather than interfacial ones. However, with the actual knowledge on the EIS response of PSCs, it is difficult to clearly state which physical process occurring in the cells is at the origin of these parameters.
The conclusion of the EIS investigation is that for PSC of very high efficiency, Rs must be minimized; R2, R4 and 1/C4 must be the highest as possible to get high Jsc and FF. Moreover, for a high FF, the drop of these light-sensitive components must be as abrupt as possible and for a high Voc, the drop must be voltage-shifted at most.
3.4 Electrical stability of the devices
The future of the perovskite technology will depend on the ability of obtaining stable devices. Their robustness against electrical stresses and light irradiation are key parameters that must be carefully investigated. We performed a first test consisting in measuring the J-V curves of the cells, before and after their EIS investigation.11 EIS measurements, in which PSCs are
19
submitted to a continuous light irradiation, to the application of many voltages and to a superimposed ac stimulus during about one hour, are especially stressing for the PSCs. Table
2 reports the J-V curves result before and after the EIS characterization, for the different
perovskites. The performances of the MAPI cells measured on the reverse scan slightly increased upon the measurements. The PCE of the forward scan was decreased due to the FF parameter mitigation. The CsFAMA cells were the most affected by the EIS measurements. Their efficiency was measured lower after the EIS characterization. FAMA devices were remarkably stable since they exhibited a slightly higher PCE after EIS characterizations due to the increase of the VOC. Their HI parameter remained low and almost unchanged.
Table 2. J-V curves parameters of PSCs with various perovskites before and after their investigation by EIS. Sample Voc /V Jsc / mA.cm-2 FF / % PCE / % HI /% MAPI Before Reverse 1.045 22.19 78.42 18.18 12 Forward 1.026 22.18 70.19 15.97 After Reverse 1.057 23.19 75.87 18.60 16 Forward 1.033 23.13 65.41 15.63 CsFAMA Before Reverse 1.077 21.81 77.63 18.24 7 Forward 1.052 21.81 73.63 16.88 After Reverse 1.049 21.64 74.18 16.83 8 Forward 1.027 21.66 69.23 15.40 FAMA Before Reverse 1.035 25.65 79.62 21.13 2 Forward 1.031 25.69 77.81 20.61 After Reverse 1.044 25.71 79.36 21.29 3 Forward 1.045 25.71 77.17 20.73
We also compared the stability of the unencapsulated solar cells under a one sun AM 1.5G light irradiation and at a relative humidity (RH) of 45%, tracking them at their maximum power points (MPP). The curves are disclosed in Figure 11a. During 200 min, the MAPI cell presented the fastest decrease. The fact that the MAPI cell was less stable under the solar simulator compared to the EIS measurement could be due to the UV light component in the former irradiation spectrum. The CsFAMA cell PCE decreased more slowly at the beginning but the two curves crossed at 200 min. After 300 min, the MAPI cell had lost 37% of its initial PCE and the CsFAMA cell 42%. The FAMA cell was remarkably stable and no PCE loss was
20
observed. Figures 11b-d are the J-V curves measured before and afterthe tracking experiments. MAPI cell presented a lower Voc and a large hysteresis after the stability test. CsFAMA cell exhibited a decrease of the Jsc and an enlargement of the hysteresis. We noted a remarkable stability of the FAMA cell under the test since the J-V curves were unchanged after the long irradiation and tracking period.
Figure 11. (a) Tracking of MAPI, CsFAMA and FAMA solar cells normalized power outputs under continuous one sun AM1.5G illumination (unencapsulated devices 45% RH). (b-d) J-V curves were measured before and after the tracking experiment under 1sun AM1.5G illumination. (b) MAPI; (c) CsFAMA and (d) FAMA cells.
This paper focusses on the effect of the monovalent cation composition on the electrical properties of PSCs. A study of the PSCs stability under high-moisture environment is given in Section E of the Supporting Information. None of them, when unencapsulated, were highly robust when stored in a chamber with a 90% RH at 20°C (Figure S4 and Figure S6, Supporting Information). It can be assigned to the presence of the hydrophilic MA cation in their structure. They should need additional efficient barrier layers against moisture to be fully stabilized. The
(a)
(b)
21
final PCE was the best for FAMA. We have also found that MAPI was decomposed upon aging in PbI2 with the elimination of MAI (MAI can be degraded into volatile CH3I and NH3 molecules).26 On the other hand, CsFAMA and FAMA were degraded in the photo-inactive one-dimensional (1D) δ-phase that may be regenerated in their photoactive α-phase, for instance by heating (Figure S5, Supporting Information).
Scheme1. Main information extracted from the electrical impedance spectroscopy data and their correlations with other measurements. Light sensitive element.
Conclusions
In conclusion, we have fully investigated the electrical response of solar cells prepared with perovskite ranging from the mono-cation to the tri-cation composition. The best results have been found with the double MA/FA lead iodide compound which was prepared using MACl additive in the precursor solution. This strategy has been found the most accurate to achieve high efficiency and stability. It is more efficient than to complicate the perovskite composition. FAMA presented the best morphology, crystallinity and optical properties for the application. The ideality factor decreased from MAPI, CsFAMA and FAMA. For the later SRH recombination with the less intensity was found. The cells have been thoroughly investigated by impedance spectroscopy over a wide applied potential range. We have proposed two EECs based on our general EEC for analyzing the electrical response of the three kinds of solar cells. For all these optimized devices, with high efficiency for their category, no inductive loop at intermediate-frequency due to parasitic reaction was found. The main information extracted
22
from the electrical impedance spectroscopy data and their correlations with other measurements are summarized in Scheme 1. We have extracted the dielectric permittivity of the three perovskites from the high-frequency capacitance C2 and measured them at 66, 41 and 41 for MAPI, CsFAMA and FAMA, respectively. We have found a fair relationship between the high-frequency resistance R2 and the slow decay time τslow of the OIHP TRPL. This has led us to assign R2 to recombination occurring in the perovskite bulk and grain boundaries. The low-frequency resistance R4 has been assigned to the recombination at and near the interfaces. The low-frequency capacitance C4 which modulates the electrical response of the cells under voltage scan at rather low rate has been assigned to a phase delayed recombination phenomenon, the delay being a consequence of the ionic mobility and defect formation. For these three recombination related electrical elements, the best values have been found for our highly efficient FAMA cell which is almost hysteresis-free. Finally, under electrical and light irradiation stresses, the investigated FAMA cell was highly stable while MAPI was more stable than CsFAMA. Finally, the strategy of mediating the growth of FA1-xMAxPbI3 perovskite double cation by MACl additive is found the best to suppress recombinations, suppress ion mobility, reach high efficiency with low hysteresis and stabilize the perovskite compound.
Acknowledgements
Mr J. Liu and Dr L. Coolen (INSP, Sorbonne University, France) are acknowledged for TRPL measurements. T.Z. thanks the Chinese Scholarship Council and D.Z thanks the Chinese Scholarship Council-Paristech programme for Ph.D scholarships (grant numbers 201706340053 and 201806310126, respectively). The ANR agency is acknowledged for financial support (Moreless project ANR-18-CE05-0026).
Supporting Information
The Supporting Information is available free of charge at
https://pubs.acs.org/doi/ XXXXXXXXXXXXXXXXXXXXXXXXXX
Complementary experimental details; XRD patterns of the perovskite layers; EDX analysis; Optical characterizations of the three perovskite layers; Fitting of the TRPL curves; TRPL curves parameters; J-V forward and reverse curves of the three perovskites solar cells; Analysis of the impedance spectra; R2 and R4 measured at the Voc; Comparison of the ideality factors determined from EIS and Voc measurements; Aging tests at high moisture.
23 References
(1) Kim, H.S.; Lee, C.R.; Im, J.H.; Lee, K.H.; Moehl, T.; Marchioro, A.; Moon, S.J.; Robin, H.B.; Yum, J.H.; Moser, J.E.; Gratzel, M. Lead Iodide Perovskite Sensitized All-Solid-State Submicron Thin Film Mesoscopic Solar Cell with Efficiency Exceeding 9%. Sci. Rep. 2012, 2, 591.
(2) Leyden, M.R.; Terakawa, S.; Matsushima, T.; Terakawa, S.; Ruan, S.; Goushi, K.; Auffray, M; Sandanayaka, A.S.D.; Qin, C.Y.; Bencheikh, F.; Adachi, C. Distributed Feedback Lasers and Light-Emitting Diodes Using 1-Naphthylmethylamnonium Low-Dimensional Perovskite.
ACS Photonics 2019, 6, 460-466.
(3) Wei, Y.; Cheng, Z.Y.; Lin, J. An Overview on Enhancing the Stability of Lead Halide Perovskite Quantum Dots and Their Applications in Phosphor-Converted LEDs. Chem. Soc.
Rev. 2019, 48, 310-350.
(4) Miao, J.L.; Zhang, F.J. Recent Progress on Highly Sensitive Perovskite Photodetectors. J.
Mater. Chem. C 2019, 7, 1741-1791.
(5) Mykhaylyk, V.B.; Kraus, H.; Saliba, M. Bright and Fast Scintillation of Organolead Perovskite MAPbBr3 at Low Temperatures. Mater. Horiz. 2019, 6, 1740-1747.
(6) Zhu, T.; Zheng, D.; Rager, M.-N.; Pauporté, T. Actual Organic Cations Composition Determination in Perovskite Thin Films. Application to Formamidinium Lead Iodide Stabilization for High Efficiency Solar Cell. Sol. RRL 2020, 2000348.
(7) Zhang, J.; Barboux, P.; Pauporté, Th. Electrochemical Design of Nanostructured ZnO Charge Carrier Layers for Efficient Solid-State Perovskite-Sensitized Solar Cells. Adv. Energy
Mater. 2014, 4, 1400932.
(8) Zhang, J.; Juárez-Pérez, E.J.; Mora-Seró, I.; Viana, B.; Pauporté, Th. Fast and Low Temperature Growth of Electron Transport Layers for Efficient Perovskite Solar Cells. J.
Mater. Chem. A. 2015, 3, 4909–4915.
(9) Yoo, J.J.; Wieghold, S.; Sponseller, M.C.; Chua, M.R.; Bertram, S.N.; Hartono, N.T.P.; Tresback, J.S.; Hansen, E.C.; Correa, B.J.P.; Bulovic, V.; Buonassisi, T.; Shin, S.S.; Bawendi, M.G. An Interface Stabilized Perovskite Solar Cell with High Stabilized Efficiency and Low Voltage Loss. Energy Environ. Sci. 2019, 12, 2192-2199.
(10) Liu, Y.; Akin, S.; Pan, L.; Uchida, R.; Arora, N.; Milic, J.V.; Hinderhofer, A.; Schreiber, F.; Uhl, A.R.; Zakeeruddin, S.M.; Hagfeldt, A.; Dar, M.L.; Gratzel, M. Ultrahydrophobic 3D/2D Fluoroarene Bilayer-Based Water-Resistant Perovskite Solar Cells with Efficiencies Exceeding 22%. Sci. Adv. 2019, 5, eaaw2543.
(11) Pitarch-Tena, D.; Ngo, T.T.; Vallés-Pelarda, M.; Pauporté, Th.; Mora-Seró, I. Impedance Spectroscopy Measurements in Perovskite Solar Cells. Device Stability During the Measurement and Noise Reduction. ACS Energy Lett. 2018, 3, 1044−1048.
24
(12) Nie, W.; Tsai, H.; Asadpour, R.; Blancon, J. C.; Neukirch, A. J.; Gupta, G.; Crochet, J. J.; Chhowalla, M.; Tretiak, S.; Alam, M. A.; Wang, H. L. Solar cells. High-Efficiency Solution-Processed Perovskite Solar Cells with Millimeter-Scale Grains. Science 2015, 347, 522–525. (13) Zhang, J.; Pauporté, T. Effects of Oxide Contact Layer on the Preparation and Properties of CH3NH3PbI3 for Perovskite Solar Cell Application. J. Phys. Chem. C 2015, 119, 14919−14928.
(14) Zhang, J.; Pauporté, T. One‐Dimensional Self‐Standing TiO2 Nanotube Array Layers Designed for Perovskite Solar Cell Applications. ChemPhysChem, 2015, 16, 2836–2841. (15) Tu, Y. G.; Xu, G. N.; Yang, X. Y.; Zhang, Y. F.; Li, Z. J.; Su, R.; Luo, D. Y.; Yang, W. Q.; Miao, Y.; Cai, R.; Jiang, L. H.; Du, X. W.; Yang, Y. C.; Q. Liu, S.; Gao, Y.; Zhao, S.; Huang, W.; Gong, Q. H.; Zhu, R. Mixed-Cation Perovskite Solar Cells in Space. Sci.
China-Phys. Mech. Astron. 2019, 62, 974221-1–974221-4.
(16) Yang, W. S.; Park, B. W.; Jung, E. H.; Jeon, N. J.; Kim, Y. C.; Lee, D. U.; Shin, S. S.; Seo, J. E.; Kim, K.; Noh, J. H.; Seok, S. I. Iodide Management in Formamidinium-Lead-Halide-Based Perovskite Layers for Eefficient Solar Cells. Science 2017, 356, 1376–1379.
(17) Leblanc, A.; Mercier, N.; Allain, M.; Dittmer, J.; Fernandez, V.; Pauporté, T. Lead- and Iodide-Deficient (CH3NH3)PbI3 (d-MAPI): The Bridge Between 2D and 3D Hybrid Perovskites. Angew. Chem., Int. Ed. 2017, 56, 16067–16072.
(18) Wang, P.; Shao, Z.; Ulfa, M.; Pauporté, T. Insights into the Hole Blocking Layer Effect on the Perovskite Solar Cell Performance and Impedance Response. J. Phys. Chem. C 2017, 121, 9131–9141.
(19) Wang, P. J.; Ulfa, M.; Pauporté, T. Effects of Perovskite Monovalent Cation Composition on the High and Low Frequency Impedance Response of Efficient Solar Cells. J. Phys. Chem.
C 2018, 122, 1973−1981.
(20) Stranks, S.D.; Eperon, G.E.; Grancini, G.; Menelaou, C.; Alcocer, M.J.P.; Leijtens, T.; Herz, L.M., Petrozza, A.; Snaith, H.J. Electron-Hole Diffusion Lengths Exceeding 1 Micrometer in an Organometal Trihalide Perovskite Absorber. Science 2013, 342, 341-344. (21) Leung, S.F.; Ho, K.T.; Kung, P.K.; Hsiao, V.K.S.; Alshareef, H.N.; Wang, Z.L.; He, J.H. A Self‐Powered and Flexible Organometallic Halide Perovskite Photodetector with Very High Detectivity. Adv. Mater. 2018, 30, 1704611.
(22) NREL chart 2020, https://www.nrel.gov/pv/cell-efficiency.html.
(23) Bartel, C. J.; Sutton, C. B.; Goldsmith, R.; Ouyang, R.; Musgrave, C. B.; Ghiringhelli, L.M.; Scheffler., M. New Tolerance Factor to Predict the Stability of Perovskite Oxides and Halides. Sci. Adv. 2019, 5, eaav0693.
(24) M.; Matsui, T.; Seo, J.-Y.; Domanski, K.; Correa-Baena, J.-P.; Nazeeruddin, M. K.; Zakeeruddin, S. M.; Tress, W.; Abate, A.; Hagfeldt, A.; Grätzel, M. Cesium-Containing Triple Cation Perovskite Solar Cells: Improved Stability, Reproducibility and High Efficiency. Energy
25
(25) Saliba, M.; Matsui, T.; Domanski, K.; Seo, J.-Y.; Ummadisingu, A.; Zakeeruddin, S. M.; Correa-Baena, J.-P.; Tress, W.R.; Abate, A.; Hagfeldt, A.; Grätzel, M. Incorporation of Rubidium Cations into Perovskite Solar Cells Improves Photovoltaic Performance. Science
2016, 354, 206-209.
(26) Turren-Cruz, S.-H.; Hagfeldt, A.; Saliba, M. Methylammonium-Free, High-Performance, and Stable Perovskite Solar Cells on a Planar Architecture. Science 2018, 362, 449–453. (27) Kim, M.; Kim, G.H.; Lee, T.K.; Choi, I.W.; Choi, H.W.; Jo, Y.; Yoon, Y.J.; Kim, J.W.; Lee, J.; Huh, D.; Lee, H.; Kwak, S.K.; Kim, J. Y.; Kim, D. S. Methylammonium Chloride Induces Intermediate Phase Stabilization for Efficient Perovskite Solar Cells. Joule 2019, 3, 1– 14.
(28) Zhu, T.; Su, J.; Labat, F.; Ciofini, I.; Pauporté, Th. Interfacial Engineering through Chloride-Functionalized Self-Assembled Monolayer for High Efficiency Perovskite Solar Cells. ACS Appl. Mater Interfaces 2020, 12, 744-752.
(29) Ulfa, M.; Wang, P.; Shao, Z.; Viana, B.; Pauporté, T. Oxide Hole Blocking Selective Contacts in Perovskite Solar Cells. Proc. SPIE 2018, 10533, 105332R1-105332R10.
(30) Nazeeruddin, M. K.; Braukyla, T.; Xia, R.; Daskeviciene, M.; Malinauskas, T.; Gruodis, A.; Jankauskas, V.; Roldán-Carmona, C.; Momblona, C.; Getautis, V.; Fei, Z. Inexpensive Hole Transporting Materials Derived from Tröger’s Base Afford Efficient and Stable Perovskite Solar Cells. Angew. Chem. Int. Ed. 2019, 58, 11266–11272.
(31) Xia, R.; Fei, Z.; Drigo, N.; Bobbink, F. D.; Huang, Z.; Jasiūnas, R.; Franckevičius, M.; Gulbinas, V.; Mensi, M.; Fang, X.; Roldán-Carmona, C. Retarding Thermal Degradation in Hybrid Perovskites by Ionic Liquid Additives. Adv. Funct. Mater. 2019, 29, 1902021.
(32) Le Bahers, T.; Labat, F.; Pauporté, T.; Ciofini, I. Effect of Solvent and Additives on the Open Circuit Voltage of ZnO Based Dye-Sensitized Solar Cells: A Combined Theoretical and Experimental Study. Phys. Chem. Chem. Phys. 2010, 12, 14710–14719.
(33) Kusumawati, Y.; Martoprawiro, M. A.; Pauporté, Th. Effects of Graphene in Graphene/TiO2 Composite Films Applied to Solar Cell Photoelectrode. J. Phys. Chem. C 2014,
118, 9974–9981.
(33) Zong, B.; Fu, W.; Guo, Z.A.; Wang, S.; Huang, L.; Zhang, B.; Bala, H.; Cao, J.; Wang, X.; Sun, G.; Zhang, Z. Highly Stable Hole-Conductor-Free Perovskite Solar Cells Based Upon Ammonium Chloride and a Carbon Electrode. J. Colloid Interface Sci. 2019, 540, 315–321. (34) Rong, Y.; Hou, X.; Hu, Y.; Mei, A.; Liu, L.; Wang, P.; Han, H. Synergy of Ammonium Chloride and Moisture on Perovskite Crystallization for Efficient Printable Mesoscopic Solar Cells. Nat. Commun, 2017, 8, 14555.
(35) Dai, X.Z.; Deng, Y.H.; Charles, H.; Brackle, V.; Chen, S.S.; Rudd, P.N.; Xiao, X.; Lin, Y.; Chen, B.; Huang, J.S. Scalable Fabrication of Efficient Perovskite Solar Modules on Flexible Glass Substrates. Adv. Energy Mater. 2020, 10, 1903108.
26
(36) Aldibaja, F.K.; Badia, L.; Mas-Marza, E.; Sanchez, R.S.; Barea, E.M.; Mora-Sero, I. Effect of Different Lead Precursors on Perovskite Solar Cell Performance and Stability. J. Mater.
Chem. A 2015, 3, 9194-9200.
(37) Xie, F.; Chen, C.-C. ; Wu, Y.; Li, X. ; Cai, M. ; Liu, X. ; Yang, X. ; Han, L. Vertical Recrystallization for Highly Efficient and Stable Formamidinium-Based Inverted-Structure Perovskite Solar Cells, Energy Envinron. Sci. 2017, 10, 1942-1949.
(38) Yoo, H.-S, Park, N.G. Post-Treatment of Perovskite Film with Phenylalkylammonium Iodide for Hysteresis-Less Perovskite Solar Cells.Sol. Energy Mater. Sol. Cells 2018, 179, 57–
65
(39) Tress, W.; Yvari, M.; Domanski, K.; Yadav, P.; Niesen, B.; Correa Baena, J.P.; Hagffeldt, A.; Graetzel, M. Interpretation and Evolution of Open-Circuit Voltage, Recombination, Ideality Factor, Subgap Defect States During Reversible Light-Soaking and Irreversible Degradation of Perovskite Solar Cells. Energy Environ. Sci. 2018, 11, 151–165.
(40) Contreras-Bernal, L.; Salado, M.; Todinova, A. ; Calio, L. ; Ahmad, S.; Idigoras, J.; Anta, J.A. Origin and Whereabout of Recombination in Perovskite Solar Cells. J. Phys. Chem. C
2017, 121, 9705-9713.
(41) Jacobs, D. A.; Shen, H.; Pfeffer, F.; Peng, J.; White, T. P.; Beck, F.J.; Catchpole, K.R. The Two Faces of Capacitance: New Interpretations for Electrical Impedance Measurements of Perovskite Solar Cells and their Relation to Hysteresis. J. Appl. Phys. 2018, 124, 225702. (42) Ulfa, M.; Zhu, T.; Goubard, F.; Pauporté, T. Molecular versus Polymeric Hole Transporting Materials for Perovskite Solar Cell Application. J. Mater. Chem. A 2018, 6, 13350–13358.
(43) Ulfa, M.; Wang, P.J.; Zhang, J.; Liu, W.; Marcillac, D.; Coolen, L.; Peralta, S.; Pauporté, T. Charge Injection and Electrical Response in Low-Temperature SnO2-Based Efficient Perovskite Solar Cells. ACS Appl. Mater. Interfaces 2018, 10, 35118–35128.
(44) Ulfa, M.; Pauporté, T.; Bui, T.T.; Goubard, F. Impact of Organic Hole Transporting Material and Doping on the Electrical Response of Perovskite Solar Cells. J. Phys. Chem. C.
2018, 122, 11651–11658.
(45) Almora, O.; Aranda, C.; Mas-Marzá, E.; Garcia-Belmonte, G. On Mott-Schottky Analysis Interpretation of Capacitance Measurements in Organometal Perovskite Solar Cells. Appl.
Phys. Lett. 2016,109, 173903.
(46) Pascoe, A.R; Duffy, N.W.; Scully, A.D.; Huang, F.; Cheng, Y.B. Insights into Planar CH3NH3PbI3 Perovskite Solar Cells using Impedance Spectroscopy. J. Phys. Chem. C 2015,
119, 4444−4453
(47) Juarez-Perez, E.J.; Wuβler, M.; Fabregat-Santiago, F.; Lakus-Wollny,K.; Mankel, E.; Mayer, T.; Jaegermann, W.; Mora-Sero, I. Role of the Selective Contacts in the Performance of Lead Halide Perovskite Solar Cells. J. Phys. Chem. Lett. 2014, 5, 680−685.
27
(48) Juarez-Perez, E.J.; Sanchez, R.S.; Badia, L.; Garcia-Belmonte, G.; Kang, Y.S.; Mora-Sero, I.; Bisquert, J. Photoinduced Giant Dielectric Constant in Lead Halide Perovskite Solar Cells.
J. Phys. Chem. Lett. 2014, 5, 2390−2394.
(49) Dualeh, A.; Moehl, T.; Tétreault, N.; Teuscher, J.; Gao, P.; Nazeeruddin, M.K.; Grätzel, M. Impedance Spectroscopic Analysis of Lead Iodide Perovskite-Sensitized Solid-State Solar Cells. Sci. Rep. 2014, 8, 362–373.
(50) Gonzalez-Pedro, V.; Juarez-Perez, E.J.; Arsyad, W.S.; Barea, E.M.; Fabregat-Santiago, F.; Mora-Sero, I.; Bisquert, J. General Working Principles of CH3NH3PbX3 Perovskite Solar Cells.
Nano Lett. 2014, 14, 888−893.
(51) Almora, O.; Zarazua, I.; Mas-Marza, E.; Mora-Sero, I.; Bisquert, J.; Garcia-Belmonte, G. Capacitive Dark Currents, Hysteresis, and Electrode Polarization in Lead Halide Perovskite Solar Cells. J. Phys. Chem. Lett. 2015, 6, 1645−1652.
(52) Guerrero, A.; Juarez-Perez, E.J.; Bisquert, J.; Mora-Sero, I.; Garcia-Belmonte, G. Electrical Field Profile and Doping in Planar Lead Halide Perovskite Solar Cells. Appl. Phys.
Lett. 2014, 105, 133902.
(53) Kim, H.-S.; Mora-Sero, I.; Gonzalez-Pedro, V.; Fabregat-Santiago, F.; Juarez-Perez, E. J.; Park, N.-G.; Bisquert, J. Mechanism of Carrier Accumulation in Perovskite Thin-Absorber Solar Cells. Nat. Commun. 2013, 4, 2242.
(54) Zarazua, I.; Han, G.F.; Boix, P.P.; Mhaisalkar, S.; Fabregat-Santiago, F.; Mora-Sero, I.; Bisquert, J.; Garcia-Belmonte, G. Surface Recombination and Collection Efficiency in Perovskite Solar Cells from Impedance Analysis. J. Phys. Chem. Lett., 2016, 7, 5105-5113. (55) Yang, T.-Y.; Gregori, G.; Pellet, N.; Grätzel, M.; Maier, J. The Significance of Ion Conduction in a Hybrid Organic-Inorganic Lead Iodide-Based Perovskite Photosensitizer.
Angew. Chem., Int. Ed. 2015, 54, 7905−7910.
(56) Anaya M.; Zhang, W.; Clasen Hames, B.; Li, Y.; Fabregat-Santiago, F.. Calvo, M.E.; Snaith, H.J.; Miguez, H.; Mora-Sero I. Electron Injection and Scaffold Effects in Perovskite Solar Cells. J. Mater. Chem. C 2017, 5, 634-644.
(57) Pockett, A.; Eperon, G. E.; Sakai, N.; Snaith, H. J.; Peter, L. M.; Cameron, P. J. Microseconds, Milliseconds and Seconds: Deconvoluting the Dynamic Behavior of Planar Perovskite Solar Cells. Phys. Chem. Chem. Phys. 2017, 19, 5959−5970.
(58) Guerrero, A.; Garcia-Belmonte, G.; Mora-Sero, I. ; Bisquert, J. ; Kang, Y.S. ; Jacobsson, T.J. ; Correa-Baera, J.P. ; Hagfeldt, A. Properties of Contact and Bulk Impedance in Hybrid Lead Halide Perovskite Solar Cells Including Inductive Loop Elements. J. Phys. Chem. C
2016, 120, 8023-8032.
(59) Correa-Baena, J.P.; Turren-Cruz, S.H.; Tress, W.; Hagfeldt, A.; Aranda, C.; Shooshtari, L.; Bisquert, J.; Guerrero, A. Change from Bulk to Surface Recombination Mechanism between Pristine and Cycled Perovskite Solar Cells. ACS Energy Lett. 2017, 2, 681-688. (60) Zhu, T.; Zheng, D.; Liu, J.; Coolen, L.; Pauporté, T. Electrical Response of High Efficiency and Stable Solar Cells Based on MACl Mediated Grown FA0.94MA0.06PbI3 Perovskite. ACS Appl. Mater. Interfaces 2020, 12, 37197−37207
28
(61) Brug, G.J.; Van Der Eeden, A.L.G.; Sluyters-Rehbach, M.; Sluyters, J.H. The Analysis of Electrode Impedance Complicated by the Presence of a Constant Phase Element. J. Electroanal.
Chem. 1984, 176, 275-295.
(62)Lee, J.W.; Dai, Z.; Han; T.H.; Choi, C.; Chang, S.Y.; Lee, S.J.; De Marco, N.; Zhao, H.; Sun, P.; Huang, Y.; Yang, Y.2D Perovskite Stabilized Phase-Pure Formamidinium Perovskite Solar Cells. Nat. Commun. 2018, 9, 3021.
(63) Zhu, H.; Liu, Y.; Eickemeyer, F.T.; Pan, L.; Ren, D.; Ruiz, M.; Brian Carlsen, B.; Yang, B.; Wang, S.; Wang, Z.; Liu, H.; Zakeeruddin, S.M.; Hagfeldt, A.; Ibrahim Dar, M.; Li, X.; Grätzel, M. Tailored Amphiphilic Molecular Mitigators for Stable Perovskite Solar Cells with 23.5% Efficiency. Adv. Mater. 2020, 1907757, 32.
(64) Bi, D.; Tress, W.; Dar I.; Gao, P.; Luo,J.; Renevier, C.; Kurt Schenk, K.; Abate A.; Giordano, F.; Correa Baena, J.P.; Decoppet, J.D.; Zakeeruddin, S.M.; Nazeeruddin, M.K.; Grätzel, M.; Hagfeldt, A. Efficient Luminescent Solar Cells Based on Tailored Mixed-Cation Perovskites. Sci. Adv. 2016, 2:e1501170.
29 TOC