December
MIRAGE, a Computable General Equilibrium Model
for Trade Policy Analysis
_____________
Mohamed Hedi Bchir, Yvan Decreux,
Jean-Louis Guérin & Sébastien Jean
for Trade Policy Analysis
_____________
Mohamed Hedi Bchir, Yvan Decreux,
Jean-Louis Guérin & Sébastien Jean
No 2002 – 17
December
TABLE OF CONTENTS
ABSTRACT... 5
RÉSUMÉ ... 5
NO N-TECHNICAL SUMMARY... 7
RÉSUMÉ NON TECHNIQUE... 9
1. INTRODUCTION...11
2. THE MIRAGE MODEL...13
The demand side...13
The supply side...15
Capital, investment and macro-economic closure ...18
Dynamic set-up...20
3. AN ILLUSTRATION: ASSESSING THE IMPACT OF A TRADE LIBERALISATION BETWEEN THE EUROPEAN UNION AND ITS PERIPHERY...21
Results using MIRAGE...22
Sensitivity to the assumption of a lower substitutability between quality ranges ...25
Sensitivity to imperfect competition...27
Sensitivity to foreign direct investment...30
Sensitivity to the dynamic structure...30
4. CONCLUSION...31
REFERENCES...33
ANNEX 1: DATA SOURCES...37
ANNEX 2: AGGREGATION CHOICES FOR THE SIMULATIONS PRESENTED...39
ANNEX 3: A NEW CALIBRATION PROCEDURE UNDER IMPERFECT COMPETITION...41
ANNEX 4: EQUATIONS OF THE MIRAGE MODEL...45
M
IRAGE,
AC
OMPUTABLEG
ENERALE
QUILIBRIUMM
ODELFOR
T
RADEP
OLICYA
NALYSISA
BSTRACTMIRAGE is a multi-region, multi-sector computable general equilibrium model, devoted to trade policy analysis. It incorporates imperfect competition, product differentiation by variety and by quality, and foreign direct investment, in a sequential dynamic set-up where installed capital is assumed to be immobile. Adjustment inertia is linked to capital stock reallocation and to market structure changes. MIRAGE draws upon a very detailed measure of trade barriers and of their evolution under given hypotheses, thanks to the database MAcMaps. Simulations of a trade liberalisation between the European Union and its periphery illustrate the sensitivity to the main assumptions.
JEL Classification: D58; F12; F13.
Key Words: Computable general equilibrium model, trade policy, dynamics, foreign direct investment, imperfect competition.
R
ÉSUMÉMIRAGE est un modèle d’équilibre général calculable multi-sectoriel et multi-régional, destiné à l’analyse des politiques commerciales. Il incorpore des éléments de concurrence imparfaite, de différenciation des produits par variétés et par gammes de qualité, et d’investissement direct à l’étranger, dans un cadre dynamique séquentiel où le capital installé est supposé immobile. Les inerties d’ajustement y sont liés à la réallocation du stock de capital et à l’évolution des structures de marché. MIRAGE s’appuie sur une mesure bilatérale très détaillée des barrières aux échanges et de leur évolution sous différentes hypothèses, grâce à la base MAcMaps. La sensibilité des résultats aux principales hypothèses est illustrée par des simulations d’une libéralisation commerciale entre l’Union européenne et sa périphérie.
Classification JEL : D58 ; F12 ; F13
Mots-clés : Modèle d’équilibre général calculable, politique commerciale, dynamique, investissement direct à l’étranger, concurrence imparfaite.
M
IRAGE,
AC
OMPUTABLEG
ENERALE
QUILIBRIUMM
ODELFOR
T
RADEP
OLICYA
NALYSISN
ON-T
ECHNICALS
UMMARYAlmost ten years after Marrakech's agreements, and as Doha's Ministerial Conference launched a new round of multilateral negotiations, the stakes of trade policies are still very complex. In this context, delivering a rigorous and detailed quantitative analysis of a large scope of trade agreements is most useful, for policy-makers as well as for the public debate. This is the reason why the CEPII has decided to develop and to maintain, in collaboration with the ITC (International Trade Centre, UNCTAD-WTO, Geneva), a sector, multi-region computable general equilibrium (CGE) model, nicknamed MIRAGE (for Modelling International Relationships in Applied General Equilibrium), devoted to trade policy analysis.
MIRAGE describes imperfect competition in an oligopolistic framework à la Cournot . It accounts for horizontal product differentiation linked to varieties, but also to geographical origin (nested Armington – Dixit-Stiglitz utility function). A new calibration procedure allows the available information on these aspects to be used efficiently. The modelling is done in a sequential dynamic set-up, where the number of firms by sector adjusts progressively, and where installed capital is assumed to be immobile, even across sectors. Capital reallocation therefore only results from the combined effect of depreciation and investment. It makes it possible to describe the adjustment lags of capital stock, and the associated costs.
Compared to previous applied CGE trade models, MIRAGE has in addition three main distinctive features, aimed at improving the description of trade policies' main transmission channels:
• FDIs are explicitly described, with a modelling both theoretically consistent (with agents' behaviour, and with domestic investment setting), and consistent with the empirical results about FDIs' determinants and their order of magnitude;
• a notion of vertical product differentiation is introduced, by distinguishing two quality ranges, according to the country of origin of the product;
• trade barriers are described by the MAcMaps database (see Bouët, Fontagné, Mimouni and Pichot, 2002), that provides with a measure of valorem tariffs, and of the ad-valorem equivalent of specific tariffs, tariff quotas, prohibitions and anti-dumping duties, at the bilateral level, for 137 countries with 220 partners. Preferential agreements are taken into account in a quasi-exhaustive way. This information, available at the level of 5 000 to 10 000 products (HS6 or HS10 classification, according to the country), is used to describe the initial level of trade barriers, but also to build scenarios. Assumptions concerning the changes in these barriers can thus be made at the product
level, possibly depending on their initial level. Only then are these data aggregated in the model's nomenclature, according to a procedure designed to limit the extent of the endogeneity bias. As a result, MIRAGE is based on a description of trade barriers that, besides its precision, preserves the bilateral dimension of the information, contrarily to what is commonly done in applied modelling.
Except for data on trade barriers, the model uses GTAP 5 database (see Dimaranan and Mac Dougall, 2002). This allows a wide flexibility in choosing the sectoral and geographical aggregations of MIRAGE, that may be changed for each application.
For the sake of illustration, simulations are carried out to evaluate the impact of removing trade barriers between the EU and its periphery, defined in a broad sense as CEECs, Maghreb and Turkey. The results using the standard version of MIRAGE show that significant trade creation would take place between the two areas, mainly in agriculture and agro-food, in EU's vehicle exports, and in the periphery's textile and clothing exports. However, the welfare impact in the medium-term (after 13 years) would be (insignificantly) negative for the periphery: the asymmetric nature of the scenario (due to the higher initial bilateral barriers imposed by the periphery) would indeed induce a terms of trade loss for the periphery and, most of all, the removal of trade barriers with the EU only would confer the periphery a very inefficient protection structure, preventing this area from benefiting from such a liberalisation. In contrast, the welfare impact would be slightly positive for the EU.
These results are compared to those obtained using different assumptions in four key areas: vertical product differentiation, the nature of competition, the dynamic set-up, and FDIs. The differences appear to be significant, illustrating in particular the contribution of FDIs and of the pro-competitive effect to the impact on welfare. Vertical differentiation also matters, and it is of particular importance in shaping the trade effects. Finally, introducing a technological externality linked to FDIs is shown to have an overwhelming impact on welfare. This validates the cautious approach taken in MIRAGE of not introducing any externality in the standard version, for the sake of robustness.
MIRAGE,
UN MODÈLE D'
ÉQUILIBRE GÉNÉRAL CALCULABLEPOUR L
'
ÉVALUATION DES POLITIQUES COMMERCIALESR
ÉSUMÉ NON TECHNIQUEPresque dix ans après les accords de Marrakech, et alors que la Conférence ministérielle de Doha a lancé un nouveau cycle de négociations multilatérales, les enjeux des politiques commerciales apparaissent toujours très complexes. Dans ce contexte, il apparaît plus que jamais nécessaire, pour les décideurs de politique économique comme pour le débat public, de disposer d’outils permettant une analyse quantitative rigoureuse et circonstanciée d’une large gamme d’accords commerciaux. C’est pourquoi le CEPII a décidé de développer et de maintenir, en collaboration avec le CCI (Centre du Commerce International, OMC-CNUCED, Genève), un modèle d’équilibre générale calculable (MEGC) multi-sectoriel et multi-régional, destiné à l’analyse des politiques commerciales : le modèle MIRAGE (Modelling International Relationships in Applied General Equilibrium).
MIRAGE décrit les imperfections de la concurrence dans un cadre oligopolistique à la Cournot. Il tient compte de la différenciation horizontale des produits liée aux variétés, mais aussi à l'origine géographique des biens (par emboîtement de fonctions de type Armington et Dixit-Stiglitz). Une procédure nouvelle de calibrage des paramètres correspondants permet une utilisation efficace de l’information disponible en ces domaines. La modélisation est faite dans un cadre dynamique séquentiel, où le nombre de firmes par secteur s’ajuste progressivement, et où le capital installé est supposé immobile, même entre secteurs. La réallocation du capital s’opère donc uniquement par l’effet combiné de la dépréciation et de l’investissement. Elle est inertielle, et permet de décrire les délais d’ajustement du stock de capital et les coûts associés.
Afin de mieux décrire les principaux canaux de transmission des chocs de politique commerciale, MIRAGE possède en outre trois caractéristiques distinctives importantes par rapport aux précédents modèles :
• les IDE sont décrits explicitement, avec une modélisation qui concilie la cohérence théorique (avec les comportements des agents et avec la détermination de l’investissement intérieur) et la cohérence avec les résultats des études empiriques sur les déterminants des IDE et les ordres de grandeur correspondants ;
• un élément de différenciation verticale des produits est introduit, en distinguant deux gammes de qualités, selon l'origine géographique du produit ;
• les barrières aux échanges sont décrites par la base de données MAcMaps (voir Bouët, Fontagné, Mimouni et Pichot, 2002), qui mesure l’équivalent tarifaire des droits ad valorem, des droits spécifiques, des quotas tarifaires, des prohibitions et des droits antidumping, au niveau bilatéral pour 137 pays et 220 partenaires en tenant compte de façon quasi-exhaustive des accords préférentiels existants. Cette information, disponible
au niveau de 5 000 à 10 000 produits (nomenclature SH6 à SH10, selon les pays), est utilisée comme source de données pour décrire le niveau initial des barrières aux échanges, mais également pour construire des scénarios. Les hypothèses d’évolution peuvent ainsi être formulées au niveau des produits, éventuellement en fonction de leur niveau initial de protection. Ensuite seulement, ces données sont agrégées dans la nomenclature du modèle, selon une procédure limitant le biais d’endogénéité. MIRAGE s’appuie donc sur une description des barrières aux échanges qui, outre sa précision, préserve le caractère bilatéral de l’information, contrairement à ce qui est fait dans la plupart des travaux de modélisation.
Excepté pour les barrières aux échanges, le modèle utilise la base de données GTAP 5 (Dimaranan et Mac Dougall, 2002). Cela lui confère une grande flexibilité dans le choix de l'agrégation sectorielle et géographique, qui peut être modifiée pour chaque application. Dans le but d’illustrer la portée des choix retenus, des simulations sont effectuées pour évaluer l’impact d’une suppression des barrières aux échanges entre l’UE et sa périphérie, définie au sens large comme regroupant les pays d'Europe Centrale et Orientale (PECO), les pays du Maghreb et la Turquie. Les résultats obtenus en utilisant la version standard de MIRAGE montrent que la création de commerce serait importante entre les deux zones, en particulier dans l'agriculture et l'agroalimentaire, dans les exportations européennes de véhicules et dans les exportations de textile-habillement de la périphérie. Cependant, l'impact de moyen terme (13 ans) sur le bien-être serait très légèrement négatif pour la périphérie: la nature asymétrique du scénario envisagé (liée au niveau initial plus élevé des barrières bilatérales imposées par la périphérie) induirait à terme une détérioration des termes de l'échange pour la périphérie et, surtout, la suppression des seules barrières envers l'UE confèrerait à la périphérie une structure de protection très inefficace, l'empêchant de tirer bénéfice d'une telle libéralisation. En revanche, l'impact sur le bien-être serait légèrement positif pour l'UE.
Ces résultats sont ensuite comparés à ceux obtenus en effectuant des hypothèses différentes dans quatre domaines clés: la différenciation verticale des produits, la nature de la concurrence, la structure dynamique et les IDE. Les différences s'avèrent significatives, illustrant notamment la part que prennent l'effet pro-concurrentiel et les IDE dans l'impact induit sur le bien-être. La différenciation verticale des produits compte aussi, et elle est particulièrement importante dans la détermination des impacts commerciaux. Enfin, une simulation montre que l'introduction d'une externalité technologique liée à l'IDE a un effet démesurément fort sur le bien-être. Ce constat valide la démarche prudente adoptée dans MIRAGE, qui consiste à n'introduire aucune externalité dans la version de base, pour garantir sa robustesse.
M
IRAGE,
AC
OMPUTABLEG
ENERALE
QUILIBRIUMM
ODELFOR
T
RADEP
OLICYA
NALYSISMohamed Hedi BCHIR, YvanDECREUX, Jean-LouisGUERIN andSébastienJEAN
1
1.
I
NTRODUCTIONAlmost ten years after Marrakech's agreements, and as Doha's Ministerial Conference launched a new round of multilateral negotiations, the stakes of trade policies are still very complex. Numerous new preferential agreements are in project, while the perspectives of multilateral liberalisation remain unclear. In this context, delivering a rigorous and detail quantitative analysis of a large scope of trade agreements is most useful, for policy-makers as well as for the public debate. This is the reason why the CEPII has decided to develop and to maintain, in collaboration with the ITC (International Trade Centre, UNCTAD-WTO, Geneva), a multi-sector, multi-region computable general equilibrium (CGE) model, nicknamed MIRAGE,2 devoted to trade policy analysis.
Trade agreements can involve substantial changes in prices, in allocated resources and in income, that are frequently strongly contrasted across sectors and countries. Based on a robust and widely accepted modelling of agents’ behaviour, CGE models are able to provide a detailed description of the impact of such shocks on the economy. A number of robust and well-identified mechanisms are quantified in a single, rigorous and consistent framework. Such an analysis makes it possible to put forward the main mechanisms, to give their sign and their order of magnitude.
During the last two decades, an extensive literature has been devoted to applying CGE modelling to the study of trade policies (see CEPII, 2000, for a survey). Compared to the pure walrasian tradition models,3 several major improvements have been achieved, in particular thanks to the studies about the expected impact of the European Single Market, the NAFTA, or the Uruguay Round. Since Harris (1984), imperfect competition and horizontal product differentiation are commonly incorporated, notably based on the formalisations proposed by Smith and Venables (1988), and by Harrison, Rutherford and
1
T he authors are economists with CEPII ([email protected], [email protected], [email protected], [email protected]). MIRAGE is part of a wider project devoted by the CEPII, in collaboration with the ITC (International Trade Centre, UNCTAD-WTO), to the analysis of trade policies. The authors gratefully aknowledge help from other members of this team, especially Antoine Bouët, Lionel Fontagné, Michel Fouquin, and Mondher Mimouni. The authors also wish to thank for their comments and advice the members of this project's "Comité de pilotage". The paper has also benefited from the comments made by participants in several conferences where the model was presented. Usual disclaimers apply.
2
MIRAGE stands for Modelling International Relationships in Applied General Equilibrium . 3
Such as, for instance, the one used by the World Bank for a global and prospective analysis of development issues, more than twenty years ago (World Bank, 1981).
Tarr (1997). Numerous studies have also gone beyond the static framework, in order to be able to describe adjustment periods, and the corresponding dynamic effects, notably after Baldwin (1989). Lastly, the nineties witnessed the increasing spreading of the GTAP database (Global Trade Analysis Project, Purdue University), that marked the sharing of the heavy data work required for this kind of models, making their access far easier.
The MIRAGE model builds on this literature, and intends to take a new step toward a better analysis of trade policies. It describes imperfect competition and horizontal product differentiation in a rather standard fashion, but with a new calibration procedure, allowing the available information to be used more efficiently. The modelling is done in a sequential dynamic set-up, where the number of firms by sector adjusts progressively, and where installed capital is assumed to be immobile, even across sectors. Capital reallocation therefore only results from the combined effect of depreciation and investment. It makes it possible to describe the adjustment lags of capital stock, and the associated costs. The model uses GTAP 5 database (see Dimaranan and Mac Dougall, 2002). In order to improve the description of trade policies' main transmission channels, MIRAGE has in addition three main distinctive features:
• FDIs are explicitly described, with a modelling both theoretically consistent (with agents' behaviour, and with domestic investment setting), and consistent with the empirical results about FDIs' determinants and their order of magnitude;
• a notion of vertical product differentiation is introduced, by distinguishing two quality ranges. Even though it remains rudimentary, this assumption is a first step toward taking advantage, in applied modelling, of the empirical progresses achieved in this domain during the last decade;
• trade barriers are described by the MAcMaps database (see Bouët, Fontagné, Mimouni and Pichot, 2002), that provides with a measure of valorem tariffs, and of the ad-valorem equivalent of specific tariffs, tariff quotas, prohibitions and anti-dumping duties, at the bilateral level, for 137 countries with 220 partners. Preferential agreements are taken into account in a quasi-exhaustive way. This information, available at the level of 5 000 to 10 000 products (SH6 or SH10 classification, according to the country), is used to describe the initial level of trade barriers, but also to build scenarios. Assumptions concerning the changes in these barriers can thus be made at the product level, possibly depending on their initial level. Only then are these data aggregated in the model's nomenclature, according to a procedure designed to limit the extent of the endogeneity bias.4 As a result, MIRAGE is based on a description of trade barriers that, besides its precision, preserves the bilateral dimension of the information, contrarily to what is commonly done in applied modelling.
The model's set-up is described in the following Section. For the sake of illustration, simulations are then carried out to evaluate the impact of removing trade barriers between the EU and its periphery. The results using the standard version of MIRAGE are presented,
4
This procedure, described in Bouët et alii (2002), is based on weights computed at the level of reference groups of countries, not at the level of individual countries.
and compared to those obtained when using different assumptions in four key areas: vertical product differentiation, the nature of competition, the dynamic set-up, and FDIs.
2.
T
HEMIRAGE
MODELMIRAGE is a multiregional and multisectoral model, the regional and sectoral aggregation of which can be adapted to each application. This Section describes the structure of the model and focuses on a few key assumptions, namely those dealing with products quality ranges, imperfect competition, FDI, and dynamic aspects. The model's equations are displayed in Annex 4.
The demand side
Final consumption is modelled in each region through a representative agent,5 whose utility function is intratemporal. A fixed share of the regional income is allocated to savings,6 the rest is used to purchase final consumption goods. Below this first-tier Cobb-Douglas function, the preferences across sectors are represented by a LES-CES (Linear Expenditure System – Constant Elasticity of Substitution) function. Without excessive complexity, this allows the evolution of the demand structure of each region, as its income level changes, to be accounted for. With this kind of utility function, the elasticity of substitution is constant only among the sectoral consumptions over and above a minimum level.7
As far as consumption choices within each sector are concerned, a nesting of CES functions such as the one used in Harrison, Rutherford and Tarr (1997) allows the particular status of domestic goods, together with product differentiation according to geographical origin (the so-called Armington's assumption) and horizontal product differentiation between varieties to be taken into account.
Such a standard, nested Armington – Dixit-Stiglitz, subutility function does not account for vertical differentiation nor for specialisation across quality ranges, although their importance in trade has been widely illustrated by now (see e.g. Abd-El-Rahman, 1991; Fontagné and Freudenberg, 1997; Fontagné, Freudenberg and Péridy, 1997; Freudenberg, 1998; Greenaway and Torstensson, 2000). Even though it is not easy to model nor quantify, this is an important device as far as analysing the nature and intensity of competition is concerned. This is why a further CES nesting level is added to the subutility function, distinguishing between two quality ranges, defined on a geographical basis: goods
5
This assumption can be thrown out to study the impact of a decision on poverty (see for instance Hertel et
alii, 2001), but it requires detailed survey data, which are available only on a country by country basis.
6
This simplifying assumption doesn’t allow to consider the indirect impact of liberalisation on savings, through a variation of the return rate of capital, though it can significantly alter the impacts of opening in a dynamic framework (Baldwin 1992, Francois et alii 1995; this point is discussed below).
7
The minimum consumption is supposed to be one third of the initial consumption in developed countries, and two thirds in developing countries.
produced in a developing economy are assumed to belong to a different quality range than those produced in a developed economy (the demand nesting is displayed in Figure 1). The choice of substitution elasticities (the one between qualities is inferior to the Armington elasticity) implies that goods that do not belong to the same quality range are less substitutable than goods from the same quality range. This means for instance that, within a given sector, goods from a developing country compete more directly with goods from any other developing country, than with goods from any developed country. Even though it remains rudimentary, this formulation is a first step toward taking vertical differentiation into account in applied modelling.
Total demand is made up of final consumption, intermediate consumption and capital goods. Sectoral demand of these three compounds follows the same pattern as final consumption. The regional representative agent includes the government. He therefore both pays and earns taxes, and no public budget constraint has to be taken into account explicitly: this constraint is implicit to meeting the representative agent's budget constraint. Unless otherwise indicated (modelling a distorsive replacement tax does not raise any technical problem), this implicitly assumes that any decrease in tax revenues (for example as a consequence of a trade liberalisation) is compensated by a non-distorsive replacement tax. However, the magnitude of the tax revenue losses is an interesting information, to be displayed in the results.
Figure 1: Demand nesting for good i
Demand for good i produced in type u regions DEMi,su CESσARM CESσIMP Foreign good DEMi,s etr DEMi,sv CESσGEO Var 1 CESσV A R Var n Var Nr u1 Var 1 CESσV A R
Var n Var Nruj Var 1
CESσV A R Var n CESσIMP Var 1 CESσV A R Var n Var Nrv1 DEMi,sv1 Var 1 CESσV A R
Var n Var Nrvj Var 1
CESσV A R
Var n Var NrvR’
DEMi,svr DEMi,svR’
produced in region 1 dans la régiontype u
DEMi,su1 DEMi,sur DEMi,suR
Var 1 CESσV A R
Var n Var Nrloc
Local good DEMi,sloc
Demand of region s for good i DEMi,s
Var NruR
Demand for good i produced in type v regions
produced in region r type u produced in region R type u produced in region 1 type v produced in region r type v produced in region R’ type v Notes:
Type u regions are those who belong to the same quality range as the buyer; type v regions are the other ones. Substitution elasticities are linked by the following relationships:
(
1
)
2
1
GEOARM
−
=
σ
−
The supply side
Production makes use of five factors: capital, skilled labour, unskilled labour, land and natural resources. Factor endowments are assumed to be fully employed and their growth rates are exogenous (zero for Land and Natural Resources, based on UNO demographic forecast for Labour), except for capital: even though saving rates are exogenous, total incomes vary and the regional and sectoral allocation of savings depends on capital returns as will be explained later.
Installed capital and natural resources are sector-specific, so that their rates of return may vary across sectors and regions. The three remaining factors are perfectly mobile across sectors,8 but immobile across countries, with the only exception of the partial mobility of capital stock, through FDI.9
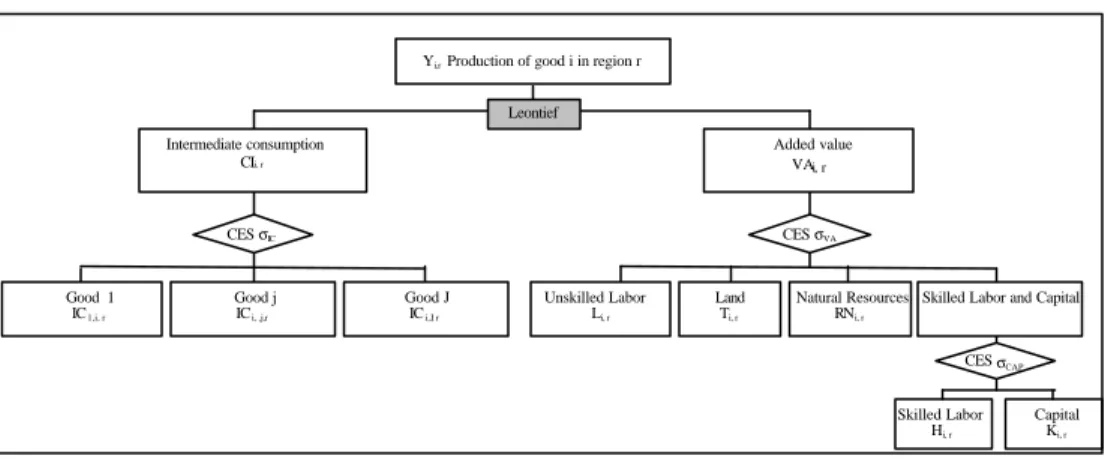
Figure 2: Structure of sector's i production function
Good 1 IC1,i, r Good j ICi, ,j,r Good J ICi,J, r Unskilled Labor Li, r Leontief Added value VAi, r Intermediate consumption intermédiairesCIi, r CES σVA Land Ti, r
Yi,r Production of good i in region r
Natural Resources RNi, r
Skilled Labor and Capital
Skilled Labor Hi, r CES σIC CES σCAP Capital Ki, r
The production function is described in Figure 2. In a standard fashion, perfect complementarity is assumed between value added and the intermediate consumptions. The sectoral composition of the intermediate consumption aggregate stems from a CES function, with the same elasticity as in the corresponding CES-LES for final consumption. For each sector of origin, the nesting is exactly the same as for final consumption, meaning that the sector bundle has the same structure for final and intermediate consumption.10
8
Factor market rigidity, particularly Labour market rigidity, can affect the impact of liberalisation processes (McKibbin, 1999).
9
These assumptions can be relaxed for some specific studies; for instance the use of Mirage to study the EU enlargement (Bchir et Maurel 2001) allows for migrations of the Labour force.
10
Based on the idea that firms collect information about products more easily than consumers, Mercenier (1992) assumes that substitution elasticities are higher within intermediate consumption than they are in final consumption. However the lack of empirical basis has led us not to adopt this assumption.
Value added is a CES function of land, natural resources, unskilled labour and a CES bundle of capital and skilled labour. This structure is intended to take into account the well-documented skill-capital relative complementarity. The elasticity of substitution within the capital and skilled labour bundle is assumed to be lower (0.6) than the elasticity between this bundle and all other factors (1.1).11
Some sectors, generally agriculture and transport12, are assumed to be perfectly competitive with constant returns to scale. However, the need to consider imperfect competition and economies of scale when assessing the consequences of trade liberalisation episodes has been widely documented (see for instance Norman, 1990).
Oligopolistic competition is thus assumed to hold in the other sectors, with horizontal differentiation of products and increasing returns to scale, in the line of Krugman's (1979) theoretical model and of Smith and Venables' (1988) applied partial equilibrium model. The specification in MIRAGE is very close to that used by Harrison, Rutherford and Tarr (1997). Each firm produces its own and unique variety. The marginal production cost is constant at given factor prices, and production involves each year a fixed cost, expressed as a fixed quantity of output. Within each sector of each region, firms are assumed to be symmetrical. They compete in a Cournot-Nash way, i.e. they suppose that their decisions of production do not affect the volume of production of their competitors. Moreover they rule out the possibility that their production decision may affect the global level of demand through a revenue effect (the so-called Ford effect). However, firms take into account their market power, that is the influence they may exert on the sectoral or infra-sectoral price index (given the above-defined demand structure).13 It follows from the absence of strategic interaction implied by the Cournot-Nash hypothesis, that the mark-up is given by the Lerner formula: irs ir irs irs EP MC P 1 1 1 − = = µ (1) 11
According to many studies (see Hamermesh, 1993, or Cahuc and Zylberberg, 1996 for extensive surveys), the elasticity of substitution between skilled labour or capital and unskilled labour is close to unity. However, using a CES function preserves the possibility for sensitivity analyses. Otherwise, the true value of substitution elasticities depends on the aggregation level (Decreux, Guérin and Jean, 2001). 12
The transport sector plays a specific role: it covers both regular transport activities, that are demanded and can be traded like any other service, and international transport of commodities. The latter is a Cobb-Douglas bundle of regional supplies, and it accounts for the difference between fob and cif values of traded goods. The same bundle is used for any route. It is employed in fixed proportions with the volume of each good shipped along each route.
13
This means that firms adopt pricing-to-market (see for example Goldberg and Knetter, 1997). They fix a different prices for each market. Pricing policy can depend on consumption destination (householders or firms), but it is not the case in MIRAGE.
Where
µ
irs is the mark-up applied in region s by each sector i's firm producing in region r, P is the corresponding price, MC is the marginal cost of production (which does not depend on the market). Time subscript t has been omitted for all variables, for greater convenience. EP is the price-elasticity of demand, as perceived by the firm based on the above-mentioned assumptions (see formula in Annex 4); it increases with the elasticity of substitution between good i varieties produced in country r (this elasticity is a higher bound for EP) and with the elasticity of substitution between good i baskets from region r and from other regions; it is a decreasing function of the number of firms in sector i of region r, and of the global market share of region r's producers taken together in the region s's market for good i. This endogenous determination of firms' mark-up (already present, in a generic form, in Krugman, 1979), allows the pro-competitive effect of commercial shocks to be accounted for.This formulation requires three types of parameters, describing respectively products substitutability, scale economies and competition intensity. Since these parameters are linked by the zero-profit condition in each sector, only two of them are usually drawn from external sources, and the third one is calibrated. This method is not fully satisfactory, either in terms of consistency or of robustness. This is why an original method is used in MIRAGE, that takes advantage of the whole available information for these three sets of parameters, not only about their value, but also concerning their variance. Once external estimates are collected for the three parameters, their calibrated values are jointly determined such as to minimise their distance from these estimates, subject to the consistency constraints imposed by the model. The inverted variance is used as a weight in calculating this distance, so as to make the adjustment borne more strongly by parameters which estimates have the greatest variance. A detailed description of this procedure is provided in Annex 3.
Changes in the number of firms are also an important matter: besides influencing firms’ size and therefore profit rates, they modify the number of available varieties, thus affecting consumers’ demand, given their taste for varieties. A binary approach is generally used in CGE model: in the short run, the number of firms is held constant and profits may vary; in the long-run, the free exit of firms brings profits back to zero. In MIRAGE, the entry-exit of firms tends to bring profits back to zero, but the adjustment is progressive.
In addition, two categories of imperfectly competitive sectors are distinguished, according to their market structure dynamics. This classification is based on Sutton's (1991) seminal work, that introduced the distinction between fragmented sectors, where sunk costs are exogenous, and segmented sectors, where sunk costs are endogenous. Schematically, growth is mainly realised through increases in the number of firms in fragmented industries, whereas firms’ size increases are dominant in segmented industries, where concentration cannot fall below a given level. Martins (1994) and Oliveira-Martins, Scarpetta and Pilat (1996), among others, have proved the usefulness of this taxonomy for sectoral empirical analysis, and it has already been used as a determinant of market structure dynamics in a CGE model by Cortes and Jean (1996, 1998) and by Jean and Bontout (1999).
This taxonomy is used in MIRAGE in the following way: at each period, the number of firms by sector is such that profits are 20% lower (in absolute value) in segmented sectors (50% lower in fragmented sectors), compared to the level they would have reached, had the number of firms remained unchanged14. This "law of motion" induces a progressive convergence of profits toward zero, with a higher speed for fragmented than for segmented sectors.
Capital, investment and macro-economic closure
Whatever its origin, a unit of capital invested in a given region is a bundle, obtained using the same CES nesting as for intermediate consumption. However, the distribution coefficients of the CES functions are different, according to the data. As for intermediate consumption, no factor service is required.
Installed capital is assumed to be immobile. This putty-clay hypothesis is important, because it implies that capital stock adjustment is gradual. The sectoral allocation of investment can thus be sub-optimal, and the corresponding loss can be interpreted as an adjustment cost for the economy. In addition, this putty-clay15 assumption implies that the rate of return to capital may vary across sectors.
This confers investment an important role, as the only adjustment device for capital stock. As soon as trade policies are concerned, investment is also important through its cross-border component, that is FDI. In many models, among which the GTAP one (see Hertel, 1997), international financial flows are the results of the assumptions of perfect capital mobility and of cross-country equalisation in the rate of return to capital (including risk premium). This modelling is micro-funded, but it induces unplausibly high cross-border capital flows. On the other hand, using directly the results of econometric estimates for parameterising an ad-hoc relationship would give more realistic results, but it would lack theoretical consistency.
This is why an original modelling of FDI is used here, aiming at combining empirical realism and theoretical consistency. The latter objective requires, in particular, that domestic investment's setting is consistent with FDI's one, and that savings allocation behaviour is rational. In this context, the rate of return to capital is a natural determinant of investment sharing across sectors and countries. It is noteworthy that this rate of return incorporates the influence of many FDI determinants identified in the empirical literature, (see for example Chakrabarti, 2001, for a recent survey) such as market size, growth rate or
14
This level is beforehand calculated in a separated simulation, where the number of domestic firms in each sector of each region is held unchanged. However, even in this case, FDIs can change the number of foreign firms.
15
market potential.16 As a consequence, these determinants need not be taken into account, over and above the sectoral rate of return to capital.
Practically, a single generic formalisation is used for setting both domestic and foreign investment. It stems from allocating savings across sectors and regions, as a function of the initial savings pattern, of the present capital stock and of the sectoral rate of return to capital, with an elasticity α:
∑
= s i wk is s irs wk is s irs r irs s is is e K PK A e K PK A S I PK , α α (2)Where PKs stands for the price of capital good in region s, Sr for country r savings, Iirs for
country r representative agent's investment in the sector i of country s, Kis for installed
capital stock, Airs for a calibrated parameter, wkis for the capital remuneration rate in sector i
of country s. Parameter á sets the adjustment speed of capital stock.17 The capital good used in a given region is the same, whatever the capital's origin.
Equivalently, for the sake of clarity, introducing an endogenous variable Br allows the
problem to be rewritten as follows:
∑
= = s i r irs s wk is s irs r irs S I PK e K PK A B I is , α (3) Br can therefore be written as:r R s i irs s is s irs r r e I PK K PK A S B −α
∑
= , (4)Where Rr can be interpreted as the shadow price of capital (including the depreciation rate)
in region r.
Two types of FDI are looked at. The first one corresponds to the purchase of foreign firms by investors (brownfield investment), whereas the second one is the building of new firms (Greenfield investment). Both have the same objective but their consequences regarding the short run dynamics of the model are not exactly the same: purchasing an existing firm has
16
Tariff jumping issues are left aside, because this mechanism cannot be modeled consistently without relying on a model of the multinational firm (see for instance Markusen and Venables, 2000).
17
Since α cannot be calibrated, two static models were built, corresponding to a short run and a long run version of Mirage. We applied the same shocks to both of them and chose α so that half the adjustment of capital stocks towards the long run would be made in around 4 years, for a variety of small commercial shocks. It gave the value α = 40.
no effect on the number of varieties, contrarily to creating a new firm. Based on long-term statistics on FDI, one third of total FDI is assumed to be greenfield.
Foreign owned firms are treated as domestic firms in all respects. The only difference is that the capital revenue goes back to the source country. By changing the number of firms, FDI may have an influence on productive efficiency. Nevertheless, it is worth emphasizing that FDI is not assumed to originate any technological spillover here. Although some empirical studies have shown that such spillovers may arise, they are not systematic nor robust enough to be taken into account in a model aimed at studying a large scope of trade policy shocks. However, for the sake of illustration, a simulation with technological spillover is presented below.
It is noteworthy, in addition, that product quality is assumed to depend only on the region of production. This contrasts for example with Petri (1997), who assumes that foreign affiliates produce the same quality as their parent company. In this framework, also adopted by Hanslow and alii (2000), and Lee and van der Mensbrugghe (2001), FDI liberalisation induces quality upgrading in developing countries, originating significant gains. Though interesting, this mechanism is not supported by robust enough empirical results.
Dynamic set-up
Adapting to a trade policy shock is neither immediate nor costless. Dynamics are thus useful, in order to be able to study the corresponding adjustment period, i.e. the short- and medium-run impacts. In addition, a number of effects are dynamic, in the sense that they are intrinsically linked to an accumulation or evolution process. Such effects are difficult to take into account in a static framework. They are mainly twofold: on the one hand, trade policy may modify the capital stock in the economy, through its impact on income or on the savings rate (see e.g. Baldwin, 1989); on the other hand, it may influence human capital and technology. Each of these two kinds of effects is likely to reach far higher orders of magnitude (for gains as well as for losses) than static effects, as evidenced for example by the results of Baldwin (1989, 1992) or of Francois, Mac Donald et Nordström (1995) concerning capital accumulation, and those of Baldwin and Forslid (1999) or of the World Bank (2001) as to introducing a technological externality linked to trade openness.
Now, empirical studies do not allow a definitive and robust conclusion to be reached about the existence of such growth effects (see e.g. Fontagné and Guérin, 1997, for a survey of this literature). In this context, a cautious approach is necessary, in order to prevent results from depending overwhelmingly on dubious (or at least not well-grounded) assumptions. This is why no technological externality linked to trade is introduced in MIRAGE, and why the savings rate is assumed to be constant over time in each region. Note, however, that capital accumulation is still influenced by income changes, that are proportionately transmitted to savings, and by the net balance of FDIs.
The model's dynamics is exclusively of a sequential nature: the equilibrium can be solved successively for each period. Time span can be freely chosen, usually around 15 to 20 years. Except for capital, the growth rate of production factors is set exogenously. The model does not consider any technical progress in the base case.
At each period, mobile factors adjust instantaneously (subject to the constraint of uniqueness of their unit cost in the economy), while capital stock only adjusts through investment. In imperfectly competitive sectors, the number of firms changes, according to the modalities described above. The model does not include any explicit adjustment cost. However, the sticky adjustment of capital stock and of the number of firms (i.e. of varieties) implies that the value of these sectoral variables is not necessarily optimal, and this may induce implicit adjustment costs.
3.
A
N ILLUSTRATION:
ASSESSING THE IMPACT OF A TRADE LIBERALISATIONBETWEEN THE
E
UROPEANU
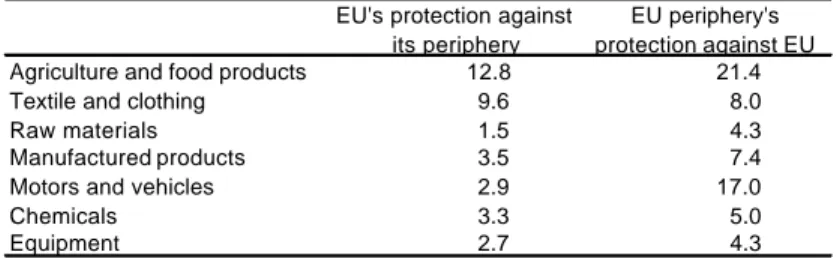
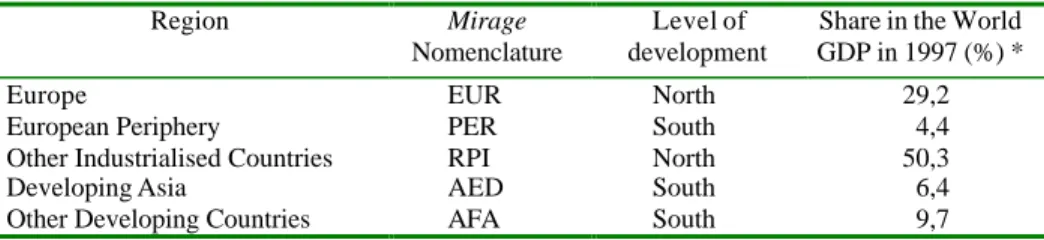
NION AND ITS PERIPHERYFor the sake of illustration, this section assesses the impact of a trade liberalisation scheme between the EU and its periphery (defined as Central and Eastern European Countries, Maghreb countries, Turkey). 5 regions and 11 sectors are considered (see details in Annex 2), and the consequences of the agreement are studied within a 13-year time span. The initial levels of sectoral trade barriers (tariff equivalent of ad valorem duties, specific duties, tariffs quotas, prohibitions and antidumping duties) between the EU and its periphery, as measured by the MAcMaps database, are given in Table 1. The simulations are based on the assumption that those barriers are totally removed in four equal yearly steps. Four year after the agreement, there is thus free trade between the two regions.
Table 1: Initial level of trade barriers by sector between the EU and its periphery (%)
EU's protection against its periphery
EU periphery's protection against EU Agriculture and food products 12.8 21.4 Textile and clothing 9.6 8.0 Raw materials 1.5 4.3 Manufactured products 3.5 7.4 Motors and vehicles 2.9 17.0 Chemicals 3.3 5.0 Equipment 2.7 4.3
Source: MAcMaps database.
A first simulation is carried out using the standard version of MIRAGE, to underline the main mechanisms at work, and evaluate the impacts of such a trade agreement. So as to ascertain the relevance and the importance of the main modelling assumptions of the model, a sensitivity analysis is then carried out with respect to four key assumptions: product differentiation by quality, imperfect competition, foreign direct investment and the dynamic structure of the model.
Results using MIRAGE
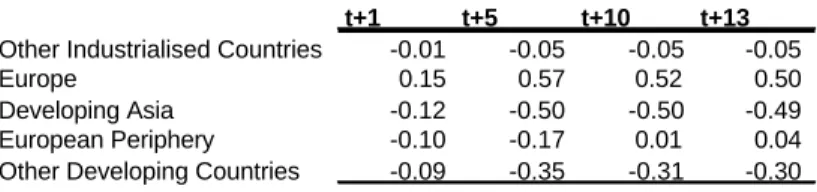
The main impact of the trade barriers removal is the increase in the bilateral trade flows between the two partners (15.7% in volume towards the EU, 16.3% towards the periphery). The preferential access the two regions grant each other exerts, ex-ante, an upward pressure on the external demand they face. Under the assumption of quasi-stability of the current balance account (FDI excluded), this entails a real exchange rate appreciation in the two areas towards third regions (see Table 2). As a consequence, exports of the European Union and of its periphery to all the other regions decrease.
The preferential access following from the agreement also constitutes a relative handicap for third regions' exports toward both contracting economies' markets. As a matter of fact, almost all these exports decrease in volume, despite the real exchange rates changes, meaning that the competition effect dominates the real exchange rate effect. The agreement thus entails strong diversion effects. The competition effect suffered by exporters from third regions in the European and Periphery's markets is nevertheless not uniform. Its magnitude depends on the sensitivity to the competition exerted by producers benefiting from a preferential access, which in turn depends on the similarity in sectoral specialisation, but also in quality ranges. So the preferential access to the EU market granted to the periphery's producers is more penalising for other developing regions than for other industrialised countries, as the former are more direct competitors to the periphery's countries: their products are in the same quality range and therefore more easily substitutable. In contrast, European imports from other industrialised countries increase. For the same reasons, periphery's imports from that region are the most adversely affected. It is noteworthy that trade diversion effects are much bigger on the periphery's market than on the EU's one, as the EU is in relative terms a more important supplier to the periphery than the periphery is to the EU.
Table 2: Variations of the Real Effective Exchange Rate (%)
t+1 t+5 t+10 t+13
Other Industrialised Countries -0.01 -0.05 -0.05 -0.05
Europe 0.15 0.57 0.52 0.50
Developing Asia -0.12 -0.50 -0.50 -0.49 European Periphery -0.10 -0.17 0.01 0.04 Other Developing Countries -0.09 -0.35 -0.31 -0.30 Source: authors calculations.
Note: the real effective exchange rate is the weighted average of the real exchange rates, weighted by trade flows. A positive variation means an appreciation.
At the sectoral level (see Table 3), the strongest effects are observed in the agricultural and agro-food sectors: bilateral trade flows in volume increase by 42% towards the periphery and by 37% to the EU 18 Generally speaking, the initial level of trade protection explains most of the sectoral pattern of bilateral trade changes; the increase of European vehicles exports to the periphery (+47%) is another example. However, the strong impact on the periphery's clothing exports to the EU comes not so much from the initial level of trade barriers (9.6%) than from the strong substitutability between products in that sector. The periphery's clothing exports to the EU provide with a good illustration of the dynamic process of factors re-allocation. Five years after the end of the liberalisation period (so nine years after the first liberalisation), those exports are 53% higher than in the absence of liberalisation. Ten years after, the gap has risen to 68%, on account of the adjustment in capital stocks and in the number of firms. A significant part of the adjustment process comes late and is spread over a long time.
The macroeconomic impacts are of a low order of magnitude (see Table 3), because the initial protection levels between the EU and its periphery are low, and because the volume of trade flows is still moderate compared to the size of the regions, especially for the EU. The agreement entails some gains for the EU (with a rise in welfare of 0.09%), but also some losses for the periphery (where welfare does decrease by 0.01%).19 Actually, as the EU is the main trading partner of the periphery, the bilateral liberalisation gives the latter a very inefficient protection structure, as that region grants strong preferential access to a large part of its imports. Such a protection structure creates negative distortions as it often leads to choosing the most favoured supplier, instead of the most efficient one. In that case, the consumer's gain is more than offset by the drop in tariff revenues collected by the government. Such a problem appears as soon as a liberalisation agreement increases the discrimination induced by protection, but it is of special importance for the periphery, given the EU's weight in its external trade, as witnessed by the sharp drop in tariff revenues (-1.2 GDP percentage points), but also by the importance of trade diversion effects.
18
Unless otherwise indicated, the numbers given and discussed are the variations observed at the end of the time scope, that is 13 years after the agreement.
19
At the same time, the real GDP of the periphery increases by 0.08%. The difference between real GDP and welfare changes stems from FDI. Profits of foreign firms operating in the periphery are taken into account when measuring the GDP. But as they are sent back to capital owners, they do not contribute to the region's welfare.
Table 3: Impact of a free trade agreement between the EU and its periphery, estimated with the standard version of MIRAGE (main results, in %)
Macroeconomic variables EU EU periphery t+1 t+5 t+10 t+13 t+1 t+5 t+10 t+13 Welfare 0.02 0.06 0.08 0.09 -0.00 -0.11 -0.04 -0.01 GDP (volume) 0.02 0.08 0.10 0.10 -0.01 -0.07 0.04 0.08 Terms of trade 0.12 0.51 0.48 0.47 -0.08 -0.21 -0.11 -0.09 Real effective exchange rate 0.14 0.57 0.52 0.50 -0.10 -0.17 0.01 0.04 Unskilled real wages 0.05 0.20 0.21 0.22 0.31 1.44 1.54 1.56 Skilled real wages 0.03 0.14 0.18 0.20 0.23 0.98 1.04 1.08 Real return to capital 0.04 0.13 0.10 0.08 0.29 1.26 1.17 1.12 Real return to natural resources 0.03 0.16 0.20 0.21 0.36 1.26 1.12 1.13 Real return to land 0.19 0.79 0.75 0.75 0.10 0.54 0.67 0.71 Exports (volume) 0.48 2.24 2.31 2.30 1.92 9.11 9.55 9.64 Imports (volume) 0.52 2.30 2.24 2.20 1.71 8.12 8.34 8.36 Inward FDI (volume) 0.22 0.92 0.69 0.58 1.03 5.45 5.15 4.93 Outward FDI (volume *) -0.21 -0.61 -0.24 -0.08 -0.99 -4.27 -3.85 -3.66 Tariff revenue (points of GDP) -0.02 -0.08 -0.08 -0.08 -0.28 -1.28 -1.25 -1.24
Bilateral external trade, for the whole economy (CIF value)
EU EU periphery Initial level t+1 t+5 t+10 t+13 Initial level t+1 t+5 t+10 t+13 Exports to:
Other Industrialised Countries 50.73 -0.20 -0.83 -0.79 -0.77 5.62 -0.12 -0.48 -0.46 -0.43
Europe 17.74 3.04 14.58 15.43 15.67
Developing Asia 11.91 -0.36 -1.61 -1.62 -1.59 1.67 -0.23 -1.64 -2.06 -2.08 European Periphery 20.69 3.38 15.67 16.20 16.32
Other Developing Countries 20.29 -0.29 -1.14 -1.05 -1.03 2.41 -0.15 -0.74 -0.79 -0.79
EU EU periphery Initial level t+1 t+5 t+10 t+13 Initial level t+1 t+5 t+10 t+13 Imports from:
Other Industrialised Countries 48.92 0.23 0.94 0.89 0.87 6.37 -2.47 -9.42 -9.11 -9.06
Europe 20.69 3.38 15.67 16.20 16.32
Developing Asia 14.34 -0.61 -3.12 -3.38 -3.35 1.74 -0.13 -1.60 -2.42 -2.62 European Periphery 17.74 3.04 14.58 15.43 15.67
Bilateral external trade, by sector (volume) EU -> EU periphery EU periphery -> EU Initial level t+1 t+5 t+10 t+13 Initial level t+1 t+5 t+10 t+13
Agriculture and food products 1.860 8.43 41.75 42.63 42.80 0.942 8.34 38.39 37.50 37.38 Textile and clothing 1.831 5.31 22.54 21.47 21.25 2.555 9.00 53.74 65.26 68.31 Raw materials 0.939 2.48 10.53 10.93 11.09 4.754 1.06 4.10 3.74 3.66 Manufactured products 1.764 3.18 14.02 14.47 14.58 1.634 2.92 11.69 11.14 11.12 Motors and vehicles 1.951 9.21 44.99 47.27 47.49 0.796 4.62 15.95 12.85 12.89 Chemicals 3.686 1.87 8.23 8.71 8.83 2.048 2.43 9.70 9.33 9.33 Equipment 6.068 1.53 6.54 6.93 7.06 1.812 2.47 9.52 8.64 8.50 Houses 0.173 -0.33 -0.88 -0.48 -0.41 0.220 0.24 0.43 -0.02 -0.08 Transports 0.752 0.06 0.56 0.93 1.01 1.450 0.14 -0.09 -0.57 -0.62 Electricity, gas and water 0.138 0.12 0.95 1.41 1.50 0.151 0.24 0.11 -0.38 -0.41 Other services 1.532 0.02 0.45 0.86 0.94 1.383 0.13 -0.33 -0.90 -0.96
Production by sector (volume)
EU EU periphery
Initial
level t+1 t+5 t+10 t+13
Initial
level t+1 t+5 t+10 t+13
Agriculture and food products 121.60 0.08 0.53 0.59 0.59 33.44 -0.12 -0.62 -0.63 -0.61 Textile and clothing 30.00 -0.03 -0.42 -0.77 -0.83 10.91 1.57 13.16 18.04 19.08 Raw materials 42.22 -0.05 -0.31 -0.28 -0.25 24.97 0.04 0.07 -0.05 -0.06 Manufactured products 88.31 0.01 0.06 0.09 0.10 14.24 -0.02 -0.24 -0.37 -0.38 Motors and vehicles 60.15 0.21 1.49 1.68 1.62 6.00 -0.63 -5.01 -6.38 -6.39 Chemicals 121.50 0.00 0.02 0.06 0.07 21.06 -0.02 -0.13 -0.15 -0.12 Equipment 112.60 -0.01 -0.09 -0.07 -0.05 11.88 0.04 -0.25 -0.73 -0.84 Houses 140.30 0.01 0.04 0.04 0.04 21.58 -0.01 -0.06 -0.05 -0.04 Transports 238.00 -0.01 -0.06 -0.05 -0.04 38.91 -0.05 -0.35 -0.40 -0.39 Electricity, gas and water 23.65 -0.01 -0.05 -0.02 -0.01 11.39 -0.05 -0.37 -0.37 -0.35 Other services 520.70 -0.02 -0.08 -0.07 -0.06 52.89 -0.07 -0.48 -0.52 -0.52
Source: authors calculations.
Note: Impacts are measured as changes with respect to the base run, where trade policy is held unchanged. All changes are expressed in %, except tariff revenues, in GDP percentage points. For changes in value (bilateral trade), the numéraire is the average price index of world production. The initial levels are in tens of billions of 1997 US dollars.
Sensitivity to the assumption of a lower substitutability between quality
ranges
So as to take into account quality ranges considerations, consumers preferences are modelled in MIRAGE by assuming that products coming from developed countries are more substitutable to each other than to products coming from developing economies. This assumption does constitute an innovation in CGE models and can have quite a strong impact on results, as substitution elasticities appearing in the utility function are amongst the most sensitive parameters when assessing the impacts of trade policies. In order to make clear what its influence is, alternative simulations are run doing away with this assumption.20
20
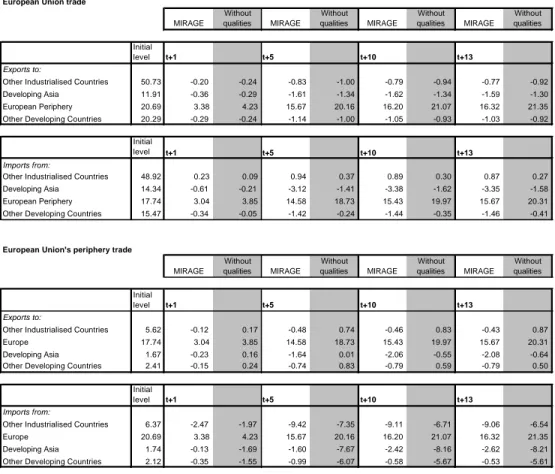
Table 4: Impact of the agreement on trade flows, with and without the assumption of a lower substitutability between quality ranges (%)
European Union trade
MIRAGE Without qualities MIRAGE Without qualities MIRAGE Without qualities MIRAGE Without qualities Initial level t+1 t+5 t+10 t+13 Exports to:
Other Industrialised Countries 50.73 -0.20 -0.24 -0.83 -1.00 -0.79 -0.94 -0.77 -0.92 Developing Asia 11.91 -0.36 -0.29 -1.61 -1.34 -1.62 -1.34 -1.59 -1.30 European Periphery 20.69 3.38 4.23 15.67 20.16 16.20 21.07 16.32 21.35 Other Developing Countries 20.29 -0.29 -0.24 -1.14 -1.00 -1.05 -0.93 -1.03 -0.92
Initial
level t+1 t+5 t+10 t+13
Imports from:
Other Industrialised Countries 48.92 0.23 0.09 0.94 0.37 0.89 0.30 0.87 0.27 Developing Asia 14.34 -0.61 -0.21 -3.12 -1.41 -3.38 -1.62 -3.35 -1.58 European Periphery 17.74 3.04 3.85 14.58 18.73 15.43 19.97 15.67 20.31 Other Developing Countries 15.47 -0.34 -0.05 -1.42 -0.24 -1.44 -0.35 -1.46 -0.41
European Union's periphery trade
MIRAGE Without qualities MIRAGE Without qualities MIRAGE Without qualities MIRAGE Without qualities Initial level t+1 t+5 t+10 t+13 Exports to:
Other Industrialised Countries 5.62 -0.12 0.17 -0.48 0.74 -0.46 0.83 -0.43 0.87 Europe 17.74 3.04 3.85 14.58 18.73 15.43 19.97 15.67 20.31 Developing Asia 1.67 -0.23 0.16 -1.64 0.01 -2.06 -0.55 -2.08 -0.64 Other Developing Countries 2.41 -0.15 0.24 -0.74 0.83 -0.79 0.59 -0.79 0.50
Initial
level t+1 t+5 t+10 t+13
Imports from:
Other Industrialised Countries 6.37 -2.47 -1.97 -9.42 -7.35 -9.11 -6.71 -9.06 -6.54 Europe 20.69 3.38 4.23 15.67 20.16 16.20 21.07 16.32 21.35 Developing Asia 1.74 -0.13 -1.69 -1.60 -7.67 -2.42 -8.16 -2.62 -8.21 Other Developing Countries 2.12 -0.35 -1.55 -0.99 -6.07 -0.58 -5.67 -0.53 -5.61
Source: authors calculations.
Note: Impacts are measured as changes with respect to the base run, where trade policy is held unchanged. All changes are in %. For changes in value (bilateral trade), the numéraire is the average price index of world production. The initial levels are in tens of billions of 1997 US dollars.
The most striking differences concern the two partners' trade patterns changes. As mentioned above, the impact of such a bilateral liberalisation can be split between a real exchange rate effect and a competition effect. The latter effect, favouring the contracting regions in their partner's market relatively to third regions, is significantly affected by the assumption of quality differentiation, that implies a higher degree of competition inside than across quality ranges. Without this assumption, the competition effect becomes much less geographically discriminatory, even though some differences persist, due to the different sectoral specialisation. Instead of being fully concentrated on the periphery's imports from the other industrialised countries, the ousting process now hits all non contracting regions. Given the specific specialisation of the other industrialised countries, their exports to the EU still increase, but not as much as before. Lifting out the quality
differentiation assumption also entails stronger growth of bilateral trade flows between the two partners, because the substitutability between the goods they produce is then assumed to be higher than in the standard version.
At the macroeconomic level, the sensitivity of the quality differentiation assumption is lower. The welfare gains in the EU are unchanged. For the periphery, the loss in welfare does increase significantly under the alternative model (-0.15% versus -0.01% in the standard version): the higher discrimination resulting from the liberalisation has indeed stronger21 impacts on trade under the alternative specification, thus increasing the corresponding drawbacks.
Sensitivity to imperfect competition
Since Krugman (1979) and Markusen (1981), the impact of trade policies under imperfect competition has been widely studied. So as to measure the importance of this assumption, results of the standard MIRAGE model are compared to those obtained when assuming that all sectors are perfectly competitive and have constant-returns-to-scale production functions. For the EU, macroeconomic impacts are unchanged, which can easily be explained by the fact that in a great region like the EU, the degree of competition is mainly defined by the rivalry between firms within the region, and should not be affected by a free-trade agreement with a small external region. Things are different for the periphery, where the internal market is smaller, and which liberalises trade with its main trading partner. For this region, the welfare loss reaches 0.28% under perfect competition. In other words, taking imperfect competition into account gives a less severe reading of the consequences for the periphery of the agreement.
Part of the differences stem from the pro-competitive effect of the agreement. Trade generally increases competition and diminishes firms' mark-ups. As MIRAGE takes into account the possibility for firms to set a market-specific price ("pricing to market"), this effect varies across markets (see Table 5). The increased market shares in the EU enables the periphery's firms to increase their mark-up rates. In contrast, their mark-up is reduced on their own markets, due to increased competition from EU firms, and this is a source of welfare gain for the region. When this results in a lower average mark-up for the region's firms (as is usually the case), it also entails, in the middle run, an increase in firms size, and therefore lowers production costs.
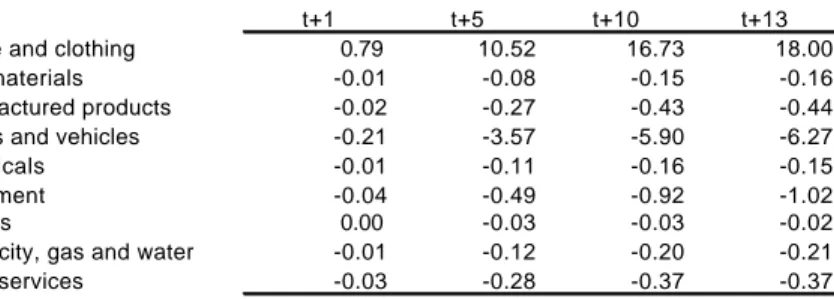
Nevertheless, the main impact of imperfect competition deals with the number of varieties produced22 in each region. The agreement entails a rise in the production of several sectors (mostly those where the periphery has a comparative advantage towards the EU), resulting in an increase in each variety's output, but also in the number of varieties produced (see Table 6). When the initial number of varieties is quite high, each variety's output hardly
21
Impacts are less contrasted across third regions, but bilateral trade creation is higher and trade diversion effects become stronger.
22
changes, and the bulk of the increase stems from the number of varieties. This is exemplified by the textile and clothing sectors, where the number of varieties increases by 18%. As consumers exhibit taste for variety, this increase in the number of varieties produced increases the periphery's markets share in the EU, but also in other markets.
Table 5: Impact on the European periphery’s firms’ mark-ups, by market (%)
European Union
European Periphery
Other Industrialised
Countries Developing Asia
Other Developing
Countries Textile and clothing 0.017 -0.088 -0.003 -0.004 -0.003 Raw materials 0.026 -0.006 -0.003 -0.003 -0.004 Manufactured products 0.006 -0.003 0.000 0.000 0.000 Motors and vehicles 0.089 0.047 0.017 0.023 0.018 Chemicals 0.009 -0.007 0.000 0.000 0.000 Equipment 0.026 0.002 0.004 0.004 0.003 Houses -0.002 0.001 -0.002 0.000 -0.001 Electricity, gas and water -0.008 0.038 -0.010 -0.001 0.001 Other services -0.004 0.047 -0.003 0.000 0.000
Source: authors calculations.
Table 6: Impact on the number of varieties produced in the European periphery (%)
t+1 t+5 t+10 t+13 Textile and clothing 0.79 10.52 16.73 18.00 Raw materials -0.01 -0.08 -0.15 -0.16 Manufactured products -0.02 -0.27 -0.43 -0.44 Motors and vehicles -0.21 -3.57 -5.90 -6.27 Chemicals -0.01 -0.11 -0.16 -0.15 Equipment -0.04 -0.49 -0.92 -1.02 Houses 0.00 -0.03 -0.03 -0.02 Electricity, gas and water -0.01 -0.12 -0.20 -0.21 Other services -0.03 -0.28 -0.37 -0.37
Source: authors calculations.
So as to better isolate the effects directly linked to the evolution in the number of varieties produced, another simulation was run keeping unchanged the number of firms by sector (see Table 7). An output increase is then only met by an increase in the production of each individual variety, inducing new economies of scale. The involved increased profits give incentives to invest in that sector, whose capital stock then increases. The marginal cost and the selling price decrease, strengthening the exports increase. This phenomena is important enough to offset partly the terms of trade decline observed under perfect competition. The real effective exchange rate even slightly appreciates. That said, the welfare loss remains significantly higher (0.12%) than under the standard version of MIRAGE, illustrating the importance of the gains linked to the increase in the number of varieties.
EU MIRAGE Without qualities PC Without FDI K Mobile Fixed nb of firms Ext'ty FDI MIRAGE Without qualities PC Without FDI K Mobile Fixed nb of firms Ext'ty FDI MIRAGE Without qualities PC Without FDI K Mobile Fixed nb of firms Ext'ty FDI t+1 t+5 t+13 Welfare 0.016 0.015 0.019 0.016 0.015 0.015 0.016 0.061 0.057 0.078 0.066 0.063 0.054 0.103 0.087 0.086 0.094 0.084 0.086 0.077 0.248 GDP (volume) 0.019 0.019 0.022 0.017 0.017 0.018 0.019 0.077 0.078 0.095 0.068 0.076 0.070 0.124 0.104 0.111 0.112 0.085 0.101 0.096 0.286 Terms of trade 0.125 0.119 0.142 0.119 0.126 0.126 0.127 0.512 0.487 0.610 0.510 0.510 0.525 0.552 0.473 0.446 0.583 0.502 0.478 0.483 0.453 Real effective exchange rate 0.145 0.142 0.163 0.139 0.126 0.147 0.148 0.570 0.560 0.683 0.573 0.510 0.583 0.599 0.500 0.476 0.637 0.535 0.478 0.495 0.456 Unskilled real wages 0.047 0.047 0.052 0.046 0.043 0.049 0.047 0.196 0.195 0.225 0.187 0.202 0.203 0.236 0.223 0.227 0.237 0.204 0.223 0.216 0.398 Skilled real wages 0.031 0.030 0.033 0.030 0.030 0.033 0.031 0.144 0.146 0.158 0.132 0.150 0.163 0.188 0.199 0.223 0.199 0.162 0.195 0.209 0.421 Real return to capital 0.038 0.037 0.040 0.035 0.036 0.039 0.038 0.133 0.131 0.154 0.140 0.137 0.150 0.165 0.084 0.073 0.108 0.115 0.092 0.099 0.108 Real return to natural resources 0.032 0.013 0.038 0.035 0.027 0.040 0.031 0.163 0.092 0.192 0.159 0.183 0.258 0.184 0.215 0.194 0.211 0.179 0.216 0.335 0.432 Real return to land 0.192 0.208 0.191 0.195 0.155 0.192 0.192 0.790 0.940 0.788 0.812 0.749 0.782 0.845 0.745 0.929 0.732 0.760 0.745 0.719 0.931 Exports (volume) 0.475 0.647 0.460 0.483 0.495 0.474 0.471 2.245 3.164 2.109 2.198 2.301 2.211 2.274 2.298 3.381 2.118 2.188 2.288 2.265 2.467 Imports (volume) 0.522 0.710 0.493 0.510 0.538 0.519 0.527 2.304 3.254 2.124 2.306 2.348 2.271 2.446 2.198 3.258 2.043 2.265 2.207 2.161 2.278 Tariff revenue (points of GDP) -0.017 -0.016 -0.017 -0.017 -0.017 -0.017 -0.017 -0.083 -0.083 -0.080 -0.084 -0.085 -0.083 -0.083 -0.081 -0.083 -0.080 -0.081 -0.081 -0.081 -0.075
Part B: Periphery of the European Union
EU's periphery MIRAGE Without qualities PC Without FDI K Mobile Fixed nb of firms Ext'ty FDI MIRAGE Without qualities PC Without FDI K Mobile Fixed nb of firms Ext'ty FDI MIRAGE Without qualities PC Without FDI K Mobile Fixed nb of firms Ext'ty FDI t+1 t+5 t+13 Welfare -0.005 -0.013 -0.015 -0.011 0.016 -0.008 -0.006 -0.110 -0.174 -0.268 -0.138 -0.079 -0.155 0.264 -0.012 -0.146 -0.279 -0.078 -0.028 -0.117 0.952 GDP (volume) -0.013 -0.025 -0.021 -0.022 0.006 -0.016 -0.014 -0.074 -0.150 -0.200 -0.149 -0.039 -0.110 0.214 0.076 -0.056 -0.144 -0.099 0.068 -0.020 0.893 Terms of trade -0.080 -0.175 -0.131 -0.096 -0.033 -0.091 -0.084 -0.214 -0.621 -0.679 -0.317 -0.087 -0.338 -0.148 -0.092 -0.496 -0.742 -0.181 -0.088 -0.265 0.137 Real effective exchange rate -0.101 -0.207 -0.171 -0.120 -0.033 -0.115 -0.106 -0.174 -0.607 -0.780 -0.280 -0.087 -0.294 0.007 0.036 -0.332 -0.783 -0.048 -0.088 -0.090 0.388 Unskilled real wages 0.305 0.267 0.282 0.298 0.330 0.299 0.300 1.445 1.331 1.233 1.388 1.493 1.371 1.696 1.562 1.410 1.267 1.404 1.550 1.451 2.290 Skilled real wages 0.225 0.228 0.202 0.221 0.210 0.235 0.222 0.976 0.964 0.856 0.908 0.924 1.092 1.178 1.079 0.889 0.946 0.839 1.047 1.212 1.799 Real return to capital 0.290 0.274 0.277 0.282 0.307 0.289 0.286 1.255 1.271 1.132 1.279 1.278 1.245 1.443 1.125 1.259 0.984 1.288 1.134 1.166 1.422 Real return to natural resources 0.365 0.473 0.405 0.387 0.218 0.380 0.367 1.262 1.726 1.748 1.328 0.929 1.404 1.086 1.127 1.350 1.779 1.051 1.078 1.321 1.067 Real return to land 0.098 -0.111 0.108 0.098 0.133 0.096 0.091 0.543 -0.446 0.575 0.512 0.602 0.522 0.709 0.714 -0.381 0.671 0.606 0.713 0.649 1.340 Exports (volume) 1.916 2.549 1.701 1.955 2.038 1.901 1.917 9.115 12.259 7.842 9.245 9.488 8.949 9.397 9.645 13.027 8.033 9.544 9.678 9.459 10.440 Imports (volume) 1.710 2.205 1.536 1.665 1.838 1.698 1.705 8.123 10.776 6.964 7.876 8.442 8.016 8.496 8.359 11.357 6.921 8.134 8.376 8.211 9.123 Tariff revenue (points of GDP) -0.277 -0.267 -0.280 -0.278 -0.275 -0.277 -0.274 -1.280 -1.293 -1.311 -1.297 -1.280 -1.279 -1.211 -1.235 -1.245 -1.294 -1.255 -1.237 -1.231 -1.075
Source: authors calculations.
Note: column titles indicate which model specification was used, i.e. which modification was made to the standard version of MIRAGE. « Without qualities »: without the assumption of a lower substitutability between quality ranges; ‘PC’: perfect competition; ‘K mobile’: perfect mobility of capital between sectors; ‘Without FDI’: without taking FDI into account; ‘Fixed nb of firms’: fixed number of firms; ‘Ext'ty FDI’: under the assumption of a technological externality induced by FDI.