HAL Id: tel-01119730
https://pastel.archives-ouvertes.fr/tel-01119730v2
Submitted on 10 Mar 2015
HAL is a multi-disciplinary open access archive for the deposit and dissemination of sci-entific research documents, whether they are pub-lished or not. The documents may come from teaching and research institutions in France or abroad, or from public or private research centers.
L’archive ouverte pluridisciplinaire HAL, est destinée au dépôt et à la diffusion de documents scientifiques de niveau recherche, publiés ou non, émanant des établissements d’enseignement et de recherche français ou étrangers, des laboratoires publics ou privés.
Analyses
Tatiana Prosvirnova
To cite this version:
Tatiana Prosvirnova. AltaRica 3.0: a Model-Based approach for Safety Analyses. Computational Engineering, Finance, and Science [cs.CE]. Ecole Polytechnique, 2014. English. �tel-01119730v2�
Th`ese pr´esent´ee pour obtenir le grade de
DOCTEUR DE L’ECOLE POLYTECHNIQUE
Sp´ecialit´e : InformatiqueTatiana PROSVIRNOVA
AltaRica 3.0 :
une approche orient´
ee mod`
eles
pour
la Sˆ
uret´
e de Fonctionnement
AltaRica 3.0:
a Model-Based approach for
Safety Analyses
Soutenue publiquement le 21 Novembre 2014 `a l’Ecole Polytechnique devant le jury compos´e de :
Pr´esident du jury : Le¨ıla KLOUL Universit´e de Versailles St-Quentin-en-Yvelines
Rapporteurs : Mohamed KAANICHE Laas-CNRS, Toulouse
Olivier ROUX IRCCyN, Ecole Centrale de Nantes
Directeur de th`ese : Antoine RAUZY Ecole Polytechnique, Palaiseau
Examinateurs : Michel BATTEUX IRT SystemX, Palaiseau
Frank ORTMEIER Otto-von-Guericke University of Magdeburg
Tatiana PROSVIRNOVA
AltaRica 3.0 :
une approche orient´
ee mod`
eles
pour
la Sˆ
uret´
e de Fonctionnement
AltaRica 3.0:
a Model-Based approach for
Safety Analyses
2014
Laboratoire d’Informatique (LIX) Ecole Polytechnique
A mes parents et mon mari... Моим родителям и мужу посвящается...
Remerciements
2007 – D´ecouverte du langage AltaRica pendant le stage `a Thales Research & Technology. 2008 – Rencontre avec Antoine Rauzy, l’un des cr´eateurs du langage AltaRica.
2011 – D´ebut de la th`ese sous la direction d’Antoine Rauzy sur la nouvelle version du langage AltaRica. A l’issue de ma scolarit´e `a l’Ecole Polytechnique je n’avais pas forc´ement envie de poursuivre une th`ese. Mais j’ai eu l’opportunit´e de faire partie d’un projet de recherche innovant ayant de r´eelles applications industrielles. Je tiens `a remercier mon directeur de th`ese, Antoine Rauzy, pour cette exp´erience unique que j’ai v´ecue durant ces trois ann´ees. Un grand merci pour m’avoir permis de travailler dans un contexte scientifique de grande qualit´e, d’avoir cru en moi d’abord en m’embauchant chez Dassault Syst`emes et ensuite en m’offrant la possibilit´e de faire une th`ese `a l’Ecole Polytechnique. Je voudrais ´egalement remercier Le¨ıla Kloul avec qui j’ai collabor´e pendant ma th`ese. Tu m’as permis de d´ecouvrir de nouveaux domaines de recherche, ainsi que l’enseignement `a l’Universit´e de Versailles.
Un grand merci `a Jean-Marc Roussel pour sa p´edagogie. Tes conseils tr`es pertinents m’ont ´et´e tr`es utiles pour ma soutenance de th`ese.
Un grand merci aussi `a Michel Batteux. Ton aide pour ma soutenance de th`ese et pour mon manuscrit, ainsi que ton soutien tout au long de ces trois ann´ees, m’ont ´et´e tr`es pr´ecieux.
Je tiens ´egalement `a remercier mes rapporteurs Mohamed Kaˆaniche et Olivier Roux ainsi que tous les autres membres de mon jury Le¨ıla Kloul, Michel Batteux, Frank Ortmeier et Christel Seguin. Vous m’avez tous fait un grand honneur en acceptant d’ˆetre pr´esents `a ma soutenance et en prenant le temps de lire attentivement mon manuscrit. Vos questions et remarques m’ont ´et´e tr`es pr´ecieux pour am´eliorer mon travail et approfondir encore mes connaissances dans le domaine.
Ma reconnaissance va aussi `a tous les membres de l’´equipe AltaRica 3.0, que j’ai pu cˆotoyer depuis septembre 2011. Chacun d’entre vous a contribu´e `a sa mani`ere au r´esultat que vous voyez aujourd’hui. Merci `a nos doctorants Pierre-Antoine Brameret, Thomas Friedlhuber, Abraham Cherfi, Melissa Is-sad et Huixing Meng pour leur aide, leurs conseils et les moments que nous avons partag´es ensemble pendant les conf´erences, les s´eminaires et les petites fˆetes. Merci `a nos stagiaires Renaud Lancelot, Kseni¨ıa Isaeva, Hala Mortada et Nawaal Mamadou pour leur travail, leur bonne humeur et les mo-ments que j’ai partag´es avec eux.
Mais le labo ne se r´esume pas qu’au groupe AltaRica 3.0. Je tiens `a remercier aussi notre secr´etaire Evelyne Rayssac et notre informaticien James Regis sans qui le labo ne fonctionnerait pas aussi bien. A ce sujet, merci `a l’Ecole Doctorale (EDX) pour son soutien financier pendant ces trois ans `a travers l’allocation internationale de th`ese Gaspard Monge. Plus particuli`erement, merci `a Fabrice et Audrey pour leur disponibilit´e et leur ´ecoute.
Je souhaite enfin exprimer toute ma gratitude envers le professeur Frank Ortmeier et ses doctorants Michael Lipaczewski et Simon Struck qui m’ont accueilli et fait d´ecouvrir leur culture lors de mes deux s´ejours en Allemagne en 2012 et en 2013.
Je voudrais remercier mon maˆıtre de stage St´ephane Mallat qui m’a fait d´ecouvrir les domaines de l’ing´enierie dirig´ee par des mod`eles et de la sˆuret´e de fonctionnement.
Merci `a Marc Bouissou pour le partage de son expertise en sˆuret´e de fonctionnement.
Je voudrais ´egalement remercier tous mes anciens coll`egues de Dassault Syst`emes, en particulier
Benoˆıt Perrot pour m’avoir donn´e goˆut `a la programmation.
Je tiens `a remercier tous mes amis qui ont toujours ´et´e `a mes cˆot´es pour me soutenir. Merci `a Cyril et Alexandra qui ont commenc´e leurs th`eses en mˆeme temps que moi mais dans un domaine compl´etement diff´erent, pour tous les moments que nous avons v´ecus ensemble durant ces trois ann´ees. Merci `a Nicolas pour ses conseils et ses id´ees. Je remercie ´egalement mes amis de Master d’Ing´enierie des Syst`emes Industriels Complexes Marcel, Jujhar et Mounir. Un grand merci `a mes amis Sunanda et Juan qui ont soutenu leurs th`eses quelques mois avant moi. Merci `a Gaela, C´ecile et H´el`ene pour les moments que nous avons partag´es au badminton. Merci `a Erwana pour son soutien et son amiti´e d`es le d´ebut de mon arriv´ee en France. Merci `a Charlotte que je connais depuis tr`es longtemps et que j’ai retrouv´ee `a Paris durant ma th`ese.
Je voudrais remercier ma belle famille et mon mari Cyril qui m’a toujours soutenu et aid´e tout au long de cette aventure. Tu m’as montr´e la voie, m’a aid´e avec tes conseils et a toujours ´et´e pour moi un exemple `a suivre. Merci `a ce cours d’anglais du 10 septembre 2007 qui nous a permis de se rencontrer. Merci `a notre b´eb´e qui me donnait des petits coups de pied le jour de ma soutenance, le 21 novembre 2014.
Le 21 f´evrier 2015, `a Toulouse. Tatiana.
Introduction
Safety and Reliability of systems is of great importance for environmental, social and economic reasons. Whether it be for nuclear engineering or for the design of new means of transport (like the Falcon or the Shinkansen), system designers have to perform Safety and Reliability Analyses from the earliest phases of the project. These analyses are codified by the regulation authorities through safety standards such as IEC 61508, ISO 26262, ARP4754 or ARP4761.
Reliability engineers have developed various methods of risk analysis which are now well-mastered: Failure Modes and Effects Analyses (FMEA), Fault Tree Analyses [6], Event Tree Analyses [107], etc. Efficient algorithms and powerful assessment tools are available for them. However, these formalisms have a major drawback. They rely on too low level modeling formalisms. As a consequence, there is always a gap between the specification of the system under study and the associated safety models. This gap makes safety models hard to share amongst the stakeholders and to maintain throughout the life cycle of systems. Even a minor change in the specification may require a complete review of the safety model which is both resource consuming and error prone.
Nowadays, Model-Based Safety Assessment (MBSA) – the Reliability Engineering declension of Model-Based System Engineering – focuses more and more attention in the world. The idea is to write models in high level description formalisms so as to keep them close to the functional and physical architecture of the system under study. High level models can be processed directly (typically by stochastic simulation) or automatically compiled into a lower level formalism (e.g. a Fault Tree).
AltaRica is such a high level modeling language dedicated to Safety Analysis. The first version of the language has been created in the Computer Science Laboratory of the University of Bordeaux (LaBRI) at the end of nineties [80, 7]. This first version made it possible to set-up the basic concepts but was too resource consuming for industrial scale models. Therefore, a second version, AltaRica Data-Flow, has been created at Institute of Mathematics of Luminy (IML, Marseilles) a few years later [88, 14]. AltaRica Data-Flow is now in the core of several industrial Integrated Modeling and Simulation Environments: Cecilia OCAS (Dassault Aviation), Simfia (EADS Apsys) and Safety De-signer (Dassault Systemes). In addition, a great number of tools have been developed to assess AltaRica Data-Flow models, such as Fault Tree compilers, compilers to Markov chains, generators of critical sequences of events, stochastic simulators and model-checkers. AltaRica Data-Flow Integrated Modeling and Simulation Environments are widely used across various industries. Many successful industrial applications have been reported in the literature [10, 97, 52, 85, 4]. AltaRica Data-Flow has now reached an industrial maturity.
AltaRica is an event-based modeling language. Deterministic or stochastic delays can be associated with events. The behavior of components is described by means of state machines. The state of a component is represented by variables (so called state variables) and their values. The changes of state are possible when, and only when, an event occurs. They are described by the transitions. Flow variables are used to model information circulating between components. They are updated by the assertion, which is executed after each transition firing. Components can be assembled into hierarchies, their inputs and outputs can be connected and their transitions can be synchronized.
The aim of the AltaRica 3.0 project [82], conducted at the Computer Science Laboratory of Ecole Polytechnique (LIX), is to develop a modeling, simulation and assessment platform to perform Safety
Analyses with AltaRica 3.0 modeling language. The new version of the AltaRica language, the so-called AltaRica 3.0, is in the core of this project. AltaRica 3.0 improves AltaRica Data-Flow into two directions. First, its underlying mathematical model is based on Guarded Transition Systems (GTS). Second, the language provides new constructs to structure models.
The project aims to develop the following assessment tools (see Figure 1): • The compiler from AltaRica 3.0 to Guarded Transition Systems;
• The stepwise simulator for Guarded Transition Systems; • The graphical simulator of AltaRica 3.0 models;
• The compiler from Guarded Transition Systems to Fault Trees; • The Fault Tree assessment tool XFTA;
• The Sequence Generator for Guarded Transition Systems;
• The compiler from Guarded Transition Systems to Markov chains; • XMRK, a tool to assess multi-phase Markov chains with rewards; • The Stochastic Simulator for Guarded Transition Systems; • The Model-checker for Guarded Transition Systems;
• The Reliability allocation module for Guarded Transition Systems.
Figure 1: The AltaRica 3.0 project
These tools enable the user to perform virtual experiments on systems, to perform end-to-end risk assessment with AltaRica 3.0 and also to do cross check calculations. Thanks to these tools
ix
AltaRica models can be used to perform Preliminary System Safety Analysis (PSSA) and System Safety Analysis (SSA).
In other words, with AltaRica 3.0 models, it will be possible:
• To perform Fault Tree Analysis (FTA) for static and some kinds of dynamic models;
• To calculate different probabilistic indicators for dynamic models using Markov chain analysis; • To perform stochastic simulation of dynamic models;
• To verify system and model properties using model-checking techniques; • To graphically simulate the model in order to validate it;
• To perform reliability and availability allocation for different components given the overall ob-jective.
Within the AltaRica 3.0 project, it is also planned to develop bridges with other tools, especially to work on the integration of system architecture with Safety Analyses through the development of methods and tools to synchronize models of both disciplines.
The contribution of this PhD thesis to the AltaRica 3.0 project is as follows:
• Chapter 2 presents Guarded Transition Systems (GTS), the new underlying mathematical model of AltaRica 3.0. In addition to the ability to handle looped systems thanks to the introduction of a fixpoint mechanism to calculate assertions, as proposed in [90], GTS make it possible to define acausal components (components for which the input and output flows are decided at run time). Different algorithms to calculate assertions and to optimize them are discussed. They have been implemented in the stepwise simulator of GTS. Experiments have been performed, e.g. modeling of network systems, as reported in [71].
• Chapter 3 introduces the structural constructs of AltaRica 3.0. These new structural constructs come from object-oriented and prototype-oriented modeling languages. From our point of view, they make it possible to match better with cognitive processes of engineers. They are assembled into System Structure Modeling Language (S2ML). A new algorithm to flatten hierarchical models, i.e to collapse a hierarchy of nested blocks and instances of classes into a single block, is proposed. It has been implemented in the compiler of AltaRica 3.0 models to Guarded Transition Systems.
• Chapter 4 describes the principle of compilation of Guarded Transition Systems to Fault Trees and critical sequences of events. The compilation algorithm is presented in details. It has been implemented in the compiler of Guarded Transition Systems to Fault Trees. Some experiments are reported.
• Chapter 5 presents the overall architecture of the modeling, simulation and assessment platform developed within the AltaRica 3.0 project. It pays a particular attention to the tools developed as a part of this PhD thesis.
• The series of appendices regroups additional works on AltaRica 3.0 done during this PhD thesis.
Outline of the thesis
To summarize, this thesis is organized in 5 chapters:
• Chapter 1 gives an overview of the main concepts and of the state-of-the-art modeling languages and tools dedicated to Safety Analyses.
• In chapter 2, we introduce Guarded Transition Systems (GTS), the underlying mathematical formalism of AltaRica 3.0.
• In chapter 3, we describe structural constructs of AltaRica 3.0, assembled into System Structure Modeling Language (S2ML).
• In chapter 4, we present the algorithm of compilation of GTS into Fault Trees and critical sequences of events.
• Chapter 5 describes the architecture of the AltaRica 3.0 Modeling, Simulation and Assessment platform.
Finally, this manuscript ends with a series of appendices, which regroup additional works on AltaRica 3.0 done during this PhD thesis:
• Appendix A is dedicated to the modeling of systems with mobile components, e.g. production chains or mobile networks. It presents a comparison between AltaRica and PEPA (Performance Evaluation Process Algebra) nets – a modeling formalism for mobility modeling.
• In appendix B, we compare AltaRica with SAML (Safety Analysis Modeling Language). • Appendix C gives an overview of GraphXica – a high level modeling language for graphical
representation and animation of models. It also describes the graphical simulation of AltaRica 3.0 models.
• In appendix D, we present some modeling patterns to represent common cause failures, cold redundancies, system reconfiguration and shared resources on the example of an electrical system.
Contents
Remerciements v
Introduction vii
Table of contents xiii
List of figures xvi
List of tables xvii
1 Model-Based Safety Assessment 1
1.1 Safety and Reliability studies . . . 1
1.1.1 Probabilistic indicators . . . 2
1.1.2 Redundancies . . . 3
1.1.3 Safety Assessment . . . 3
1.2 Classical approach for Safety Analysis . . . 4
1.2.1 Boolean Formalisms . . . 4
1.2.2 States/Transitions Formalisms . . . 7
1.2.3 Extensions of classical formalisms for Safety Analysis . . . 10
1.3 Model-Based approach for Safety Analysis . . . 12
1.3.1 Advantages of Model-Based approach . . . 12
1.3.2 Prerequisites for a high level modeling language for Safety Analyses . . . 13
1.3.3 High level formalisms for Safety Analysis . . . 14
1.4 AltaRica . . . 15
1.4.1 Assessment tools . . . 16
1.4.2 AltaRica 3.0 . . . 18
2 Guarded Transition Systems (GTS) 21 2.1 Motivations . . . 21 2.2 Informal presentation . . . 22 2.2.1 Data-Flow components . . . 23 2.2.2 Acausal components . . . 24 2.2.3 Hierarchical models . . . 25 2.3 Formal definition . . . 26 2.3.1 Expressions . . . 26 2.3.2 Instructions . . . 28 2.3.3 Definition . . . 28 2.4 Composition of GTS . . . 29 2.4.1 Free product . . . 29 2.4.2 Connection . . . 30 xi
2.4.3 Synchronization . . . 31
2.5 Semantics . . . 33
2.5.1 Semantics of instructions . . . 33
2.5.2 Reachability graph . . . 39
2.6 On the modeling of flow propagation . . . 40
2.6.1 Dependency relation . . . 41
2.6.2 Handling looped models . . . 43
2.6.3 Algorithms to calculate assertions . . . 44
2.6.4 Different approaches to interpret assertions . . . 47
2.7 Timed/Stochastic Guarded Transition Systems . . . 49
2.7.1 Timed Guarded Transition Systems . . . 49
2.7.2 Stochastic Guarded Transition Systems . . . 50
2.8 Comparison with classical formalisms for Safety Analyses . . . 52
3 System Structure Modeling Language (S2ML) 55 3.1 Motivations . . . 55
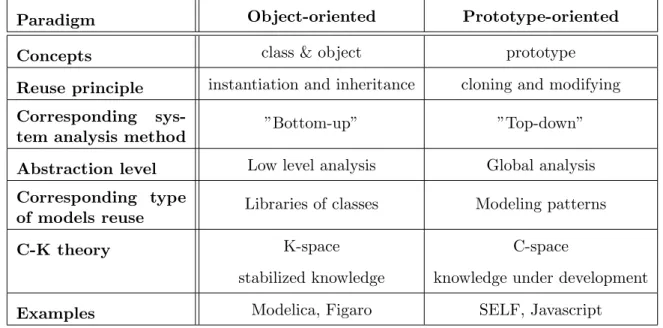
3.2 Object-oriented paradigm vs. prototype-oriented paradigm . . . 58
3.3 Structural constructs . . . 60
3.3.1 Blocks . . . 60
3.3.2 Classes . . . 61
3.3.3 Using Classes or Blocks? . . . 62
3.4 Structural operations . . . 63
3.4.1 Composition (declaration clause) . . . 63
3.4.2 Inheritance (extends clause) . . . 64
3.4.3 Aggregation (embeds clause) . . . 65
3.4.4 Relations between components . . . 66
3.5 Flattening . . . 68
3.5.1 Flattening of the hierarchy . . . 68
3.5.2 Flattening of the synchronizations . . . 72
3.5.3 Hiding . . . 74
3.6 Discussion . . . 74
3.6.1 About models reuse . . . 74
3.6.2 About parametric models and scripts . . . 74
3.6.3 About graphical representation of models . . . 75
4 Compilation into Fault Trees or critical sequences of events 79 4.1 Motivations . . . 79
4.2 Related Works . . . 83
4.2.1 Algorithms based on backward analysis . . . 84
4.2.2 Algorithms based on fault injection . . . 84
4.3 Compilation algorithm . . . 85
4.3.1 Compilation of labeled Kripke Structures into Boolean formulae . . . 86
4.3.2 Partitioning . . . 86
4.3.3 Reachability Graph generation . . . 88
4.3.4 Compilation of Reachability Graphs . . . 90
4.3.5 Compilation of the independent assertion . . . 93
4.3.6 Results . . . 96
4.4 Compilation of stochastic models . . . 99
4.5 Complexity Analysis and correctness . . . 102
CONTENTS xiii
4.5.2 Correctness . . . 103
5 AltaRica 3.0 Modeling, Simulation and Assessment Platform 107 5.1 Motivations: the AltaRica 3.0 project . . . 107
5.2 Overall architecture of the platform . . . 109
5.3 XGTSCore library . . . 110
5.3.1 Optimization of Guarded Transition Systems . . . 110
5.4 Stepwise simulator . . . 112
5.5 AltaRica 3.0 compiler . . . 113
5.6 Fault Tree compiler . . . 115
6 Conclusion 119
A Mobility modeling 123
B AltaRica and Safety Analysis Modeling Language (SAML) 145
C Graphical representation and animation of models 157
D Modeling patterns 167
List of Figures
1 The AltaRica 3.0 project . . . viii
1.1 Safety Assessment . . . 3
1.2 A fault-tolerant multiprocessor system . . . 5
1.3 Fault Tree of the fault-tolerant multiprocessor system . . . 6
1.4 RBD for the fault-tolerant multiprocessor system . . . 6
1.5 Markov chain representing a repairable component . . . 8
1.6 Petri Net representing a repairable component . . . 9
1.7 Comparison of classical formalisms for Safety Analysis . . . 11
1.8 AltaRica Tools . . . 17
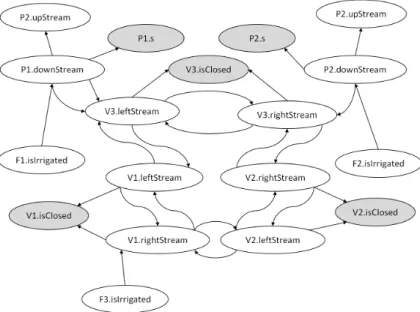
2.1 An irrigation system . . . 22
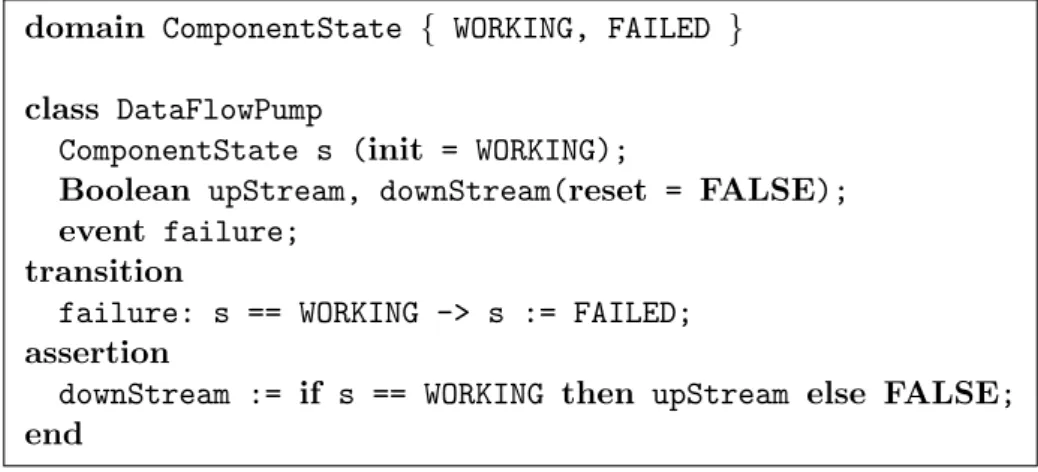
2.2 A Data-Flow pump . . . 23
2.3 GTS representing a Data-Flow pump . . . 23
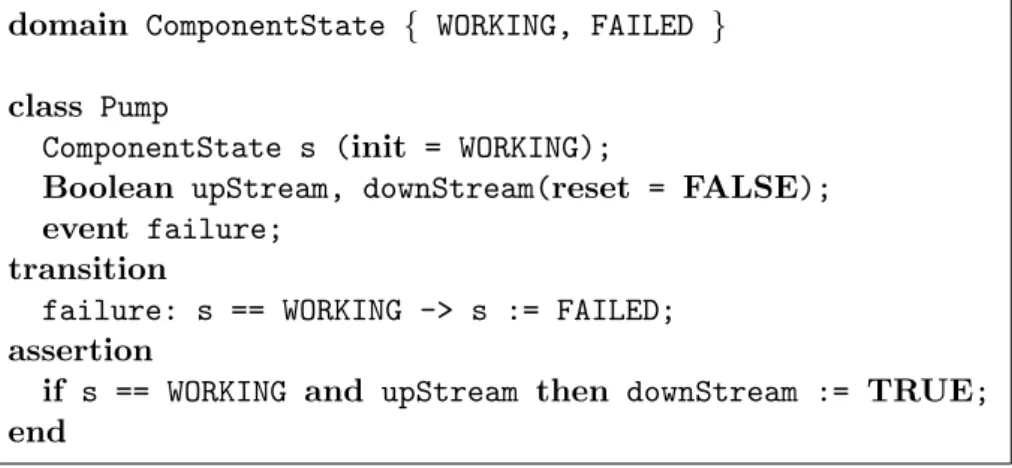
2.4 GTS representing an acausal pump . . . 24
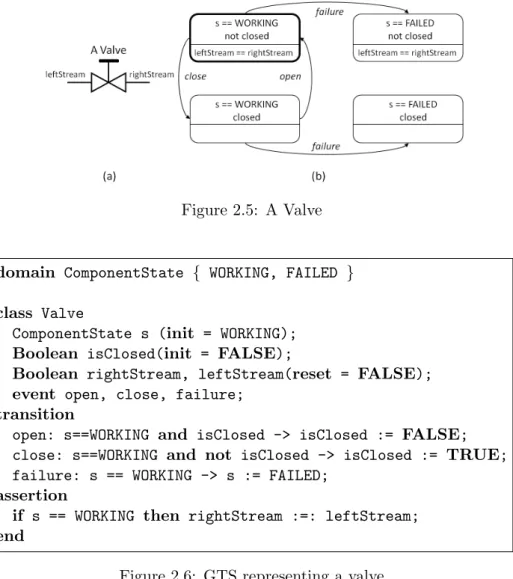
2.5 A Valve . . . 25
2.6 GTS representing a valve . . . 25
2.7 GTS of a Field . . . 25
2.8 GTS of the irrigation system . . . 32
2.9 Flattened GTS of the irrigation system . . . 34
2.10 The Reachability graph of the system . . . 40
2.11 Dependency graph of the assertion of the Irrigation System . . . 42
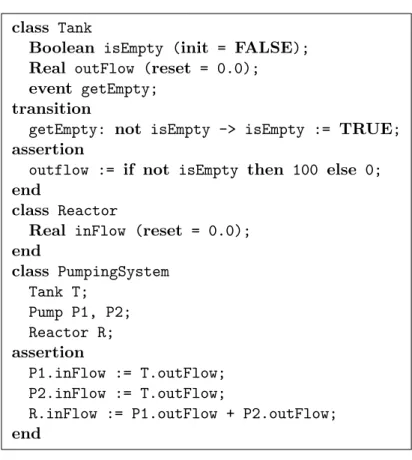
2.12 A pumping system . . . 43
2.13 GTS representing the Pumping system . . . 44
2.14 The Dependency graph of the assertion of the pumping system . . . 44
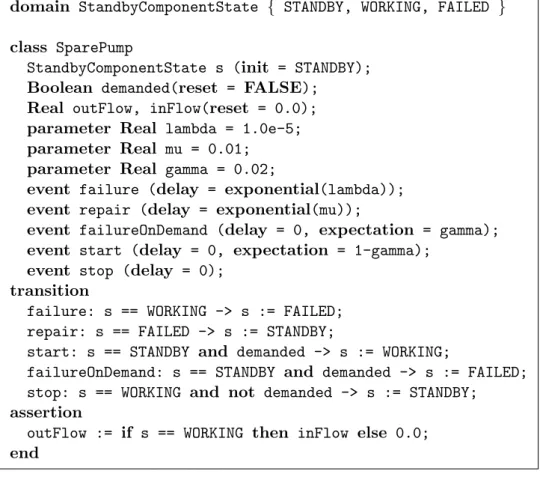
2.15 Stochastic GTS of a spare pump . . . 51
2.16 Stochastic GTS code of a spare pump . . . 52
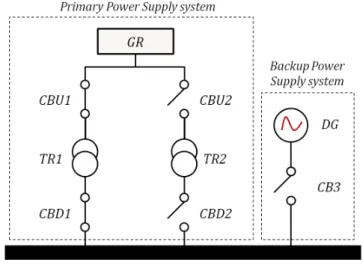
3.1 Power Supply System . . . 56
3.2 Power Supply System model according to the object-oriented paradigm . . . 57
3.3 Power Supply System: break down structure . . . 58
3.4 Primary Power Supply System: Fault Tree view . . . 58
3.5 C-K theory applied to model design . . . 59
3.6 Illustration of block usage . . . 61
3.7 The behavior of the transformer . . . 61
3.8 The AltaRica 3.0 code of the transformer . . . 62
3.9 Illustration of class usage . . . 62
3.10 Declaration of structural constructs . . . 63
3.11 extends clause . . . 64
3.12 embeds clause . . . 65
3.13 Relations between classes, objects and blocks . . . 66
3.14 AltaRica 3.0 model of the Primary Power Supply system: assertions . . . 67
3.15 AltaRica 3.0 model of the Primary Power Supply system: synchronizations . . . 68
3.16 Class flattening . . . 70
3.17 Block flattening . . . 71
3.18 Flattened Primary Power Supply system . . . 73
3.19 Flattened Primary Power Supply system: synchronizations . . . 74
3.20 Illustration of parameters usage . . . 75
3.21 Tree representation of the Power Supply System . . . 77
3.22 1D representation of the Power Supply System . . . 77
3.23 Tabular representation of the Power Supply System . . . 78
4.1 A Data Gathering and Processing Network . . . 80
4.2 AltaRica 3.0 model of the Data Gathering and Processing Network: main block . . . . 83
4.3 Fault Tree Analysis with AltaRica 3.0 models . . . 85
4.4 Compilation of GTS into Fault Trees or event sequences . . . 86
4.5 Partitioning of GTS . . . 87
4.6 Partitioned GTS representing the Data Gathering and Processing Network . . . 89
4.7 Reachability graph of workstations . . . 90
4.8 The algorithm to compile a GTS into Boolean expressions . . . 91
4.9 Dependency graph of the Independent Assertion . . . 97
4.10 Probability of the top events . . . 97
4.11 The algorithm to compile a GTS into Boolean expressions . . . 100
4.12 GTS of a spare workstation with on demand failures . . . 101
4.13 Reachability graph of the system made of two spare workstations . . . 102
5.1 The AltaRica 3.0 project . . . 108
5.2 Architecture of the platform . . . 109
5.3 GTS class diagram: global view . . . 111
5.4 GTS class diagram: instructions . . . 111
5.5 GTS class diagram: distributions . . . 112
5.6 Stepwise simulator class diagram . . . 114
5.7 Compilation of AltaRica 3.0 models . . . 114
5.8 AltaRica 3.0 class diagram: part 1 . . . 115
5.9 AltaRica 3.0 class diagram: part 2 . . . 116
5.10 Compilation of GTS into Fault Trees . . . 117
5.11 Compilation of GTS into Fault Trees: the fourth step . . . 117
List of Tables
1.1 Boolean formalisms . . . 8
1.2 States/Transitions formalisms . . . 10
1.3 AltaRica Tools . . . 19
2.1 The semantics of actions . . . 35
2.2 The semantics of assertions . . . 37
2.3 Comparison of flow propagation mechanisms . . . 49
2.4 Comparison of the formalisms for Safety Analysis . . . 54
3.1 Object-oriented paradigm vs. prototype-oriented paradigm . . . 60
3.2 Classes vs. Blocks . . . 66
4.1 Failure rates of components of the network . . . 81
4.2 Execution times of the program for the model of the Network system . . . 97
4.3 Minimal cutsets for the top event “P1 cannot send data to the plant” . . . 98
4.4 Minimal cutsets for the top event “P2 cannot send data to the plant” . . . 98
4.5 Minimal cutsets for the top event “Neither P1 nor P2 can send data to the plant” . . 99
Chapter 1
Model-Based Safety Assessment
The goal of this chapter is to give an overview of the concepts, modeling formalisms and assessment tools related to the Safety Analysis of critical systems. First, we introduce some basic notions of Safety and Reliability studies. Then, we present the traditional approaches to perform Safety Analyses and compare some classical modeling formalisms: the Fault Trees, the Reliability Block Diagrams, the Markov chains and the Generalized Stochastic Petri nets. The third section is dedicated to Model-Based Safety Assessment. We present the advantages of this approach and give an overview of the existing high level modeling languages dedicated to Safety Analyses. Finally, in the last section, we introduce AltaRica – a high level modeling language dedicated to Safety Analyses, which is the core of this PhD thesis.
1.1
Safety and Reliability studies
Safety and Reliability of systems is of great importance for environmental, social and economic reasons. System designers have to perform Safety and Reliability Analyses from the earliest phases of their projects. These analyses are codified by regulation authorities through safety standards such as:
• IEC 61508 (Functional Safety of Electrical/Electronic/Programmable Electronic Safety-related Systems), intended to be a basic functional safety standard applicable to all kinds of industry; • IEC 61839 (Probabilistic Risk Assessment (PRA));
• IEC 60812 (Failure Mode and Effects Analysis (FMEA)); • IEC 61025 (Fault Tree Analysis (FTA));
• ISO 26262, an adaptation of IEC 61508 for Automotive Electric/Electronic Systems; • IEC 62279, a specific interpretation of IEC 61508 for railway applications;
• DO 178B (Software considerations in airborne systems and equipment certification), etc. Risk has a bi-dimensional nature. Any threat against the system under study must be analyzed along two criteria: its frequency and its severity. That is why, most of the Safety and Reliability Analyses rely on a probabilistic approach: the goal is to determine the most frequent and severe failure scenarios. If the risk is considered as too high and thus unacceptable, then safety mechanisms can be used to minimize its frequency, its severity or both.
The goal of Safety and Reliability studies is to ensure that the system under study satisfies the safety requirements. Safety requirements can be of different nature:
• Qualitative, e.g. ”no single failure should lead the system to its failure state”, and
• Quantitative, e.g. ”the probability of system failure should be less than 10−9”.
In other words, Safety and Reliability studies aim to determine different failure scenarios leading the system from the nominal state to its failure state and to assess different indicators, e.g. the probability of system failure.
Safety Analyses are divided into two groups:
• Qualitative analysis, which goal is to determine different failure scenarios leading the system from its nominal state to its failure state;
• Quantitative analysis, which aim is to assess different probabilistic indicators, such as the prob-ability of system failure.
1.1.1 Probabilistic indicators
Different probabilistic indicators have been introduced in Safety and Reliability studies [8]:
• The Reliability of a system or a component is its ability to function under stated conditions for a specified period of time. Let T be a random variable representing the time of well functioning of a component or of a system. The reliability is denoted by R(t) and is calculated as follows:
R(t) = P [T > t]
This indicator is of paramount importance for non-repairable systems. Sometimes the Unreli-ability is considered instead of the reliUnreli-ability. It is defined as follows: R(t) = 1− R(t).
• The Availability of a system or a component is its ability to function under stated conditions at a specified time t. Let X be a random variable which is equal to 1 at time t if the system is operational at time t and it is equal to 0 otherwise. Then the availability, denoted by A(t), is calculated as follows:
A(t) = P [X(t) = 1]
The availability is important for systems with repairable components. In some situations, the Unavailability is used instead of the availability. It is calculated as follows: A(t) = 1− A(t). • The Maintainability of a system or a component is its ability to be repaired before a given
time t. Let TM be a random variable, representing the time needed to repair a component or a system. Considering that a system or a component is failed at time t = 0, the maintainability, denoted M (t), is calculated as follows:
M (t) = P [TM < t]
One often considers the average values of the indicators:
• Mean Time To Failure (MTTF), the average value of the Reliability; • Mean Time To Repair (MTTR), the average value of the Maintainability.
Probability distributions are used to model failures and repairs of individual components. The most commonly used distribution is the exponential distribution
F (t) = 1− e−λt, t≥ 0,
where λ is called a failure rate. The same distribution with a repair rate µ instead of λ is often used to represent repairs.
1.1. SAFETY AND RELIABILITY STUDIES 3
1.1.2 Redundancies
In order to reduce the risk of system failure, redundancies can be introduced in the systems: as a result, the system under study is composed of a ”main component” and one or more ”spare components”. The spare components are in ”standby” state (also called dormant state), if the main component is ”operational” (is in ”active” state). When the main component fails, it is replaced by a spare component which then becomes active. A spare component may fail in both the dormant and the active states. However, in standby mode, the failure rate is reduced by a factor α, called the dormancy factor, which takes values in [0; 1]. According to the value of α, a spare component may be:
• In Cold redundancy: that means that the spare component cannot fail in standby mode and it corresponds to the case when α = 0;
• In Hot redundancy: the spare component is working at the same time as the main component (α = 1);
• In Warm redundancy: if 0 < α < 1, that means that the spare component may, however, fail in standby mode.
Spare components may be shared between several main components. If a spare component has already replaced a main component, it cannot replace another component.
1.1.3 Safety Assessment
In order to perform Safety Analyses of a given system, Safety Analysts proceed in three steps as illustrated in Figure 1.1.
Figure 1.1: Safety Assessment
The Modeling: First of all, given a system description, the safety analyst creates an appropriate safety model of the system under study. The choice of the formalism depends on the system to model and on the requirements to verify. In practice, this choice depends on the available assessment tools. In the following sections we will see different formalisms used for Safety Analyses.
The Assessment: The second step consists in assessing the created model in order to calculate failure scenarios and different probabilistic indicators.
The Results analysis: Finally, the engineer analyzes the obtained results and produces a report describing if the system satisfies the given safety requirements.
1.2
Classical approach for Safety Analysis
Formalisms, traditionally used for Safety and Reliability studies, can be classified in two categories: • Boolean formalisms, such as Fault Trees [6], Event Trees [107], Reliability Block Diagrams [6]. • States/Transitions formalisms such as Markov chains [101] and Stochastic Petri Nets [63]. Boolean formalisms are the most popular formalisms used for Safety and Reliability studies. Efficient assessment algorithms have been developed for this category of models. They give good approximations of system behaviour. However, these models are not able to represent dependencies between failures and thus cannot capture phenomena such as system reconfigurations or shared resources.
States/Transitions formalisms have an improved expressive power: they allow to capture the order of appearance of events and to represent different types of dependencies. They are a good trade-off between the expressive power and the efficiency of assessment algorithms. Many states/transitions formalisms have been proposed in the literature. Special assessment algorithms have been developed for each of these formalisms.
In this section we present some classical modeling formalisms for Safety Analysis and discuss their advantages and drawbacks. Section 1.2.1 is dedicated to Boolean formalisms for Safety Analysis. Fault Trees and Reliability Block Diagrams are presented. Section 1.2.2 introduces States/Transitions formalisms used for Safety studies. Section 1.2.3 presents some extensions of classical formalisms for Safety Analysis.
1.2.1 Boolean Formalisms
Boolean formalisms are most commonly used in Safety and Reliability studies of industrial systems. They are simple, cover a large spectrum of modeling problems. In addition, very efficient assessment algorithms are available for them.
This category of formalisms mainly includes: • Fault Trees (FT) [6],
• Event Trees (ET) and
• Reliability Block Diagrams (RBD) [6].
In this section we present Fault Trees and Reliability Block Diagrams. The interested reader can refer to [107] for a detailed description of Event Trees.
Fault Trees (FT)
Fault Tree Analysis (FTA) [6] is the most commonly used method for Safety Analysis of industrial systems.
A Fault Tree is a graphical representation of the relationships between the failure events of the modeled system. The root of the Fault Tree, called the ”top event”, represents the global system failure (the undesirable event). The leaves of the Fault Tree, called ”basic events”, represent the failures of the individual components. Probability distributions can be associated with basic events. Basic events are connected to the top event by means of intermediate events and gates. A “gate” is a logical operator: it has several Boolean inputs and one Boolean output. The most commonly used gates are: OR, AND, K-out-of-N (see [6] for a more detailed description). “Intermediate events” are used to name the outputs of gates.
1.2. CLASSICAL APPROACH FOR SAFETY ANALYSIS 5
Example 1.1 (A fault-tolerant multiprocessor system). Consider a fault-tolerant multiprocessor sys-tem depicted Figure 1.2. The syssys-tem is inspired from [63]. It is made of two redundant processing subsystems S1 and S2, a shared memory bank M3 and a bus N. Each subsystem consists of a processor, a local memory bank and two redundant disks. Both processors have access to a shared memory bank M3, through a bus N. We assume that each component may fail in operation and its probability of failure is exponentially distributed with a failure rate λ = 0.001.
Figure 1.2: A fault-tolerant multiprocessor system
The goal is to determine failure scenarios leading the system from the nominal state (when all components are operational) to a failure state (when the system cannot process data) and to assess the probability of the system failure.
The Fault Tree representing this system is depicted in Figure 1.3. Basic events are represented by rectangles with circles below and are marked in grey. They model failures of individual components: memories, processors and disks. The top event, “System failed”, occurs when the bus N is failed or subsystems S1 and S2 are both failed. So it is connected to the basic event “N failed” and to the intermediate event “S1 & S2 failed” via an OR gate. The intermediate event “S1 & S2 failed” is then further broken down. It is connected via an AND to another two intermediate events “S1 failed” and “S2 failed”. Each of these intermediate events is then connected to basic events via OR and AND gates.
Note that a Fault Tree is represented by a Directed Acyclic Graph (DAG), thus the same leaf can be shared between several branches of the tree (see, for example, the basic event “M3 failed” Figure 1.3).
Reliability Block Diagrams (RBD)
In Reliability Block Diagrams, the logic diagram is arranged to indicate the combinations of properly working components keeping the system operational. A Reliability Block Diagram is a set of blocks connected together in parallel or in series. Blocks connected together can be assembled into hierarchies of blocks. Blocks represent system components or subsystems. Each block can be only in two states: working or failed. Only two types of connections between blocks are considered: in parallel or in series. They can be combined.
When modeling a system, it should be abstracted into a hierarchy of blocks connected in parallel or in series.
Example 1.2 (A fault-tolerant multiprocessor system). The RBD representing the fault-tolerant multiprocessor system, described earlier, is given Figure 1.4. The block N represents the bus N and
Figure 1.3: Fault Tree of the fault-tolerant multiprocessor system
the hierarchical blocks S1 and S2 represent the subsystems S1 and S2, respectively. The blocks S1 and S2 are connected in parallel. They are connected in series with the block N. Each hierarchical block Si, i=1,2, is then broken down into blocks connected together in parallel or in series. Blocks representing disks (Di1 and Di2, i=1,2) are connected in parallel, thus they are redundant. Blocks representing memories are also connected in parallel. Block Pi, i=1,2, parallel blocks Di1 and Di2, and parallel blocks Mi and M3 are connected in series.
Note that the block M3 is the same in the blocks S1 and S2.
Figure 1.4: RBD for the fault-tolerant multiprocessor system
Analysis and assessment tools
Reliability Block diagrams can be easily transformed into Fault Trees [99]. A Fault Tree encodes a set of Boolean equations. Both qualitative and quantitative analysis can be performed on a Fault Tree. Qualitative analysis consists of calculation of minimal cutsets. A minimal cutset (MCS) is the smallest combination of basic events that leads to the top event (see [87] for a mathematical definition of a minimal cutset).
Quantitative analysis mainly consists of assessing the probability of the top event and the proba-bilities of the intermediate events, knowing the probability distributions of basic events. Fault Trees can be used to calculate Safety Integrity Levels (SIL) [31] and importance factors [32].
Very efficient algorithms have been developed to assess Fault Trees with up to several thousand Basic Events (see e.g. [93, 91]). Some of them are based on symbolic representations of FT as binary decision diagrams (BDD) as proposed in [86].
1.2. CLASSICAL APPROACH FOR SAFETY ANALYSIS 7
A lot of commercial RAMS (Reliability, Availability, Maintainability, Safety) workbenches are available: Aralia Fault Tree Analyzer (Dassault Systemes), FaultTree+ (Isograph), BlockSim (Relia-Soft Corporation), Item Toolkit (ITEM (Relia-Software), CAFTA (Electric Power Research Institute), etc. In general, these workbenches include a graphical user interface and assessment tools to calculate minimal cutsets and probabilities of events.
In 2008 an Open-PSA initiative was launched: its objective is to create a model exchange format for PSA models [33, 51]. The main idea is to be able to exchange models (Fault Trees, Event Trees, etc.) between different assessment tools in order to perform cross check verifications.
Advantages and drawbacks
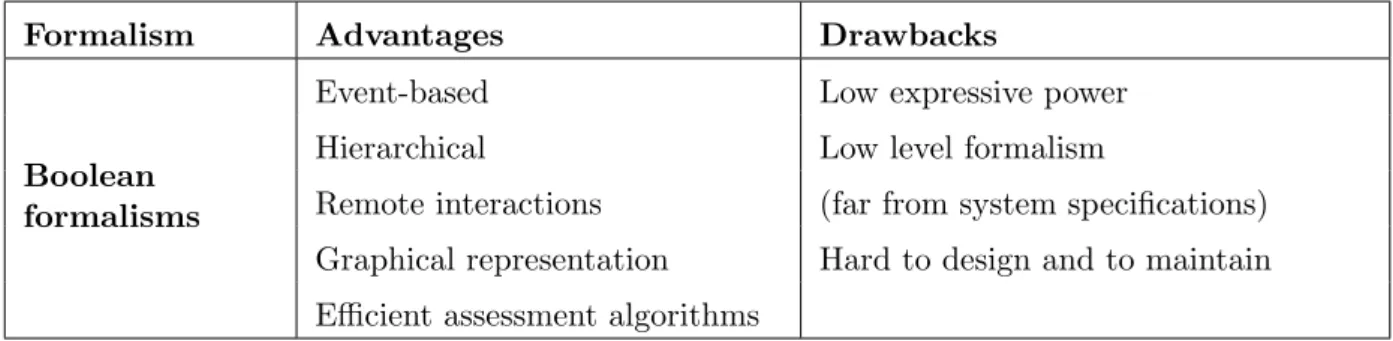
Boolean formalisms present many advantages. First of all, they are event-based. However, only failure events can be considered. Other events (e.g. repairs, reconfigurations) cannot be represented explicitly. Second, they are naturally hierarchical. They make it possible to structure models into hierarchies and to represent break-down structures, as previously seen in Figures 1.3 and 1.4.
Third, they make it possible to represent remote interactions between components, what is espe-cially clear in case of Reliability Block Diagrams.
Finally, they have convenient graphical representations which is important for industrial scale models. Very efficient algorithms and tools are available. Indeed, Boolean formalisms are a good trade-off between the expressive power of the formalism and the efficiency of the assessment algorithms. However, Boolean formalisms put very strong constraints on events (failures) to be considered. All events are assumed to be statistically independent. Among other consequences, it is not possible to take into account the order in which events occur and events can occur any time, no matter the current state of the system.
In the system, described in Example 1.1 and depicted in Figure 1.2, consider that the memory bank M3 is a spare unit shared by the subsystems S1 and S2. When the memory banks M1 and M2 are operational, M3 is not used. When M1 is failed, it is replaced by M3, and M3 cannot be used to replace M2 anymore. In that case the order of occurrence of events is important. Indeed, the event “M3 failed” cannot occur before the failures of the memory banks M1 and M2. The events can no longer be considered as independent.
This type of systems is called dynamic, converse to static systems, i.e. systems for which all events are considered to be independent. Boolean models give approximated results for dynamic systems. To get more precise results, one needs to use more expressive modeling formalisms (e.g. States/Transitions formalisms described in Section 1.2.2).
Also, from a system engineering point of view, Fault Trees and Reliability Block Diagrams are too low level modeling formalisms. Consequently, there is always a gap between the specifications of the systems under study and the associated safety models. This gap makes safety models hard to design, to share amongst stakeholders and to maintain throughout the life cycle of systems. Even a minor change in the specifications may require a complete review of the safety models, which is time consuming, costly and error prone. It is also difficult to ensure the traceability between system specifications and safety models.
The advantages and drawbacks of Boolean formalisms are summarized in Table 1.1.
1.2.2 States/Transitions Formalisms
States/transitions formalisms make it possible to capture dependencies amongst components, such as cold redundancies, resources sharing and sequences of actions. They can handle dynamic models. This greater expressive power comes indeed with a price in terms of practical calculability. They should be used when approximations made with Boolean formalisms are not suitable for the problem under study. This category basically includes:
Formalism Advantages Drawbacks
Boolean formalisms
Event-based Low expressive power
Hierarchical Low level formalism
Remote interactions (far from system specifications) Graphical representation Hard to design and to maintain Efficient assessment algorithms
Table 1.1: Boolean formalisms
• Markov Chains (MC), and
• Generalized Stochastic Petri Nets (GSPN).
Markov Chains (MC)
Markov chains [101] used for Safety Analyses are probabilistic finite state machines. They have a convenient graphical representation:
• System states are represented by circles;
• Transitions between states are represented by arrows labeled by the probabilities. These proba-bilities typically correspond to the failure rate λ or to the repair rate µ of system components. Some states are considered as operational for the system under study (some components may be failed in these states), others are considered as failure states.
To be represented by a Markov chain, the system should verify Markov assumption: ”System evolution depends only on the current state of the system”. In other words, the process is without memory. The assumption is very strong. But it is verified if the delays associated with components failures and repairs are exponentially distributed.
Figure 1.5 illustrates a Markov chain representing a repairable component.
Figure 1.5: Markov chain representing a repairable component
Generalized Stochastic Petri Nets (GSPN)
When using Generalized Stochastic Petri Nets [63] to perform Safety Analyses of systems, places can be interpreted as system states and transitions are often associated with events. A delay possibly stochastic is associated with each transition. Transitions may be immediate or timed. When there are several immediate transitions fireable at a time, the choice is done according to the probability associated with each fireable transition. To be valid the sum of probabilities of all fireable immediate transition should be equal to 1.
Figure 1.6 shows a Petri net representing a repairable component. There two places representing the working state (W) and the failure state (F). Events ”failure” and ”repair” are associated with
1.2. CLASSICAL APPROACH FOR SAFETY ANALYSIS 9
transitions. These transitions are timed. It is possible to define their probability distributions. For example, it can be exponential distributions with a failure rate λ and a repair rate µ. In general, GSPN are assessed by stochastic simulation.
Figure 1.6: Petri Net representing a repairable component
Analysis and assessment tools
Basically, there are three methods to assess dynamic models:
• If the model verifies Markov assumption, then it can be assessed by Markov analysis, in order to calculate reliability indicators.
• When the model does not verify Markov assumption or is too big to be assessed by Markov analysis, stochastic simulation can be used to calculate reliability indicators.
• It is possible to generate critical sequences of events. The limit can be the length, also called the order, of the sequence or its probability.
Each of these methods has its advantages and drawbacks.
Markov analysis The corresponding Markov chain is transformed into a system of differential equations of first order with constant coefficients [101]. From this system of differential equations, it is possible to calculate:
• the three most important instantaneous indicators of Safety Analyses: the reliability R(t), the availability A(t), the maintainability M (t), and
• the average values: Mean Time To Failure (MTTF), Mean Time To Repair (MTTR).
The size of the Markov chain grows, in general, exponentially with the number of components of the system under study. Some tools can deal with Markov chains with over than 1 million states [89]. Nevertheless, the method is applicable only for quite small systems.
Stochastic simulation The principle of stochastic (Monte-Carlo) simulation [2] is to run many histories by drawing at pseudo-random the delays of the transitions and to make statistics on these histories in order to evaluate different performance and reliability indicators. The first advantage of this method is that different probability distributions (not only exponential) are accepted. The second one is the fact that large scale models can be processed using stochastic simulation. The only limit is the execution time of the program because many histories should be simulated to get acceptable results.
Generation of critical sequences of events A critical sequence is a sequence of events leading from the initial state to a critical state. In the case of dynamic models, the order of occurrences of events is important and thus the approximation consisting in extracting minimal cutsets is not suit-able: minimal or most probable sequences or sequences of a given length (also called order) can be extracted by simulation of the model.
Total has developed GRIF, a system analysis software platform used to calculate system reliabil-ity, availabilreliabil-ity, performance and safety indicators. It includes several graphical modeling modules (Reliability Block Diagrams, Fault Trees, Markov graphs and Generalized Stochastic Petri Nets) and classical RAMS assessment tools together with a Monte-Carlo simulation engine.
Advantages and drawbacks
Despite their usefulness to represent dynamic models, Markov Chains become rapidly unmanageable because of the exponential explosion of the number of states. Its graphical representation is convenient for small systems and becomes intractable for large scale models. States of the system are represented in an explicit way. The formalism is not compositional (i.e. it does not allow the description of systems as hierarchies of (reusable) components), and it is difficult to represent flow propagation like in Reliability Block Diagrams.
Generalized Stochastic Petri Nets also enable to represent dynamic models. They have a convenient graphical representation but this representation becomes unreadable for large scale models. They are compositional but with some limits. First, it is only possible to represent simple synchronization of events by fusion of transitions. Second, it is quite difficult to represent the propagation of flows. The modeling should provide mechanisms to describe the inputs, the outputs and the relationships amongst them. We can imagine to introduce input and output places and to use the fusion of places [58]. However, it has its limitations.
In [100] J.-P Signoret describes Generalized Stochastic Petri Nets with predicates and messages to be able to represent the propagation of flows easily.
The advantages and drawbacks of classical States/Transitions formalisms are summarized in Ta-ble 1.2.
Formalism Advantages Drawbacks
Markov chains
Event-based Lack of structure
Graphical representation Difficult to represent remote interactions Dynamic and static models Only quite small systems
Generalized Stochastic Petri Nets
Event-based Lack of structure
Compositional Difficult to represent remote interactions Graphical representation
Dynamic and static models
Table 1.2: States/Transitions formalisms
1.2.3 Extensions of classical formalisms for Safety Analysis
In Safety Analyses, we can use either Boolean formalisms or States/Transitions formalisms. A com-parison between these two categories of modeling formalisms is summarized in Figure 1.7. On the one hand, Boolean formalisms are hierarchical, enable to represent easily remote interactions and have
1.2. CLASSICAL APPROACH FOR SAFETY ANALYSIS 11
convenient graphical representations but they cannot represent dynamic models. On the other hand, States/Transitions formalisms are more expressive but suffer from a lack of structure and difficulties to represent remote interactions.
As a consequence, many proposals to extend classical (Boolean) formalisms in order to improve their expressive power, to be able to capture dependencies between events, can be found in the literature. In this section we present some of them.
Figure 1.7: Comparison of classical formalisms for Safety Analysis
Dynamic Fault Trees (DFT)
Dynamic Fault Trees (DFT) [102] extend traditional (called static) Fault Trees to be able to represent the failure modes which depend on the order of components failures. They introduce different new gates:
PAND Gate: A Priority-AND gate has been introduced to model sequences of failures. The output event of this gate occurs if the input events occur in a specified order.
Spare Gate: A spare gate models components in redundancy. It comprises a main input event and one or more spare input events. When the main input fails, a spare is passed from the standby state to the active state, replacing the main input in its function. A spare gate fails when the main input fails and all spare components are failed or unavailable. A spare component may fail in both the standby and the active states. However, during the standby state, the failure rate is reduced by a factor α.
SEQ Gate: The Sequence enforcing gate forces its events to occur in a specific order.
FDEP Gate: A Functional Dependency gate consists of a trigger event and a set of dependent basic events. The occurrence of the trigger event causes the failure of the basic events.
Dynamic Fault Trees can be assessed by automatic conversion to Markov chains. However, solving a Markov model is much more time and memory consuming than solving a standard Fault Tree. The Markov models can grow exponentially with the number of components used in the modeled systems. An alternative approach is to use stochastic simulation. The advantages and drawbacks of this method have been discussed earlier.
In [64], the DIFTree methodology has been introduced: it combines solution techniques based on Markov chains, Binary Decision Diagrams (BDD) and simulation.
The Galileo [30, 102] software supports Dynamic and Static Fault Trees and provides a set of assessment tools including a Monte-Carlo simulation engine that uses variance reduction techniques for the analysis of reliable systems.
Boolean logic Driven Markov Processes (BDMP)
Boolean logic Driven Markov Processes (BDMP) [16] is a formalism combining concepts inherited from Fault Trees and Markov chains. Informally speaking, a BDMP is a Fault Tree, where
• leaves (basic events) are represented by Markov processes, and
• gates may trigger other gates (which is used to represent cold redundancies).
The overall tree describes a Markov process. BDMP are implemented as a Library of KB3 work-bench, developed by EDF R&D [15]. In practice, BDMP are assessed by generation of most probable sequences of events (performed by FIGSEQ tool integrated in KB3 workbench).
GO-FLOW
GO-FLOW [66] was introduced as an oriented systems analysis technique. This methodology consists of constructing a GO-FLOW chart, by using a set of logical and transition operators connected together to identify the inputs and the outputs of the operators. These connections can represent any physical variable, time or any information. A procedure, to include common cause failures with uncertainty, was introduced [67]. GO-FLOW has been applied to a wide variety of systems in Japan, ranging from the marine reactor MRX [68] to the Shinkansen (Bullet Train) [69].
1.3
Model-Based approach for Safety Analysis
Nowadays, traditional risk assessment methods (Fault Tree Analysis, Event Trees Analysis), presented in Section 1.2 of this chapter, have reached their limits. They rely on too low level modeling formalisms. As a consequence, there is always a gap between the system specifications and the associated safety models. This gap makes safety models hard to design, to share amongst stakeholders and to maintain through the life cycle of systems. Even a minor change in the specification may require a total revisiting of the safety model, which is both time consuming and error prone.
Model-Based Safety Assessment – the reliability engineering branch of Model-Based System En-gineering – focuses more and more worldwide attention. The idea is to write models in high level modeling formalisms so as to keep them close to the functional and physical architecture of the sys-tem [55]. The high level model can be assessed directly or by its compilation into a low level model, e.g. Fault Tree or Markov chain.
1.3.1 Advantages of Model-Based approach
Compared to classical approaches such as Fault Tree Analysis, Model-Based Safety Assessment presents many advantages:
• Safety models are kept close to functional and physical architectures of the systems under study. Therefore, it is much easier to propagate changes in system specifications as well as to trace changes in safety models.
• Safety models are structurally close to models designed by other system engineering disciplines (system architecture, dynamic system modeling, etc.). This proximity is of a great help to better integrate Safety Analyses with other system design processes.
1.3. MODEL-BASED APPROACH FOR SAFETY ANALYSIS 13
• Models can be graphically animated. The incident or accident scenarios can be visualized and discussed. In a word, high level models are much easier to share amongst the different stake-holders than lower level ones.
• In general high level modeling languages have a greater expressive power than Boolean formalisms such as Fault Trees or Reliability Blocks Diagrams. It is therefore possible to capture phenomena, such as spare redundancies, shared components, etc.
• High level modeling favors the reuse of models at the component level (via the design of libraries) and at the system level (via the adaptation of a model designed for a project to another project). Experience shows that this is a great source of cost saving.
• For the same reasons, high level modeling favors knowledge capitalization.
1.3.2 Prerequisites for a high level modeling language for Safety Analyses
In this section we discuss different properties that a high level modeling language for Safety Analyses should have.
First of all, a high level modeling language should be formal, i.e. its semantics should be formally defined. In order to be assessed (compiled into a low level formalism, e.g. Fault Tree or Markov chain, simulated, etc.) the model interpretation must not be ambiguous. The formal semantics ensures the correctness of the obtained results.
Second, a high level modeling language should combine the advantages of both Boolean and States/Transitions formalisms:
• It should be event-based. The goal of Safety and Reliability studies is to determine the most probable failure scenarios, i.e. sequences of events leading the system from its nominal state to a failure state (an incident or an accident). As it was seen in Section 1.2 all classical formalisms are event-based. It should be possible to associate probability distributions to events.
• It should have the expressive power of at least States/Transitions formalisms to be able to represent dynamic models.
• At the same time the language must be compositional in order to make it possible to describe systems as hierarchies of components, like in Fault Trees and Reliability Block Diagrams. • For any reasonable size system, the number of reachable states is just astronomical. It is
im-possible to represent all the states the system may reach. Therefore, the state space should be represented in an implicit way.
• Fault Trees and Reliability Block Diagrams make it possible to represent instant remote inter-actions between components of the system under study. The language should make it easy to assemble components “in a Lego way” and to represent the propagation of flows through the system.
Third, the language should be textual but it must be possible to associate different graphical representations with textual models. From our point of view, it is not possible to have a unique graphical representation of the whole model due to its expressiveness: it would be just unreadable. Diagrams like Markov Chains or Generalized Stochastic Petri Nets are very convenient for small systems but their interest is lost in case of industrial scale systems. Graphical representations must be seen as partial views on the whole model, which in practice can be very complex.
1.3.3 High level formalisms for Safety Analysis
Different high level modeling formalisms have been proposed to perform Model-Based Safety Assess-ment. As suggested in [60], these formalisms can be classified according to the engineering semantics of components interfaces, as follows:
• Failure logic modeling formalisms; • Failure effects modeling formalisms; • Hybrid approaches.
In the following section we introduce some high level modeling formalisms dedicated to Safety Analysis.
Some of them are extension of formalisms widely used in other system engineering domains to perform Safety and Reliability Analyses. The system model is expressed in a dedicated formalism (e.g. Matlab/SIMULINK, SysML, AADL, etc.). It is then annotated with reliability data and converted into a low level formalism for Safety and Reliability Analyses (e.g. Fault Trees, Markov chain, etc.).
Some other formalisms have been especially created to represent system failures and perform Safety and Reliability studies.
Hip-HOPS
Based on a structural system model, Hip-HOPS (Hierarchically Performed Hazard Origin and Propa-gation Studies) [78] is a Safety Analysis technique for automatic generation of Fault Trees and FMEA tables. It describes the structure of the system, in which the basic elements are the system compo-nents. Components can be connected via input and output ports which model the Data-Flow through the system. The failure behavior is specified as the failure of system components, failure effects can then propagate along the defined connections to other components. Models can be imported from different modeling tools: Matlab/SIMULINK, Eclipse-based UML tools or SimulationX [76].
In [106], M. Walker and Y. Papadopoulos propose to generate Temporal Fault Trees from Hip-HOPS models. The Hip-Hip-HOPS approach has been used to perform architecture optimisation [76] and to develop an automatic, optimal SIL allocation for the automotive domain [77].
AADL Error model
AADL (Architecture Analysis & Design Language) [34], developed and standardized by SAE (Society of Automotive Engineers), is used to model embedded real-time systems. AADL can be used to model both software and hardware components and represent system models as a hierarchy of interconnected components. An Error Model annex [35] has been recently added to AADL specification.
In [95], A.E. Rugina et al. propose to transform AADL Error models into GSPN in order to evaluate dependability indicators. An algorithm to automatically generate Fault Trees from AADL Error models is described in [54].
FIGARO
Developed by EDF R&D, Figaro [17] is a textual modeling language dedicated to dependability as-sessment of complex systems. It combines object-orientation language features (e.g. inheritance and hierarchical representation) and first order production rules: interaction rules to model the propaga-tion of instantaneous effects and occurrence rules, yielding a list of events that may happen in a state of the system and have a particular semantics related to time.
Figaro is used as a description language to create knowledge bases (i.e. libraries of reusable components) for KB3 [15], a workbench developed by EDF R&D to automatically perform systems
1.4. ALTARICA 15
dependability assessment, including Monte-Carlo simulation, Markov chain generation and quantifi-cation and generation of critical sequences.
SAML
SAML (Safety Analysis Modeling Language) [45], is a formal synchronous language. A SAML model is expressed in terms of finite stochastic state automata. Automata are all executed in discrete time steps with parallel composition. The semantics of a SAML model is defined as Markov decision process. S3E is a design and verification environment focused on SAML models. It provides a model editor and model analysis tools: a stepwise simulator and translators to the input languages of the probabilistic model checker PRISM and the symbolic model checker NuSMV.
More information about SAML can be found in appendix B, where we compare SAML with AltaRica.
UML, SysML profiles
Constructed as a subset of UML 2.0, SysML is a modeling language for system engineering applications. UML and SysML are graphical modeling languages. They use different types of diagrams to model systems. UML and SysML are notations rather than formal languages.
In [27], P. David et al. propose a method to unify and enhance the development of safety critical systems by linking functional design phase, using SysML, with commonly used reliability techniques (i.e. FMEA and dysfunctional models construction in AltaRica Data Flow). In [109], a framework to automatically generate static Fault Trees from system models specified with SysML is described. Many translations have been defined from specialized UML models to Petri Nets or Fault Trees [12, 70, 61] in order to evaluate system performance or reliability.
1.4
AltaRica
AltaRica is a high level formal modeling language dedicated to Safety Analysis. The first version of the language has been created at the Computer Science Laboratory of Bordeaux (LaBRI) at the end of the nineties [80, 7]. AltaRica is an event-centric language because the primary objective of Safety and Reliability studies is to detect and quantify the most probable sequences of events (failures) leading the system from a nominal state to a degraded state (accident). Deterministic or stochastic delays can be associated with events in order to obtain (stochastic) timed models. In AltaRica, the behavior of components is described by means of state machines. The state of a component is represented by variables (so-called state variables) and their values. The changes of state are possible when, and only when, an event occurs. The occurrence of an event updates the values of the variables.
AltaRica distinguished two types of variables:
• State variables that can be modified only through the firing of transitions;
• Flow variables whose values are calculated from those of state variables thanks to a mechanism described by means of so-called assertions. The assertion is executed after each transition firing. Flow variables are used to model information circulating between components of a model, i.e. eventu-ally to model remote interactions between these components. This ability to model remote interactions is especially important for Safety Analyses, where one of the primary objectives is to study the conse-quences of failures of individual components into the system as whole. Widely used Fault Trees and Reliability Block Diagrams rely almost exclusively on this ability.
The behavior of components is described by nodes (also called classes). Components can be assembled into hierarchies, their inputs and outputs can be connected and their transitions can be
synchronized. Models of components can be stored in libraries, what favors the reuse of models and the capitalization of knowledge.
AltaRica is an asynchronous language: only one transition can be fired at a time. However, it offers a versatile mechanism to synchronize events. This mechanism is also useful to represent remote interactions. Common cause failures, shared repair crews, broadcast, etc. can be represented by means of synchronizations.
The semantics of the first version of AltaRica is defined in terms of Constraint Automata [7]. It is still developed by LaBRI’s team. AltaRica studio is a workbench developed by LaBRI that supports the modeling and the assessment of this version of AltaRica. Several assessment tools have been developed, such as model-checkers [44], Fault Tree compilers and generators of critical sequences of events [43].
This first version was too resource consuming for industrial scale systems. To be able to assess industrial scale systems, a second version, AltaRica Data-Flow, has been created at IML (Marseilles) in 2002 [88, 14]. Its semantics is based on Mode Automata [88]. In this version only Data-Flow assignments are allowed in the assertion, what made it possible to develop a set of efficient assessment tools such as, Fault Tree compilers [88], generators of critical sequences of events, compilers to Markov chains [89], stochastic [58] and stepwise simulators.
AltaRica Data-Flow is now the core language of several industrial, commercially distributed Inte-grated Modeling and Simulation Environments:
• Cecilia OCAS (Dassault Aviation), • Simfia v2 (EADS Apsys), and • Safety Designer(Dassault Systemes).
These environments make it possible to create, to edit and to simulate models graphically. AltaRica Data-Flow Integrated Modeling and Simulation Environments are widely used across various indus-tries. Many successful industrial applications have been reported in the literature (see for exam-ple [10, 97, 13, 11, 52, 85, 98, 23, 4]). The Flight Control System of Dassault Aviation Falcon 7x aircraft have been certified on the basis of AltaRica Data-Flow models [5]. AltaRica Data-Flow mod-els have been used to assess the average production of plants in presence of aleas (e.g. unavailability of machines or human operators) [14].
In 2011, an initiative was launched to standardize the syntax of AltaRica Data-Flow [92]. At the same time a decision was made to change the syntax of the language to make it closer to Modelica [37]. AltaRica is the subject of several PhD thesis. In her PhD thesis [74], C. Pagetti proposes a Timed and a Hybrid extensions of AltaRica to model real time systems, i.e. systems dealing with time constraints. In his PhD thesis, C. Kehren [56] studies architecture modeling patterns to perform Safety Analysis. P. David, in his PhD thesis [26], describes an algorithm to automatically generate AltaRica Data-Flow models from SysML diagrams and FMEA tables. L. Sagaspe, in his PhD thesis [96], uses AltaRica modeling language for reliability allocation in avionic systems.
1.4.1 Assessment tools
A high level modeling language cannot be separated from its assessment tools. Different assessment tools have been created for AltaRica models (see Figure 1.8):
• compilers to Fault Trees [88], • compilers to Markov chains [89], • generators of critical sequences, • stochastic simulators [58],