Liquidity and the Cost of Funds in the European Treasury Bills
Market
Bruno Biais, Antoine Renucci and Gilles Saint—Paul
IDEI March 15, 2004
Many thanks to EuroMTS for access to the data, financial support and many insights in particular with Gian Luca Garbi, Philippe Rakotovao, Pierre Sabin and Laurent Viteau. Many thanks also to Dimitri Vayanos for helpful discussions.
Abstract
We analyze empirically the determinants of Eurozone Treasury bills yields. Market microstructure as well as macroeconomic variables are found to significantly impact yields. Secondary trading in a centralized transparent electronic limit order book enhances liq-uidity and thus reduce yields. Irregularly issuing securities raises the yields government must pay. Consistent with the flight to quality hypothesis, yields are lower when the stock market is volatile. In such periods, the value of liquidity is found to be particularly high. Finally, yields are found to be greater when governments are more indebted.
Keywords: Liquidity, Market Microstructure, Volatility, Treasury bills, Treasury auc-tions, Yield spread, Flight to quality, Eurozone.
Liquidity and the Cost of Funds in the European Treasury Bills
Market
1
Introduction
The goal of this paper is to shed light on the determinants of the yields of Treasury secu-rities. Market microstructure variables are expected to play a significant role. Designing securities and markets efficiently enhances their liquidity and thus their attractiveness to investors. This should lead to relatively low yields. Macroeconomic variables should also matter. For example increases in volatility could induce flight to quality, or large public deficits could have an impact on yields.
The eurozone offers an interesting setting for an empirical investigation of these is-sues. Governments fund long term financing needs with bonds and short term needs with bills. For short term maturity Treasury securities, in contrast with bonds, there are no significant differences across Eurozone countries in terms of default risk. Since there is no longer any difference in terms of exchange rate, yields should be aligned. In fact they are not. Investigating variation in yields in the Eurozone, across countries and over time, should provide information about the respective consequences of microstructure variables and macroeconomic variables for the cost of government funds.
To study these issues we have collected data on Treasury auctions in Belgium, France, Germany, Greece, Italy, Portugal and Spain between 2001 and 2003. For each country and maturity bucket we have, for each auction, the yield spread relative to Euribor, the amount issued, and the amount of the same security preexisting before the auction. In addition we observe microstructure variables, such as the regularity of the amounts issued and whether, in the secondary market, the bill is traded on a centralized transparent limit order book, or only in a fragmented broker market operating on the telephone. Furthermore, we observe macroeconomic variables: the volatility in the stock market before the auction and the ratio of public debt to GDP.
Our empirical results can be summarised as follows.
• The macroeconomic variables have a significant impact on yields. Large public deficits raise yields, maybe because they increase the supply of government securi-ties, and thus depress their prices. Consistently with the flight to quality theory, high volatility reduces yields, maybe because in uncertain times, investors are more eager to hold safe assets, which enables governments to sell Treasury bills at rela-tively larger prices.
• Some of the market microstructure variables significantly affect yields, while oth-ers don’t. Regularly issuing bills significantly reduces yields. So does the efficiency of the organisation of the secondary market. More specifically, as bills become
traded on MTS, a centralised, transparent electronic limit order book, their liquid-ity rises, and correspondingly the yield demanded by investors for holding these bonds significantly declines. On the other hand, we find no empirical support for the hypothesis that the amount of the bill outstanding reduces yields (Admati and Pfleiderer (1988), Pagano (1989), Vayanos and Wang (2003)). However, our em-pirical findings are consistent with the implication from the theoretical analysis of Vayanos (2003) that liquidity is particularly valuable for investors when the market is volatile. Thus, we find that, when volatility is high, yields are lower for bills with a large amount outstanding.
These results yield a rich set of policy implications. To reduce the cost of government funds, treasury agencies should strive to follow regular issuance calendars and encourage the development of transparent electronic limit order books. In volatile times, govern-ments would benefit from bunching Treasury bills issues into a relatively small number of highly liquid benchmark bonds, which could be issued at relatively low yields.
Our results suggest that market microstructure matters. By efficiently designing the fine details of Treasury markets and securities, governments can enhance liquidity, and thus reduce yields and the cost of their funds. Our finding that this is particularly pro-nounced in volatile times is suggestive. Government stabilization can be particularly valu-able at times of large economic fluctuations. Our analysis suggests that, at such times, governments can raise cheap funds by actively encouraging liquidity, e.g., by bunching Treasury bills issues. In further drafts we plan to quantify the savings obtained by Trea-suries thanks to efficiently designing the microstructure of their securities.
One of the main contributions of the present paper is that we study how differences in market microstructure across countries and through time affect yields in Treasury auctions, and thus the cost of funds for governments. Our focus on Eurozone bills enables us to identify the impact of cross country variations in market microstructures while controlling for other possibly confounding factors. Since we consider Eurozone countries observed differences in yields cannot reflect differences in monetary policies or interest rates curves. Since we focus on short term Treasury paper, observed differences are unlikely to be driven by differences in default probabilities. In contrast, most previous papers focus on bonds instead of bills (see e.g. Longstaff (2001) or Goldreich et al (2003)). Also the literature often focuses on the differences between on and off the run (see, e.g, Goldreich et al, 2003, Warga, 1992, or Boudoukh and Whitelaw, 1993) securities rather than between securities issued in markets with different microstructures.
The next section presents the institutional context. The third section presents our economic hypotheses. Section 4 presents the data and results. Section 5 discusses impli-cations of our analysis. Section 6 offers a brief summary and policy impliimpli-cations.
2
Institutional context
The market for Treasury bills in the Eurozone involves a number of participants: the National Treasuries, the National Agencies in charge of the management of the debt,
government securities dealers and brokers, investors and electronic trading platforms, among others. We first present an overview of the primary market for Treasury bills. Next, we briefly describe the secondary market. Appendices A and B contain additional information on the institutional features of the Treasury bills market.
2.1
The primary market
2.1.1 Scope of the Market
Governments finance their expenditures in excess of tax income through the sale of debt obligations. Since limits have been placed on government deficits in the EU, debt as a percentage of GDP should decrease in the coming years in many of the Eurozone countries, thus reducing long-term borrowing needs. However, liquidity shocks should not disappear, thus maintaining government needs for cash, and correspondingly the need for an efficient Treasury Bills market.
Treasury bills sell at a discount from their face value (par) and do not pay interest before maturity. Investors purchasing the bills in the auction and holding them until maturity earn the difference between the issue price (P ) and the face value (F ). Hence, Treasury bills differ from other government securities (i.e. notes or bonds) not only because their maturity is inferior, but also in that they do not offer investors coupons. Denote by t the number of days corresponding to the maturity of the bill. The yield, y, is defined as:
y = 360 t
F − P
P .
All members of the Eurozone, except Luxembourg, issue Treasury bills. Portugal stopped issuing Treasury bills in early 1999 and resumed selling short-term paper in July 2003. In 2003, the largest issuers were France (EUR 231 billion), Italy (EUR 211 billion) and Germany (EUR 65 billion). Overall, governments strive to increase the size and outstanding amount of individual issues, to raise their predictability and regularity, and to limit the number of issuance days, with the stated objective of enhancing liquidity. Accordingly, the average issue increased from EUR 1.113 billion in 2000 to EUR 2.116 million in 2003, while the average number of issue per country decreased from 23.9 in 2000 to 17.7 in 2003. The outstanding size of an issue increased from EUR 1.771 billion in 2000 to EUR 3.481 billion in 2003. For instance, Spain has now the objective of EUR 4-5 billion by outstanding issue. In 2003, Germany, France, Italy and Spain were the countries with the most regular issue size. Since July 2003, Germany has been issuing 6-month Treasury bills (Bubills) with a steady EUR 6 billion size.
Countries with the lowest yield, i.e., the lowest cost of financing, are Belgium, Italy and Spain. Portugal and Greece face the highest cost of financing with short term pa-per, whatever the maturity considered. The average spread between Treasury yields (Y ) and Euribor (E), E−YE , is 5.5%. By comparison, this spread was 1.2% in 2000. Exclud-ing Greece, which used to face financExclud-ing cost higher than Euribor, the average spread increased from 3.1% in 2000 to 5.6% in 2003. This corresponds to a reduction in the cost of short term funds for governments. Our analysis below sheds some light on the determinants of the decrease.
2.1.2 Types of Treasury-Bills
Maturities vary widely within the Eurozone, as depicted in Appendix B. They range from 1 day (e.g. Exchequer notes sold by the Irish National Treasury Management Agency) to 1 year. They can be expressed in days (e.g. in Austria, Germany, Ireland, Italy, Portugal), in weeks (e.g. in France, Greece) or months (e.g. in Belgium, the Netherlands, Spain). For simplicity, and in accordance with market practices, in our empirical analysis, we group maturities in three buckets: 3-month, 6-month and 12-month. Most Eurozone countries issue bills in these buckets. For instance, Spain launched 3- and 6-month Letras del Tesoro (LTs) in 2003 in addition to the existing 12-month (and 18-month) maturity. Germany, which only issues 6-month Bubills, is an exception.1
Some countries (e.g. Belgium, Portugal, Spain) resort to fungible securities to increase liquidity on the secondary market. Spain moved on to the following scheme: the Spanish Treasury issues 3- and 6-month LTs with the same maturity date as 12- and 18-month LTs, increasing the nominal amount of each reference. Furthermore, 12-month LTs with 11 months to maturity, and 18-month LT with 17 months to maturity are issued to further raise the volume of trades in the secondary market. From February 2004 on, 9 references will be outstanding at a given point in time with an average of EUR 4.5 to 5 billion. In order to assure liquidity from day one, the 18-month tranche of each new LT will have a minimum volume of EUR 1.5 billion.2
2.1.3 Issuance
Calendar A generic calendar for Treasury bills issuance within the Eurozone is provided in Appendix B. It shows a great level of heterogeneity across Eurozone members regarding the regularity of issuance. One can distinguish three categories of countries. The first one regroups Austria, Finland and Ireland which issue Treasury bills on an irregular basis. The second one regroups countries that issue some of their securities with the strictest regularity: Belgium on every Tuesday, France on every Monday, Germany on every second Monday of the month, and the Netherlands, on every first and third Monday of the month. Between these two extremes, a third group of countries issue their securities with some regularity: Portugal, on the first and/ or third Wednesday of each month, Spain, once a month also on Wednesday, and Italy which issues 3- and 12-month BOTs at mid month, 6-month BOTs at the end of the month. Italy and Spain try to facilitate reinvestments (hence liquidity) by organizing issuance and further settlement on the days when previous claims reach maturity.
However, even countries that issue some of their Treasury bills with some regularity retain the option to sell other short-term papers when cash needs arise. For example, Belgium uses a panel of dealers to place its Belgian Treasury Bills (BTBs), which are very
1Although most countries focus on EUR-denominated Treasury bills (e.g. France, Greece, Italy, Portugal, Spain), foreign currencies are sometimes used. Some Treasury bills are denominated in US $ (US Commercial Paper in Ireland, some short-term paper in Finland) or in OCDE currencies (e.g. in Austria and Belgium). Minimum denominations range from EUR 1 (Bilhetes do Tesouro, Portugal) to EUR 1,000,000 (Bubills, Germany). However, from 2004 on, the minimum denomination of Bubills will decrease to Euro 0.01.
2In addition to their most liquid securities, some countries also issue less liquid short-term instruments. For instance, Germany sells Federal Treasury Financing Paper (FTFP), Treasury Bills (Schatzwechsel) and Cash Management Bills (Bundeskasserscheine).
short-term instruments. Italy sells flexible- or mini-BOTs when necessary. The generic calendar also shows there is no issuance on Friday.
A comparison of the current generic calendar with the generic calendar of 2000 (see Appendix B) shows no striking improvement in co-ordination: e.g. France and the Nether-lands continue to auction their securities simultaneously on Monday. However, some coun-tries have changed their calendar. For example, Germany, which used to issue Treasury bills in January, April, July, and October, on the second or third Wednesday of the month, now auctions Treasury bills on a monthly basis on the second Monday of the month.
This first picture must be refined since some Eurozone members have adopted issuance policies that differ according the type of instrument sold. For example, the Netherlands auctions securities every two weeks, and each auction consists of two different maturities. Belgium issues in principle every Tuesday either 3- and 6-month, or 3- and 12-month Belgian Treasury Certificates (BTCs). France has adopted a similar pattern for the Bons du Tr´esor `a taux Fixe (BTFs).
An overall comparison of the calendars of 2000 and 2003 for the October-to-December period (see Appendix B) indicates that Eurozone countries had planned to issue Treasury bills on 33 over 65 possible days in 2003. On the 32 remaining occasions, other EU countries planned to issue Treasury bills on 15 days which leaves 17 occasions where Treasury bills were planned to be issued neither by Eurozone countries nor by other EU countries. In 2000, 36 issuance-days were reported for the same period which counted 64 opportunities. 13 issuance-days were reported for other EU countries.
Broadly speaking, countries release the annual calendar regarding the issues to come in year y at the end of the year y-1 or during the first days of year y if they are to use an auction procedure (see section below). They indicate the issuance dates. Information is indicative, but countries try to stick to what they announced. On a quarterly basis, they refine this information by specifying the amount that will be sold at the auction (e.g. France, Germany, Italy, Portugal and sometimes Spain), or at least a range (e.g. Belgium, Finland). On the days preceding the auction further information is released, pertaining to the issuance procedure (e.g. deadlines for bids). A lot of differences remain across countries.
Issuance Procedures A majority of countries use auctions to sell their Treasury bills. Among them, France, Greece, Italy, the Netherlands and Spain almost exclusively resort to this procedure.3 Austria, Belgium, Germany and Portugal primarily rely on auctions.
They also resort to tap issuance for specific claims (e.g. BTBs in Belgium, FTFP in Germany or on specific occasions (Portugal). Finally, Finland and Ireland only use a tap system. In the latter, the authority managing the national debt arranges the placement with a restricted group of investors that form a syndicate underwriting the issue4. Most
countries using auctions rely on multiple-price procedures where the winning bidders get the price or the yield they bid. By contrast, the Netherlands uses the so-called Dutch procedure whereby winning bidders pay a uniform price. This single price is the lowest price (or highest yield) accepted by the government at the auction. Spain sticks to its Spanish or modified Dutch procedure which combines elements of multiple-price
3However, the Spanish Treasury reserves the right to use any other issuance mechanism. The Agence France Tresor can also use syndicated issues.
and uniform-price mechanisms. Relative merits of these types of auctions are still to be determined. There remains some heterogeneity regarding the rules of auctions across countries on top of the multiple-price versus single price difference. Details are given in Appendix B.
Treasury bills can be issued in several tranches, i.e. successive auctions. Securities with the same features thus join other securities previously issued, all of them being fungible. The objective is to raise the amount outstanding on the secondary market. Primary Dealers Primary dealers are financial institutions which specialize in trading government securities. They often handle both the Treasury bills and bonds’ businesses. An increasing number of governments use this system to guarantee the placement of their debt on the primary market and improve the liquidity of their secondary market. Spain was the latest country to opt for a Primary Dealer system in 2003. The objective is to attract both domestic and foreign investors. The main privileges offered to the primary dealers on primary markets are quite similar across the Eurozone: they usually have an exclusive right to make non-competitive bids at or after the auction, an exclusive or privileged access to syndicated issues, and are informed of the government financial policy with priority. Counterpart to theses privileges, the primary dealers accept a number of obligations both in the primary and secondary markets. On primary markets, they must take part in the auctions, in the majority of cases through an average annual of quarterly minimum participation obligation. On secondary markets, they face a number of duties aimed at enhancing liquidity. For example they must quote prices.
However, there exists some differences within and across countries regarding Treasury bills dealers. For example, Belgium has set up three different categories. The first one comprises 16 Primary Dealers, the second one comprises 6 Recognized Dealers for BTCs, the third one comprises Dealers. They have different rights and obligations. On the Treasury bills primary market, Primary Dealers are granted the right, together with the Recognized Dealers, to participate to the competitive auctions. Primary Dealers, unlike Recognized Dealers, can submit non-competitive subscriptions at the weighted average yield of the competitive phase. If Primary Dealers have the obligation to participate regularly to the auctions, Recognized Dealers, as a counterpart to their less extended rights, face no participation obligation, but must promote the placement of the securities. Dealers only handle the BTBs business.
The number of specialists in Treasury bills ranges from 9 in Austria, to 22 in Belgium and France. As displayed in Appendix B, a couple of firms (e.g. ABM Amro, BNP, Cr´edit Agricole Indosuez, Credit Suisse First Boston, Deutsche Bank, Goldman Sachs, JP Morgan, Societe G´en´erale) act as primary dealers in almost every Eurozone country whereas others, among which national banks, only act locally.
The primary dealers in each country may change from one year to the other. Primary dealers that do not meet the standards decided by the issuing authority are erased from the official list while new comers arrive. Standards are different across countries but share the same objective of ensuring participation in the primary market and liquidity in the secondary market. An annual raking of the most involved primary dealers is often communicated (e.g. in Spain).
2.2
The secondary market
Trading in Treasury Bonds in the Eurozone takes place in part on an inter-bank telephone market intermediated by voice brokers and in part on electronic platforms.5 Less often, bills can be listed on a Stock Exchange (Bubills on the Free Market of the Frankfurt Stock Exchange), or trading directly handled by the issuing authority (in Ireland, the NTMA makes continuous two-way prices in EUR Commercial Paper, with prices shown on Reuters and Bloomberg). Transparency is greater on the electronic platforms than in the telephone market.
The company managing the platform designs the trading rules in collaboration with the Treasury Agencies. These rules aim at protecting investors and ensuring a fair and liquid market. Participants in a platform must own sufficient net assets and have a significant turnover in government securities. Market makers must quote two way proposals, i.e., bid and ask quotes, subject to a maximum spread size and minimum traded quantities. They must provide this service during a minimum of trading hours per trading day. Quotes are stored and displayed via the electronic order book. Market dealers only have the opportunity to accept these proposals or not. When the market is open, proposals from market makers and acceptances from market dealers are automatically matched. Price and time priority are enforced.
Market makers are assigned all the “benchmark” or “on-the-run” securities and a num-ber of “off-the-run” securities. The benchmark security is the most recently issued paper within a maturity bucket (in each country). Off-the-run securities6 are the papers that have been replaced by the benchmark. For “Well off-the-run” issues, i.e. benchmarks that have been replaced by several off-the-run issues, there usually are no quoting obligation. However, platforms can provide their members with trading facilities for these securities7. For example in France, market makers must quote and trade three benchmarks: 3-, 6-, and 12-month BTFs.
Although rules governing electronic platforms within the Eurozone share some common characteristics, there are some differences across countries. For example, the maximum spread is 4 basis points in France and Portugal (on MTS) and 3 points in Spain (on SENAF and MTS), while the minimum quantity is EUR 10 million in France and Portugal, and EUR 20 million in Spain. Similarly, the above obligations hold for at least 5 hours (not necessarily consecutive hours) in France and Portugal while they hold for 5 hours and 17 minutes in Spain.
Treasury bills can be traded before they are issued, on the “when-issued” or “grey” market. This market extends from the day the auction is announced until the issue day. As electronic platforms also handle the “when-issued” market in some countries (e.g. France, Portugal), Treasury Agencies can observe the demand for Treasury bills. If they announced a range regarding the volume that to be issued, they can adjust the offer correspondingly.
The normal settlement period for Treasury securities is T+2, except in France where settlement occurs the business day after the transaction day (“next day” settlement).
Set-5Electronic trading platforms include MTS in Belgium, France, Germany, Italy, the Netherlands, Portugal- on the MEDIP, i.e. Special Market for Public Debt -, Spain, as well as SENAF in Spain
6The most recently issued off-the-run paper is called the “liquid” security on MTS plaforms. Off-the-run papers are called “no benchmark” securities on the SENAF platform.
tlement is sometimes simulated trade by trade, i.e. there is no netting (e.g. in Portugal). Besides, settlement of securities traded on the grey market can take place on the auction settlement day (e.g. in Portugal).
Platform members usually pay membership fees, transaction fees, and sometimes su-pervision fees (e.g. in Portugal). Membership fees differ for market makers and market dealers. Transaction fees are based upon the volumes traded by the member. They follow a tiered structure. Qualification for the next tier is based on the cumulating of volumes generated by the participant. Fees vary across countries. For example, when managed by MTS, Treasury-bills market makers pay EUR 10,000 annually in Portugal, whereas they are not charged membership fees in Spain. In Portugal, members, whether market makers or market takers, pay EUR 2 per million traded if the annual volume traded is in the EUR 0-7.5 billion range, EUR 1 for each additional million traded if the annual volume is in the 7.5-15 billion range, EUR 0.5 for each additional million traded if annual volume is in the 15-20 billion range, and EUR 0 for each additional million traded if the annual amount is above EUR 20 billion. In Spain, transaction fees depend on the role of the member: i.e. Treasury-bills market maker only, Treasury-bills and -bonds market maker, or Treasury-bills market maker and Treasury-bonds market taker. The more ex-tensive the role of the member, the lower the transaction fees it faces. Ranges (and the corresponding fees per EUR 1 million traded) are EUR 0-5 billion (EUR 8 fee), EUR 5-8 billion (EUR 5 fee), EUR 8-10 billion (EUR 3 fee), and EUR 10- billion (EUR 1 fee) for market makers in Treasury bills only. As for volumes traded on electronic platforms, MTS plays a major role. It is in competition with SENAF in Spain.
3
Economic Hypotheses
3.1
Market microstructure variables and Treasury yields
As shown by Pagano (1989) and Admati and Pfleiderer (1988) there are positive net-work externalities associated with liquidity. Admati and Pfleiderer (1988) rely on the assumption that some traders have private information about the value of the asset. This assumption is not warranted in the Treasury Bill market. Under symmetric information, Pagano (1989) shows that when trading can take place in two markets, there is a natural tendency for trades to concentrate in one of the two venues. Suppose I must choose be-tween two markets, A and B. If I anticipate that all the other agents will conduct their trades on market A, I expect this market to be more liquid than B. Hence I also choose to carry out my trades on A. Hence concentration of all trades on A is a rational expectation equilibrium.
Vayanos and Wang (2003) extend this argument from the case where agents have the choice between markets to the case where they have the choice between securities. The two securities have identical payoffs, but they may have different liquidity. They rely on a search model, in which investors do not trade in a centralized marketplace but have to search for counterparties. They consider two types of investors: some are subject to frequent liquidity shocks, and thus often need to find counterparties, others are only subject to infrequent shocks. In this context, Vayanos and Wang (2003) obtain a clientele
equilibrium, where one asset attracts the frequent traders, and ends up more liquid, while the other asset is less liquid and attracts the infrequent traders.
This result is consistent with the stylized facts observed on government securities markets. On—the—run bonds (i.e., just issued bonds) are typically more liquid than off— the—run bonds with comparable maturities, and the same issuer. Boudoukh and Whitelaw (1993) report that, in the Japanese government bond market, the vast majority of the trading volume is concentrated in one benchmark bond, which is not always the most recently issued.
Anticipating that they may have to sell back in the future, investors are more willing to purchase liquid securities than illiquid ones. Hence, the price of the latter should be lower than the price of the former, other things equal (see Amihud and Mendelson, 1997). For example, in the theoretical analysis of Vayanos and Wang (2003), the equilibrium price of the most liquid security is greater than that of its less liquid counterpart. Empirical observations confim this theoretical prediction. Warga (1992) finds that yields of on—the— run bonds are significantly below those of their off—the—run counterparts.
In line with the above discussion we posit the following hypothesis:
H1: Treasury Bills with greater amount outstanding should be more liquid and thus be auctioned at relatively lower yields.
In fact, one could refine this first hypothesis by decomposing the total amount out-standing into i) the amount outout-standing before the issue, and ii) the amount issued. While the former should enhance liquidity and thus lower yields, the latter could have an impact on prices, if the market has a limited ability to provide liquidity. This suggests that yields could be increasing in the amount issued. Thus, we posit our second hypothesis:
H2: a) Treasury Bills with greater amount outstanding before the auction should be auctioned at relatively lower yields. b) On the other hand, yields should be increasing in the amount issued.
When describing their issuance policies, Treasury agencies also emphasize the regu-larity of the amounts auctioned. Funds or banks, who buy Treasury bills, may indeed value this regularity. Of course, Treasury securities have short maturities, and investors interested in consistently allocating a fraction of their assets to bills must regularly pur-chase new securities. When there is a steady flow of issues, investors which can participate consistently in Treasury auctions, to meet the objectives of their asset allocation policies. If, in contrast, the flow of issues is erratic, investors can’t rely on it to consistently fit their portfolio allocation strategy. This reduces the attractiveness of the security. In line with this discussion we posit the following hypothesis:
H3: Treasury Bills should be auctioned at relatively lower yields when they are issued at a regular pace.
Until 2000, the secondary market for Treasury bills in the Eurozone operated mainly through voice brokers. Italy offered an exception where a centralized electronic limit order book (MTS), complemented this telephone based market. Between 2001 and 2003 the MTS electronic limit order book for Treasury bills was progressively introduced in the different countries of the Eurozone. The exact dates are the following:
• Belgium and the Netherlands, March 2001. • France, September 2001.
• Germany, March 2002. • Spain, April 2003. • Portugal, July 2003.
It can be expected that the transparent electronic limit order book offers a more efficient market microstructure. Thus it can be expected to raise liquidity. By increasing the attractiveness of the bill for investors, this increase in liquidity could lower the yields they demand to invest in the Treasury security. Hence we posit the following hypothesis: H4: Treasury Bills should be auctioned at relatively lower yields when they are traded in the secondary market on a centralized transparent electronic limit order book.
Other potentially relevant features of the microstructure of the market include its openness to foreign investors and the number of primary dealers. In further drafts of the paper we will endeavour to collect data on these variables and include them in our analysis.
3.2
Macroeconomic variables and Treasury yields
Market volatility can be expected to affect Treasury yields. When markets become more volatile, some investors can be expected to reallocate their portfolio towards safe assets, especially Treasury bills. This flight to quality should thus increase the demand for treasury bills and reduce the yield that government must pay investors. Hence we posit the following hypothesis:
H5: Bills should be auctioned at relatively lower yields when stock market volatility is large.
Flight to quality could result from enhanced investors’ preferences for safe assets and also from enhanced investors’ preferences for liquid assets. Indeed, in the theoretical analysis of Vayanos (2003) liquidity is shown to be more valuable in periods of high volatility. Since, liquidity is greater for securities with greater preexisting amount, this implication from Vayanos (2003) leads us to posit the following hypothesis:
H6: In periods of large volatility, the attractiveness of liquid Treasury bills, with a large amount outstanding, should be reinforced, and their yield lowered
We test this hypothesis by including in the regressors an interaction term equal to the product of market volatility by amount issued.
Large public deficits raise the supply of Treasury securities in financial markets. Since governments are not marginal players in these markets, this is likely to lower the price
of Treasury securities, or equivalently raise their yields. Although the default risk of European governments is very limited it may also be perceived to be larger when public debt becomes very large. This, again would result in higher yields. Consequently the posit the following hypothesis:
H7: Treasury Bills should be auctioned at relatively higher yields when public debt amounts to a relatively large fraction of GDP.
The analysis of Vayanos and Wang (2003) also suggests that the impact of liquidity on prices should be greater for search markets than centralized markets. Hence we expect the adverse effect of a small capitalization on yields to be less pronounced when the share of trading which is conducted on the MTS centralized market is greater.
4
Empirical analysis
4.1
Data
We have collected data on the Eurozone Treasury market between 2001 and 2003. For these three years we have constructed a database including the following variables:
• The day of the auction.
• The issuing country: Belgium, France, Germany, Greece, Italy, Portugal or Spain.8 • The maturity buckets: 3 months, 6 months or 12 months.
• For each auction, we observe the yield of the security issued. To control for exoge-nous changes in the general level of interest rates, rather than focusing on raw yields we analyse the percentage spreads between the Treasury security yield (Y ) and the Euribor (E) at the time of the auction: s = E−YE . Since the Euribor rate is greater than Treasury yields, larger spreads correspond to lower yields, i.e., lower costs of funds for governments.
• For each issue we observe, the amount issued on that auction (X1) and the amount
of the same security preexisting before the auction (X2).
• For each country, each year, and each maturity bucket we have also striven to assess the regularity of the amounts issued. We thus computed the standard deviation of the amounts issued during our three-year period, normalised by the average amount issued (X3).
For each auction we also have collected macroeconomic control variables: • The ratio of public debt to GDP for the issuing country (X4).
• The volatility of the stock market before the auction (X5). We are currently
mea-suring it as the yearly volatility of the Eurostoxx 50 index. In further drafts we plan to also use volatility estimated over a shorter period.
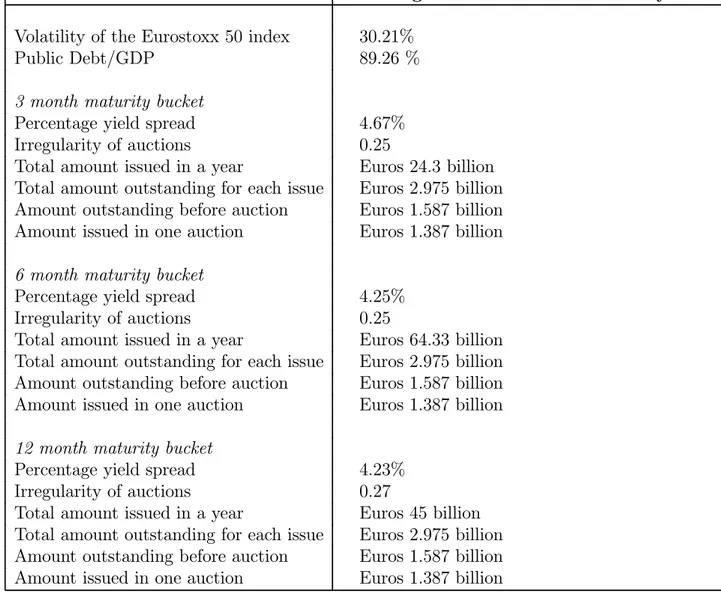
Table 1 presents the average of the variables across the seven countries and three years in our sample. Thus, it portrays the average Eurozone country in terms of the economic varaiables upon which we focus. On average the ratio of public debt to GDP is 87.89%. The average yearly volatility of the Eurostoxx 50 index over the period is 30.21%. The total amount issued per year by the average Eurozone country is Euros 24.3 billion for the 3 month maturity bucket, Euros 64.33 billion for the 6 month maturity bucket, and Euros 45 billion for the 12 month maturity bucket.
4.2
Analysis
We rely on the above described dataset to test our empirical hypotheses about the con-sequences of macroeconomic and microstructure variables on yields. To perform this analysis, we regress the percentage yield spread between the Treasury bill and the Eu-ribor for auction, on the explanatory variables. To control for other country specific variations not captured by our explanatory variables, such as, for example, special tax features, we include country dummies in the regressors. The country dummies (denoted 1j) measure the difference between the 6 countries: Belgium, France, Germany, Greece,
Portugal and Spain, and the benchmark country: Italy. The regression we estimate, for each maturity bucket is:
s = α + 5 X i=1 βiXi+ 6 X j=1 γj1j + ,
where 1j are dummy variables for the six countries. To take into account the interaction
between volatility and liquidity, we estimate an additional regressions where interaction variables are included in addition to the main effects.
In further drafts of the paper we hope to be able to use additional variables, such as the bid—ask spread for the bill on the secondary market, the number of primary dealers, the percentage of the amount outstanding held by foreign investors, and the percentage of primary dealers which are international financial institutions.
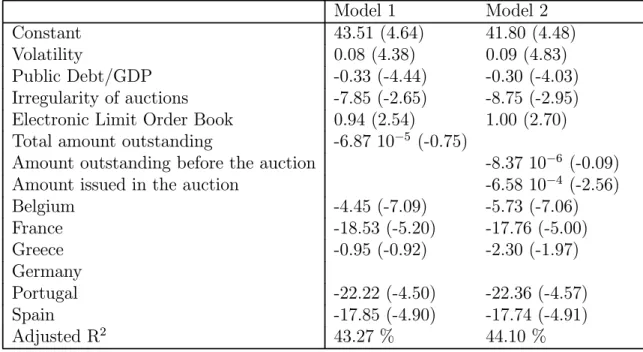
The main effects results are presented in Table 2. In each panel of the table, the explanatory variables are listed in the first column, the second column presents the results obtained when we include in the regressors the total amount outstanding, while the third column presents the results obtained when decomposing this total amount into the amount outstanding before the issue and the amount issued.
Panel A presents the results obtained for the 3 month maturity bucket. Overall, both the microstructure variables and the macroeconomic variables tend to have the signs and significance predicted by our hypotheses. The main exception is that, in contrast with Hypothesis 1 the total amount outstanding has no significant impact on the yield at which the bills are auctioned. On the other hand, as can be seen in the last column of this panel, the amount issued has a negative impact on the yield spread, i.e., it raises the yield the
Treasury must offer. This is in line with Hypothesis 2 b. Bills which are issued in irregular amounts are auctioned at relatively larger yields, consistent with Hypothesis 3. In line with Hypothesis 4, secondary market trading in an electronic limit order book reduces yields. Yields are significantly lower when volatility is large, which is consistent with Hypothesis 6. Finally, yields are significantly larger when public debt is large, which was predicted by hypothesis 7. The significantly negative signs of the country dummies reflect that the Italian Treasury borrows at significantly lower rates than the other Eurozone Treasuries. This may reflect that the secondary market is more developed in Italy, in particular because the electronic limit order book (MTS), which was established earlier in that country, is more liquid. Furthermore, the relatively large spread in Italy reflects the fact that bills, in Italy benefit from a special tax regimes, compared to certificates of deposits.
Panels B and C correspond to the 6 months and 12 months maturity buckets. It is quite remarkable that the signs and significance of the coefficients are quite robust across maturity buckets and specifications. Volatility, public debt, and the regularity of issues have a significant impact on yields in all regressions, consistent with Hypotheses 3, 5 and 7. In line wit Hypothesis 4, all regressions suggest that the presence of the electronic limit order book enables government to issue bills at lower yields, although this is statistically significant only for the 3 month and 6 month maturity buckets. The only variable for which results are mixed or insignificant is the amount outstanding, so that there is no strong empirical support for Hypotheses 1 and 2. For the 6 month maturity bucket, the greater the amount outstanding, preexisting or issued, the lower the yield. For the 12 month bucket, the amount outstanding has no significant impact on yields.
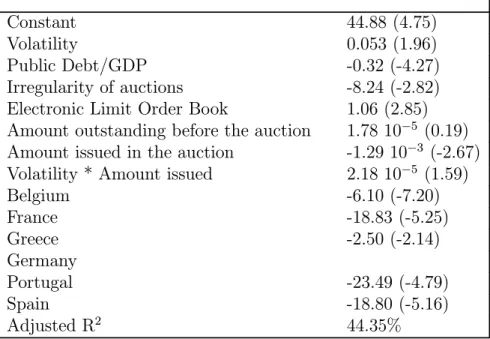
To test Hypothesis 6, we included in the regressors an interaction variable equal to the product of the amount issued by the volatility of the stock market previous to the auction. The results are in Table 3. Quite strikingly, the coefficient is positive in all the regressions. Its significance is only marginal for the 3 month bucket, but it is strong for the 6 month and 12 month buckets. These results are consistent with Hypothesis 6, which suggested that liquidity is more valuable when the market is volatile.
5
Implications
5.1
Quantitative implications for the cost of short term funds
for Eurozone governments
Relying on our empirical analysis, we now proceed to assess the quantitative implications of changes in the microstructure of the Treasury market on the cost of short term funds for Eurozone governments. We focus on the average Eurozone country, which characteristics are depicted in Table 1. For such a country, we analyse the impact of two features: i) the regularity of the amount issued in auctions (measured as the ratio of the standard deviation of the amount issued to its mean) and ii) secondary market trading in an electronic limit order book, such as MTS. Regarding the former we consider two polar cases: the maximum irregularity in our sample, and the maximum regularity. For the 3 month maturity bucket, for example, this corresponds to a coefficient of variation equal
to 0.458 in the most irregular case and .035 in the least irregular case, while the average is 0.25. Thus we differentiate four cases:
• Irregular amounts issued and no electronic limit order book. • Regular amounts issued and no limit order book.
• Irregular amounts issued and limit order book. • Regular amounts issued and limit order book.
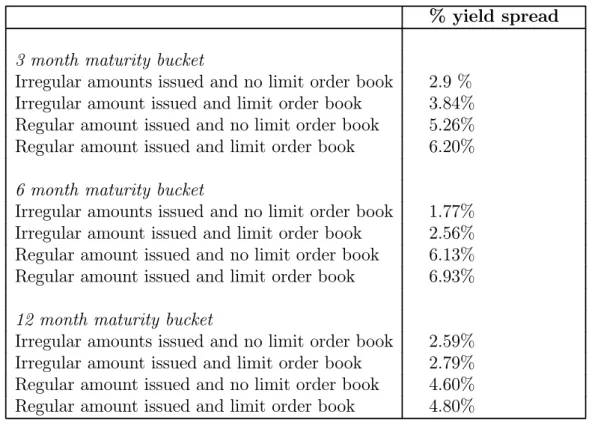
For each of these four cases, and for each maturity bucket, we compute, relying on our regression model, the predicted yield spread for the average Eurozone country. The results are in Table 4, Panel A. In the case where the amounts are issued irregularly and there is no limit order book, the percentage yield spread relatively to Euribor is relatively small: 2.9% in the three month maturity bucket, 1.77% in the 6 month maturity bucket, and 2.59% in the 12 month maturity bucket. In contrast, in the case where amounts are issued regularly and there is a limit order book, the percentage yield spread is much larger: 6.20% in the three month maturity bucket, 6.93% in the 6 month maturity bucket, and 4.80% in the 12 month maturity bucket. Thus improving the microstructure of the Treasury market substantially reduces the cost of short term funds for Eurozone governments.
To quantity this point further we assess in billion of Euros the potential gains from improvements in the microstructure of the Treasury market. Denote I the amount which must be reimbursed by the Treasury at the maturity of the bill (also referred to as the amount issued). The proceeds received by the government at the time of the auction are:
P = I
1 + E(1− s)360t .
Our regression analysis enables us to assess the consequences of the microstructure of the Treasury market on the percentage yield spread, s. Thus we can assess how much the governments can gain by improving the microstructure of the Treasury market. Specif-ically, holding constant the amount to be reimbursed, we compute how much more the government can raise at the time of the auction. To compute this gain, we use as a value of I, the total amount issued in the Eurozone in 2003: Euros 190 billion for the three month maturity bucket, Euros 237 billion for the six month maturity bucket and Euros 160 billion for the 12 month maturity bucket. The gains from regular issues and limit order book secondary trading amount to Euros 51.09 million for the three month maturity bucket, Euros 190.61 million for the 6 month maturity bucket and Euros 108.49 million for the 12 month maturity bucket. This amounts to a total of Euros 350.19 million.
5.2
Implications for other yields than those of Treasury bills
A decrease in the yields of Treasury bills can induce a decrease in yields for other securities. Establishing this point in a general equilibrium model with endogenous transactions costs would be beyond the scope of the present paper. Rather, we take a shortcut, and make
the point relying on arbitrage arguments and a reduced form model of the impact of transactions costs on yields. Consider a simple, two—period model. The beginning of the first period, corresponding to the beginning of the first year, is at t = 0. The second period (or year) starts at t = 1. Denote B1 the price of 12 month Treasury bills at time
1. In line with the analysis above, and with theoretical models (see, e.g., Vayanos, 2003, and Vayanos and Wang, 2003) the price of the bill is decreasing in the transactions costs (cB) incurred by investors trading it in the secondary market. Accordingly, we write the
price as a decreasing function of the cost: B1(cB). Suppose an investor sells the bill on
the secondary at time 1. She receives: B1(cB)(1− cB), which is decreasing in c. Now,
consider two years Treasury notes. Denote their price at time t by Nt, and the transaction
cost on their secondary market: cN. After one year, Two year notes are similar to 12
month Treasury bills. Absence of arbitrage implies that: B1(cB)(1− cB)≤ N1(1 + cN). That is: B1(cB) 1− cB 1 + cN ≤ N 1.
Hence, a decrease in cB, which raises the left—hand—side of the inequality, tends to push
upward the price of the note after one year. This leads to an increase in the price of the note at time 0, i.e., a decrease in the yield the Treasury must pay on its bonds. To see this, suppose for example that two year notes are purchased by investors who may, with probability λ, be hit by a liquidity shock at time 1 and sell their bonds and, with the complementary probability keep the bond until maturity. Denote the face value of the note FN by and the discount rate of the investor by δ. Suppose the investors are
competitive. The price of the note at time 0 is:
N0 = λδN1+ (1− λ)δ2FN,
which is increasing in N1.
A similar, arbitrage based argument can be made for commercial paper, after taking into account default risk, and a similar conclusion arises: a decrease in the yield of Treasury bills tends to induce a decrease in the yields of commercial paper.
Thus, improvements in the microstructure of Treasury bills, inducing a decrease in their yields, are likely to also induce a decrease in the yields of others securities. Hence, the overall financing costs savings induced by an improvement in the microstructure of Treasury securities are likely to be greater than those assessed in the previous section.
5.3
Macroeconomic implications
The analysis above suggests that improvements in the microstructure of the Treasury market reduce the cost of funds for governments. This enhances their ability to rely on fiscal policy to regulate the economy. To the extent that the reduction in Treasury yields also induces a reduction in the interest rates relevant for consumers and firms, it has a positive impact on investment.
6
Conclusion
This paper offers an empirical analysis of the determinants of the yields of Treasury securities in the Eurozone. Our dataset includes the yields and the amounts issued, as well as explanatory variables, for Treasury auctions in Belgium, France, Germany, Greece, Italy, Portugal and Spain between 2001 and 2003. The macroeconomic variables are found to have a significant impact on yields. Large public deficits raise yields, while high volatility reduces yields. Some of the market microstructure variables also turn out to be significant. Issuing bills in erratic amounts raises the costs of funds, while smoothing the flow of issues reduces it. Relying on an electronic limit order book such as MTS in the secondary market enhances liquidity and thus significantly reduce yields. Jointly, these two features of the microstructure of the Treasury markets raise yield spreads from 2.9% to 6.20% in the 3 month maturity bucket, from 1.77% to 6.93% in the six month maturity bucket, and from 2.59% to 4.80% in the 12 month maturity buckets. We estimate the corresponding cost savings per year for the Eurozone governments to a total of Euros 350.19 million. In further work we will strive to analyse further the macroeconomic consequences of this impact of microstructure features. Note however that our results suggest that, in general, the amount of the bill outstanding does not significantly reduce yields. Yet, large outstanding amounts do reduce yields, when the market is volatile. This is consistent with the theoretical result of Vayanos (2003) that liquidity is particularly valuable for investors when the market is volatile.
The policy implications of these results are the following. To reduce yields, trea-sury agencies should follow regular issuance policies and encourage the development of transparent electronic limit order books. Furthermore, in periods of high volatility, gov-ernments would do well to bunch Treasury bills issues into a relatively small number of regularly issued highly liquid benchmark bonds, which could be sold at relatively low yields. This would require to integrate better the existing Treasury bills markets and to enhance the coordination between the different national agencies. This coordination could lead to a common program of regular benchmark bill issues. By concentrating trad-ing on these benchmarks, liquidity should be enhanced. This would entail a correspondtrad-ing reduction in the cost of funds for governments.
References
Admati, A., and P. Pfleiderer, 1988, “A Theory of Intraday Patterns: Volume and Price Variability,” Review of Financial Studies, 1, 3-40.
Amihud, Y. and H. Mendelson, ”Market Microstructure and Securities Values: Evi-dence from the Tel Aviv Stock Exchange”, Journal of Financial Economics, 1997.
Amihud, Y. and H. Mendelson, 1986, ”Asset Pricing and the Bid—ask spread”, Journal of Financial Economics, 223-249.
Amihud, Y. and H. Mendelson, 1991, ”Liquidity, Maturity and the Yield on US Trea-sury Securities”, Journal of Finance, 479-486.
Boudoukh, J. and R. Whitelaw, 1993, ”Liquidity as a Choice Variable: A lesson from the Japanese Government Bond Market”, The Review of Financial Studies, 265-292.
Dupont D. and B. Sack,The Treasury Securities Market: Overview and Recent De-velopments, Board’s Division of Monetary Affairs, Federal Reserve Bulletin, December 1999.
Goldreich, D., B. Hanke, and P. Nath, 2003, The price of future liquidity: Time varying liquidity in the US Treasury market, Working paper, LBS.
Longstaff, F., 2001, The flight to liquidity premium in US Treasury bond prices, Working paper, UCLA.
Pagano, M., 1989, “Trading Volume and Asset Liquidity,” Quarterly Journal of Eco-nomics, 104, 255-276.
Progress Report on National Issuing Calendars and Procedures for EU National Gov-ernment Bills and Bonds, Economic and Financial Committee, October 2000.
Progress Report on Primary Dealership in EU Public Debt Management, Economic and Financial Committee, November 2000.
Vayanos, D., 2003, Flight to Quality, Flight to Liquidity, and the Pricing of Risk, Working paper, MIT.
Vayanos, D., and T. Wang, 2003, ”Search and Endogenous Concentration of Liquidity in Asset Markets,” Working paper, MIT.
Warga, A., 1992, ”Bond Returns, Liquidity and Missing Data,” Journal of Financial and Quantitative Analysis, 605—617.
Appendix A: Additional institutional features of the Treasury bills market
ISIN codes: Treasury bills are identified by an ISIN number9. They are
demate-rialized, registered in a book-entry form. An exception is Austria which issues paper certificates.
Issuance Authority: Most member states of the Eurozone have recently estab-lished national agencies- with various degree of autonomy -in charge of the operational management of their national debt. Exceptions are Italy and Spain. The degree of au-tonomy of national agencies varies. The assignments of these entities generally include the definition of the government debt strategy, its day-to-day management, risk control and management, back-office operations, the follow-up of the secondary market, and the relationships with primary dealers and other financial intermediaries. To achieve these ob-jectives, National agencies have sometimes an independent budget, can hire qualified staff (not exclusively civil servants) and retain them with personnel compensation competitive when compared with the banking sector.
Non competitive bids in Treasury auctions: While Belgium, France, Germany, Portugal and Spain organize both competitive and non-competitive bids, Austria, Greece, and the Netherlands only resort to the former type of bid. Competitive bids may be open to every investor (any individual or legal entity, resident or non-resident in Spain), be “unrestricted” (i.e. open to banks and investment firms in Italy, or to every firm affiliated to Euroclear France and holding an account at the Banque de France in France). How-ever, they are in majority restricted to financial intermediaries specialized in government securities, referred to as Primary Dealers (see the section below). In non-competitive bids, bidders specify the quantity they desire to buy, not the price or yield. This quantity may be limited (e.g. EUR 200,000 in Spain for some auctions). The price they pay varies across countries. Belgium, Germany and Spain offer their bidders in non-competitive auctions the weighted average price of the competitive bids accepted. By contrast, Portu-gal guaranties the highest rate accepted in the competitive phase. Non-competitive bids are organized either simultaneously with competitive bids (e.g. in Spain) or later on (e.g. Belgium and Portugal usually organize them the day after the competitive phase). Access to non-competitive bids is restricted to Primary Dealers in most countries.
Processing of the bids in Treasury auctions Auctions usually take place via an electronic system (Bloomberg Auction System for Belgium, the Netherlands and Por-tugal, Telsat and Swift for France, National Interbanking Network for Italy, Bank of Spain Settlement Service for Spain, Automatic Bidding System for Germany). Spain also authorizes bidders to place their orders via the Money Market Telephone Service.
9Fungible bills share the same ISIN code, whatever the number of months remaining to maturity at the issuance date.
Form of the Bids in Treasury auctions Consistent with the quotes on the sec-ondary market10, bids are submitted as yields in Belgium, France, Greece and Portugal.
By contrast, Germany, Italy, the Netherlands and Spain only accept bids in the form of prices. However, Spain will move to bids in the form of yields from mid-February 2004 on. The tick size varies considerably across countries when bids are in the form of yields: 0.01 of a percentage point in Belgium, 0.005 of a percentage point in France, 0.001 of a percentage point in Portugal- and in Spain in the near future. It is homogenous when bids are in the form of prices: one thousandth of a percentage point in Germany, Italy and Spain.
Restrictions on the Bids in Treasury auctions A majority of countries requires a minimum bid at the auction. It ranges from EUR 1 million in Belgium, France, Germany and Portugal, to EUR 1.5 million in Italy and EUR 10 million in the Netherlands. At least three countries further impose a maximum bid: in Belgium, this maximum bid is 1/4 of the average of the range announced for each bid, while in Italy and Portugal it is equal to the amount offered at the auction. Finally, some restrictions can be placed on the number of bids per bidder: 3 bids that must differ from each other by 0,01% in Italy, 5 bids in Portugal.
Results of Treasury Auctions The ranking of bids is as follows. If bids were in terms of yields, bids are ranked by increasing order of the yields. Winning bidders are the ones that offer the lowest yields. The bids are served up to the point were the amount offered at the auction is completely allocated. The highest yield accepted by the issuing authority is referred to as the cut-off rate, cut-off yield, or stop-out rate. Bidders at that yield are awarded pro-rata of the volume they bid. Bidders higher in yield than the cut-off yield are not distributed any of the issue. If bids were in terms of prices, bids are ranked by decreasing price. Starting from the highest-price bid, all bids are accepted until the amount to be distributed is attained. At the cut-off price or stop-out price, bidders are served pro-rata to the amount they were willing to buy.
Although auctions share an increasing number of characteristics, there still exists some national peculiarities. In Spain, according to the “modified Dutch procedure”, bidders that bid a price above the weighted average of accepted bids pay this weighted average, whereas bidders that bid a price below the weighted average price pay the price they bid. In Italy, the highest price proposed by a bidder is excluded if it exceeds a certain percentage of the average price bid, and this bidder is served at the maximum accepted price at the auction. A minimum accepted price is also computed in order to avoid speculative requests, and bids below that price are excluded. The German Finance Agency has the right to cancel the auction even after it took place if demand is not sufficient. The Portuguese Agency (IGCP) may decide to place an amount up to 1/3 higher than that announced and may also decide not to place part of the entire amount announced. IGCP also reserves the right to limit the amount allotted to each participant to a percentage of the total amount placed at the auction in the competitive phase.
All countries inform the public of the amount offered by the bidders at the auction (also true for the non-competitive bids, if any) and of the amount effectively allotted.
The weighted average price or rate is also given, together with the cut-off price or cut-off yield. The quantity served at the cut-off indicator is released. The cover ratio which represents the amount offered by investors divided by the amount requested by the issuer at the auction is computed. Less frequently, the minimum interest rate accepted (e.g. Portugal), or the maximum accepted price (Italy) are communicated. Other information are the first price not allotted (Spain) or the number of dealers served at the auction (Belgium).
Settlement on the primary Treasury market The usual settlement date is T+2. Italy and France are exceptions as settlement occurs at T+3.
Table 1: Average of the variables in our data set across the seven countries (Belgium, France, Germany, Greece, Italy, Portugal, Spain) over the three
years (2000, 2001, 2003)
Variable Average across 7 countries and 3 years
Volatility of the Eurostoxx 50 index 30.21%
Public Debt/GDP 89.26 %
3 month maturity bucket
Percentage yield spread 4.67%
Irregularity of auctions 0.25
Total amount issued in a year Euros 24.3 billion Total amount outstanding for each issue Euros 2.975 billion Amount outstanding before auction Euros 1.587 billion Amount issued in one auction Euros 1.387 billion 6 month maturity bucket
Percentage yield spread 4.25%
Irregularity of auctions 0.25
Total amount issued in a year Euros 64.33 billion Total amount outstanding for each issue Euros 2.975 billion Amount outstanding before auction Euros 1.587 billion Amount issued in one auction Euros 1.387 billion 12 month maturity bucket
Percentage yield spread 4.23%
Irregularity of auctions 0.27
Total amount issued in a year Euros 45 billion Total amount outstanding for each issue Euros 2.975 billion Amount outstanding before auction Euros 1.587 billion Amount issued in one auction Euros 1.387 billion
Table 2: Regression of the percentage spread between Euribor and the Treasury bill yield
(T-statistic are in parenthesis)
Panel A: 3 month maturity bucket (348 observations) Model 1 Model 2 Constant 43.51 (4.64) 41.80 (4.48) Volatility 0.08 (4.38) 0.09 (4.83) Public Debt/GDP -0.33 (-4.44) -0.30 (-4.03) Irregularity of auctions -7.85 (-2.65) -8.75 (-2.95)
Electronic Limit Order Book 0.94 (2.54) 1.00 (2.70)
Total amount outstanding -6.87 10−5 (-0.75)
Amount outstanding before the auction -8.37 10−6 (-0.09)
Amount issued in the auction -6.58 10−4 (-2.56)
Belgium -4.45 (-7.09) -5.73 (-7.06) France -18.53 (-5.20) -17.76 (-5.00) Greece -0.95 (-0.92) -2.30 (-1.97) Germany Portugal -22.22 (-4.50) -22.36 (-4.57) Spain -17.85 (-4.90) -17.74 (-4.91) Adjusted R2 43.27 % 44.10 %
Panel B: 6 month maturity bucket (222 observations) Model 1 Model 2 Constant 33.31 (5.43) 33.46 (5.45) Volatility 0.07 (4.81) 0.07 (4.61) Public Debt/GDP -0.27 (-5.39) -0.28 (-5.49) Irregularity of auctions -10.30 (-8.73) -10.21 (-8.64)
Electronic Limit Order Book 0.79 (2.43) 0.86 (2.60)
Total amount outstanding 1.53 10−4 (2.02)
Amount outstanding before the auction 8.35 10−5 (0.84)
Amount issued in the auction 2.41 10−4 (2.16)
Belgium -0.14 (-0.19) 0.49 (0.54) France -10.94 (-4.41) -10.68 (-4.29) Greece 2.70 (3.03) 3.33 (3.13) Germany -14.42 (-5.24) -14.62 (-5.3) Portugal -9.69 (-3.36) -9.49 (-3.29) Spain -10.19 (-3.78) -9.87 (-3.64) Adjusted R2 55.45 % 55.49 %
Panel C: 12 month maturity bucket (223 observations) Model 1 Model 2 Constant 27.18 (3.20) 26.91 (3.17) Volatility 0.09 (4.53) 0.10 (4.64) Public Debt/GDP -0.22 (-3.24) -0.21 (-3.05) Irregularity of auctions -5.62 (-3.33) -6.11 (-3.49) Electronic Limit Order Book 0.20 (0.48) 0.17 (0.41)
Total amount outstanding 1.1 10−4 (0.91)
Amount outstanding before the auction 1.53 10−4 (1.21)
Amount issued in the auction -6.11 10−5 (-0.31)
Belgium -1.60 (-1.52) -2.29 (-1.85) France -10.27 (-3.01) -10.43 (-3.06) Greece -0.21 (-0.15) -1.06 (-0.66) Germany Portugal -11.31 (-2.75) -11.55 (-2.80) Spain -10.86 (-2.97) -11.14 (-3.04) Adjusted R2 29.82 % 29.86 %
Table 3: Regression of the percentage spread between Euribor and the Treasury bill yield taking into account interactions between volatility and
amount issued
(T-statistic are in parenthesis)
Panel A: 3 month maturity bucket (348 observations)
Constant 44.88 (4.75)
Volatility 0.053 (1.96)
Public Debt/GDP -0.32 (-4.27)
Irregularity of auctions -8.24 (-2.82)
Electronic Limit Order Book 1.06 (2.85)
Amount outstanding before the auction 1.78 10−5 (0.19)
Amount issued in the auction -1.29 10−3 (-2.67)
Volatility * Amount issued 2.18 10−5 (1.59)
Belgium -6.10 (-7.20) France -18.83 (-5.25) Greece -2.50 (-2.14) Germany Portugal -23.49 (-4.79) Spain -18.80 (-5.16) Adjusted R2 44.35%
Panel B: 6 month maturity bucket (222 observations) Constant 34.93 (5.70) Volatility 0.04 (2.24) Public Debt/GDP -0.29 (-5.67) Irregularity of auctions -10.14 (-8.63)
Electronic Limit Order Book 0.93 (2.81)
Amount outstanding before the auction 9.84 10−5 (0.99) Amount issued in the auction -7.86 10−6 (-0.04)
Volatility * Amount issued 8.80 10−6 (2.07)
Belgium 0.48 (0.54) France -11.01 (-4.45) Greece 3.42 (3.24) Germany -15.00 (-5.47) Portugal -9.88 (-3.44) Spain -10.10 (-3.75) Adjusted R2 56.17%
Panel C: 12 month maturity bucket (223 observations)
Constant 39.48 (4.43)
Volatility 0.011 (0.36)
Public Debt/GDP -0.28 (-4.07)
Irregularity of auctions -9.17 (-4.86)
Electronic Limit Order Book 0.31 (0.75)
Amount outstanding before the auction 1.03 10−4 (0.83)
Amount issued in the auction -1.24 10−3 (-3.37)
Volatility * Amount issued 3.56 10−5 (3.75)
Belgium -3.61 (-2.86) France -14.46 (-4.13) Greece -2.85 (-1.74) Germany Portugal -16.46 (-3.89) Spain -15.33 (-4.09) Adjusted R2 33.92%
Table 4: Quantitative assessment of the consequences of the microstructure of the Treasury market on the cost of short term funds for Eurozone
governments
Panel A: Percentage yield spreads relative to Euribor
% yield spread 3 month maturity bucket
Irregular amounts issued and no limit order book 2.9 % Irregular amount issued and limit order book 3.84% Regular amount issued and no limit order book 5.26% Regular amount issued and limit order book 6.20% 6 month maturity bucket
Irregular amounts issued and no limit order book 1.77% Irregular amount issued and limit order book 2.56% Regular amount issued and no limit order book 6.13% Regular amount issued and limit order book 6.93% 12 month maturity bucket
Irregular amounts issued and no limit order book 2.59% Irregular amount issued and limit order book 2.79% Regular amount issued and no limit order book 4.60% Regular amount issued and limit order book 4.80%
Panel B: Savings in reimbursements induced by improvements in the microstructure of the market
cost savings 3 month maturity bucket
Impact of the introduction of a limit order book Euros 14.55 million (amounts still irregularly issued)
Impact of enhancing the regularity of the issues Euros 36.54 million (without limit order book in the secondary market)
Joint impact of limit order book and regularity Euros 51.09 million 6 month maturity bucket
Impact of the introduction of a limit order book Euros 29.21 million (amounts still irregularly issued)
Impact of enhancing the regularity of the issues Euros 161.36 million (without limit order book in the secondary market)
Joint impact of limit order book and regularity Euros 190.61 million 12 month maturity bucket
Impact of the introduction of a limit order book Euros 9.8 million (amounts still irregularly issued)
Impact of enhancing the regularity of the issues Euros 98.67 million Joint impact of limit order book and regularity Euros 108.48 million