1
1
Enhancing Knowledge for Renewed Policies against Poverty
Working Paper n° 9
Assessment of the different
measures of poverty in Mexico:
relevance, feasibility and limits
Araceli Ortega Díaz
ITESM-EGAP
This project is funded by the European Union under the 7th Research Framework Programme (theme SSH) Grant agreement nr 290752. The views expressed in this press release do not necessarily reflect the views of the European Commission.
2
Assessment of the different measures of poverty in México:
relevance, feasibility and limits
Araceli Ortega Díaz (2014)
Abstract
Mexican government has made many efforts to fight poverty, this efforts could not be measure if it did not have accurate measures of poverty that reflect the changes in time of each type of poverty that social programs target. The current analysis presents the different measures of poverty that have been used in Mexico, their relevance and how they affect the perception of the impact of public policies. It is a document that use expertise accumulated for the past 30 years in Mexico.
Key words: Poverty, Multidimensional Poverty, Marginalization.
1.
Introduction
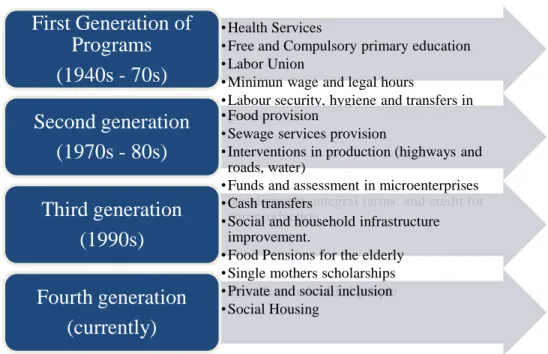
The Mexican government has made different targeted efforts to fight poverty. Since the post times of the Mexican Revolution that promised land and equality to all Mexicans, food poverty was increasing, reaching levels above 60% from 1950 to 1958 (Ortega-Díaz & Székely, 2014), and start declining to 45% and 23% in the 60s. In this period the first generation of social programs that emerge were related with the provision of health and primary education services, fostering labor unions assuring that minimum wage and legal hours of work were respected, together with labour security, hygiene and transfers in goods (Jusidman, 2009); (Ortega-Díaz & Vilalta, 2012). From the 70s to 80s the Mexican government started to operate a second generation of social programs (see diagram 1), that provide basic needs like ensuring food and sewage services provision; connecting and communicating cities and markets that ease production such as the constructions of highways and roads, and irrigation for crops; proving funds for microenterprises development and tutoring, with the target of building integral farms, and credit for agro production. In this period poverty start declining reaching levels of 22.5% to 25%. In the 80s came a period were Mexico signed its incorporation to the General Agreement of Trade and Tariffs –GATT, and poverty remain around 22%.
3
A third generation of focalize social programs started in 90´s, when Mexico issue SOLIDARIDAD that turned into PROGRESA, the cash transfers program that started by providing social and household infrastructure improvement and switched to health, education and nutrition, respectively. In this decade, where demographic focalization was also for the elderly and single mothers, social programs where not enough to fight poverty given the opposite force of the currency crisis in 1994, which was a coincidence with the signature of the North American Foreign Trade Agreement with the USA and Canada. Food poverty jump from 22.5 % to 37.1% and by 2000 it was controlled reaching levels of 20%.
Diagram 1. Generation of Social Programs in Mexico
Source:(Ortega-Díaz & Vilalta, 2012)
The fourth generation of social programs 2000-2010, increase the number of beneficiaries, but did not change much, PROGESA tuned into OPORTUNIDADES, some energy components where added to the original program, but did not work. The government extended the programs related with private and social inclusion, and social housing. Poverty started declining to 13.8%, but the 2008 financial crisis and food basket inflation had an impact increasing poverty above 18%.
•Health Services
•Free and Compulsory primary education •Labor Union
•Minimun wage and legal hours
•Labour security, hygiene and transfers in goods.
First Generation of
Programs
(1940s - 70s)
•Food provision
•Sewage services provision
•Interventions in production (highways and roads, water)
•Funds and assessment in microenterprises development, integral farms, and credit for agroproduction
Second generation
(1970s - 80s)
•Cash transfers
•Social and household infrastructure improvement.
•Food Pensions for the elderly •Single mothers scholarships •Transfers to disabled people
Third generation
(1990s)
•Private and social inclusion •Social Housing
Fourth generation
(currently)
4
From 2009, Mexico switches the official measure of poverty from income indicators, to multidimensional indicators that include those dimensions that had been the targets of the programs, and that the General Law of Social development specifies. Although the income measure, like the food poverty line, is still operating to keep comparisons, the new multidimensional poverty is now the official measure.
The aim of the current paper is to explain the different measures that have being operating in Mexico, discuss their relevance, feasibility and limits.
1.1 General Law of Social Development (LGDS)
To have incidence and acknowledge the impact of the special programs, academics and government require measuring the size of the problem, and quantifying the efficacy of the public resources to tackling the problem, that is why the Mexican government has official measures designed to conduct the social policy in the country. The congress issued the General Law of Social Development (LGDS), that describes the dimensions have been relevant in characterizing the poverty in the history of Mexico. The LDGS, also contemplates the creation of the National Council for Evaluation of Social Development Policy (CONEVAL), this decentralized institution of the Federal government will be responsible for measuring poverty and assess the impact of social programs.
The two main objectives are in one hand to generate the evaluation guidelines that government agencies must follow and also to carry out some evaluations of social development programs in order to emit public policy recommendations. In the other hand, to establish guidelines and criteria to measure poverty using data generated by the National Institute of Statistics and Geography (INEGI), in particular the Income and Expenditure of Households National Survey (ENIGH) which is a biannual Survey. By now, CONEVAL has published four different types of measures:
1. Poverty lines -track back from the Technical Committee to Measure Poverty (SEDESOL, 2002)
2. Social Lag lines (CONEVAL, 2007) .
5
4. Labour poverty lines (CONEVAL, 2011)
In the following section we summarized how these indicators are calculated, as well as the initial indicator use for public policy in Mexico that are poverty related. In section 3 we compare the measures and in section 4 we present a policy exercise. Section 5 concludes.
2. Official Poverty Measures to design Social Policy in Mexico
One of the first focalized and randomized programs in the history of Mexico is the well know cash transfers program OPORTUNIDADES, that currently has more than 5 million household as beneficiaries. This program that started in 1997 uses focalization at geographical, demographic and household level (Hernández Franco, Orozco Corona, & Vázquez Báez, 2008). To perform the geographical focalization, it relies in the marginalization index.
2.1 Marginalization Index (MI)
The marginalization index is an aggregate measure of social deprivation that has been calculated by the National Population Council of Mexico and widely used by the social program OORTUNIDADES (CONAPO-PROGRESA, 1998). This index, which is calculated using the national census and it sample, and adjusted with surveys like the employment survey, can be found since 1990. It is important to notice that this index is highly negatively correlated with the Human Development Index of UNDP. The more marginalized is a region, the lower the HDI is (Hernandez & Orozco, 2002). The MI index comprises 9 indicators that are grouped using principal components method:
1. Percentage of population 15 year old and over who is illiterate
2. Percentage of population of 15 year old and over who has not completed elementary education
3. Percentage of occupants in private houses without piped water
4. Percentage of occupants in private houses without sanitary nor sewer services 5. Percentage of occupants in private houses without electric energy
6. Percentage of occupants in private houses with dirt floor 7. Percentage of occupants with some level of overcrowding
8. Percentage of employed population with income up to two minimum wages 9. Percentage of population that lives in zones of at least 5,000 inhabitants
6
The rank for this index that classifies States, Municipalities, and locality into: very high, high, moderate, low and very low marginalization index. This index is very powerful, as we will see in section 3, when the focalization requires immediate geographical capture of deprivations. The CONEVAL developed a very similar concept called index of social lag.
2.2 Index of Social Lag (IRS)
The Index of Social Lag was developed by CONEVAL abiding the LGDS (CONEVAL, 2007) as it stipulates that this measure together with the Multidimensional Poverty index should be used to define, identify and measure poverty. This methodology, analogous to the marginalization index, uses the National Population Census, aggregating indicators by principal components. These deprivations are considered to define social backwardness.
1. Percentage of population of 15 years and more who is illiterate
2. Percentage of population of 6 to 14 years old who does not attend to school
3. Percentage of population of 15 to 29 years old with a person in the household with less than 9 schooling years approved. (Use for State and Municipality level).
4. Percentage of population of 15 and more who has not completed basic education (used for locality level).
5. Percentage of population without access to health services 6. Percentage of population living in houses with dirt floors 7. Average of people by room in private houses.
8. Percentage of population living in houses without toilet.
9. Percentage of population living in houses without piped water connected to the public network
10. Percentage of population living in houses without sewage. 11. Percentage of population living in houses without electricity
12. Percentage of population living in houses without a washing machine 13. Percentage of population living in houses without refrigerator
States, Municipalities, rural and urban localities are order into five degrees: very high, high, moderate low and very low.
2.3 Three income poverty lines
In 2002 the Technical Committee of Poverty Measurement (SEDESOL, 2002) established three poverty lines based in the ideas of Sen´s capabilities, so that these poverty lines reflect the functioning, capabilities and basic need of people. After CONEVAL was established, it adopted the
7
lines and gave continuity to its measurement, using the National Household Income and Expense Survey (ENIGH), which was representative at national, urban and rural levels from 1989 to 2006, and from 2008 it is also representative at State level. The lines are defined as follows:
1. Food poverty line: counts the number of people that even when using all their disposable income cannot afford the food basket.
2. Capabilities poverty line: counts the number of people that even when using all their disposable income cannot afford the food basket, health and education services.
3. Patrimony poverty line: counts the number of people that even when using all their disposable income cannot afford the food basket, health, education services, clothing, housing and transportation.
By 2008, the official poverty lines, explained above were used in most of the social programs, little attention at national level was put on the 1usd PPP or 2usd PPP that were used to compare at international level the performance of the Millennium Development Goals (MDGs). From 2005, Mexico integrated a group of expert to develop what the LGDS ruled. Among the experts were James Foster, Sabina Alkire, Erik Thorbecke and many others. Together with CONEVAL they developed what is called the Official Multidimensional Poverty line; this was presented in December 2009.
Graph 1. Income Poverty Lines for Mexico (% of people)
Source: Authors own using CONEVAL data.
21.4 21.2 37.4 33.3 24.1 20.0 17.4 18.2 14.0 18.6 18.8 19.7 29.7 30.0 46.9 41.7 31.8 26.9 24.7 24.7 20.9 25.5 26.6 28.0 53.1 52.4 69.0 63.7 53.6 50.0 47.2 47.0 42.9 47.8 51.1 52.3 1992 1994 1996 1998 2000 2002 2004 2005 2006 2008 2010 2012 Food Poverty Capabilities Poverty Patrimony Poverty
8
2.4 Multidimensional Poverty
The Multidimensional Poverty is available for 2008 to 2012, and has one monetary dimension, six deprivations, and one aggregate measure of social cohesion. The dimensions are the following:
1. Income:
a. Population with an income per capita below the welfare line
b. Population with an income per capita below the minimum welfare line 2. Average educational lag in the household
3. No access to health services 4. No access to social security 5. No access to diet/food
6. No quality and housing spaces
7. No access to basic services in the house 8. Degree of social cohesion (at State level)
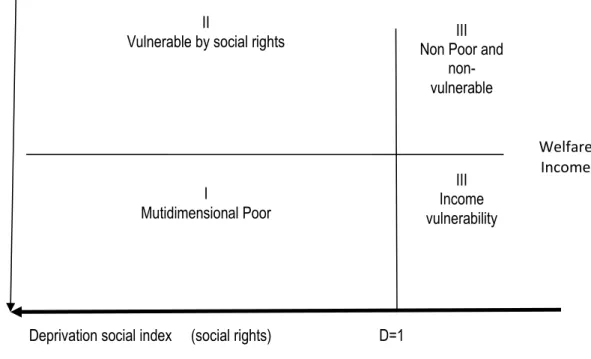
The aggregation is done in two steps, first identifies whether income is enough to satisfy the person’s basic needs and second, if a person suffers of at least one of the six deprivations. Every deprivation is assumed to be a social right, therefore are equally weighted. The combination of these dimensions are described in below and depicted in Figure 1:
I. Multidimensional Poor is someone that suffers from at least one deprivation of social rights and its income is lower than the welfare line.
II. Population vulnerable by social deprivation has an income that is greater than the welfare line but has at least one social deprivation.
III. Population vulnerable by income has an income that is lower than the welfare line and has not social deprivations.
IV. Population that is neither multidimensional poor nor vulnerable has not social deprivations and its income is above the welfare line.
I’. Extreme multidimensional poor population has at least three deprivations and its income is below the minimum welfare line.
9
Figure 1. Identification of population under multidimensional poverty condition
Source: Author´s own using (CONEVAL, 2009) .
To measure social cohesion, there is a battery of questions in ENIGH related to social capital, but it was answered poorly and has excessive missing values, instead of using the answers, CONEVAL decided to approximate the lack of social cohesion using the income Gini coefficient. One of the advantages of this methodology is that it allows to identify poverty among different groups of population, such as female and male or indigenous and not indigenous. In this matter, it is worth to note that since 2008 it is possible to identify indigenous population defined for population aged 5 years and older as having the ability to speak any indigenous language.
The resulting measures for 2008 and 2010 are the following. The Law establishes that measuring poverty must be carried out at least every two years. Currently there are 45.4 percent of Mexicans living in multidimensional poverty, according to official numbers of CONEVAL. See figure 2.
Deprivation social index (social rights) D=1
Welfare Income II
Vulnerable by social rights
I
Mutidimensional Poor
III Non Poor and
non-vulnerable
III Income vulnerability
10
Figure 2. Multidimensional Poverty in Mexico
Source: Ortega(2012) using CONEVAL data.
2.5 Index of the labor poverty trend (ITLP)
To measure in more dynamic way poverty, CONEVAL uses the quarterly National Survey of Occupation and Employment (ENOE), which is available since the first quarter of 2005. The index of the trend of labour poverty -ITLP (CONEVAL, 2011) includes all sources of labour income, and calculates the percentage of population that cannot afford the food basket with its per capita labour income. This indicator is available at national, state, rural and urban levels.
Figure 3. Index of the Trend of Labour Poverty
Source: Author using CONEVAL data.
2012 8.9 36.5 6.3 28.5 19.9 2012
2010 10.4 35.7 6.0 28.0 20.0 2010
2008 10.6 33.7 4.7 32.2 18.7 2008
Extreme Moderate Vulnerable due to Vulnerable due to Non multidimensional poor multidimensional poor multidimensional poor income social deprivation and non vulnerable
Before 55.7, 54 and now 54.6 Before 44.3, 46 and now 45.4
Population in multidimensional poverty Population non multidimensional poor
0.9 0.95 1 1.05 1.1 1.15 1.2 1.25
I II III IV I II III IV I II III IV I II III IV I II III IV I II III IV I II III IV I II
20052005 2006 2007 2008 2009 2010 2011 2012
11
2.6 Multidimensional Index of Decent Work
Using the multidimensional methodology of (Alkire & Foster, 2011), and the definitions of Decent Work of the International Labour Organization- ILO that are in line with the Mexican Labour Law and the Construction, (Ortega Díaz, 2013) presents a measure that shed light in the wellbeing or poverty of the labour force in Mexico. This measure is calculated using ENOE and the following dimensions for each quarter since January 2005, where each dimension uses several indicators:
1. Labor Income. 2. Hours worked. 3. Social Security.
4. Labor and family benefits. 5. Involuntary under employment. 6. Labor rights protection.
7. Respect to labor rights. 8. Job stability.
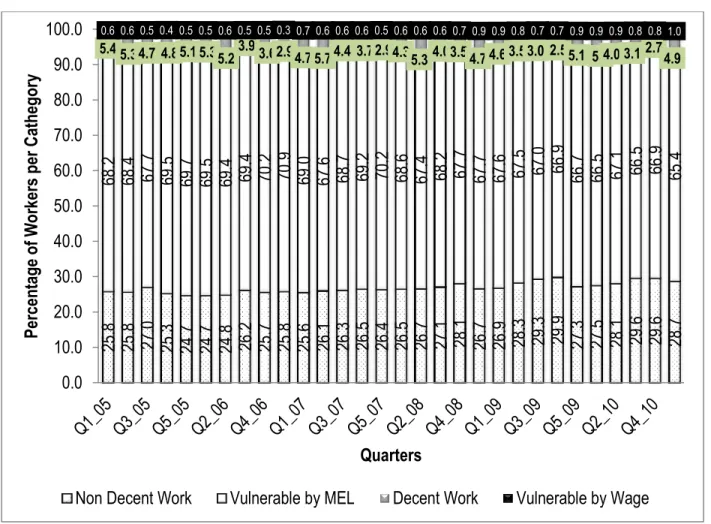
The aggregation for each person is performed taking into account workers with at least one violation the labour rights plus the violation to minimum wage, in case a worker has at least one violation and lower wage than the minimum he/she is a worker with non-decent work. In figure 3 these workers are represented in quadrant I. In the quadrant II there are workers whose Minimum Labors Standards are violated (MEL). These are the workers that have at least one violation of a labour right The workers who do not suffer from any violation t, are classified as having a decent work, and are depicted in quadrant III. Finally, in quadrant IV are those workers whose income is
below the minimum wage, this means that have
1 violated and are reported as labor incomevulnerable.
12
Figure 3. Decent Work Quadrants for México
Source: (Ortega Díaz, 2013).
The results of decent work for México show that, on average, 27.1% of workers have a non-decent job, and 67.6%, on average, have at least one vulnerability, which in most of worker have no access to social security or family benefits (maternity leave or nursery). Only 4.6% of workers enjoy a decent job, and less common is the fact of having all benefits and an income below the minimum wage, this group represents only the 0.7% of the workers.
7 Counting Violation to Achievements 1 0
Minimum wage line II
Vulnerable by Minimum Labor Standards
I Non-decent work III Decent Work III Labor Income vulnerability
13
Figure 4. Quadrants of Decent Work Classification from 2005Q1 to 2011Q1
Source:(Ortega Díaz, 2013).
3. Comparison among measures
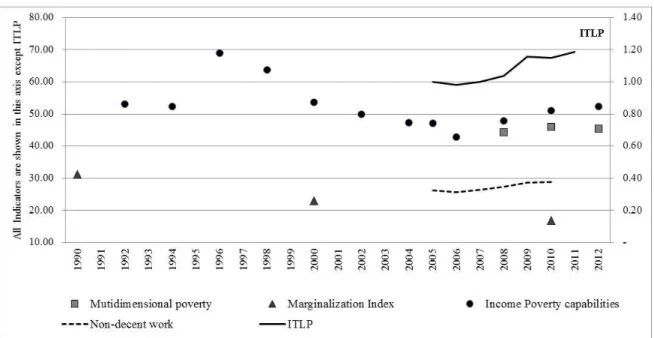
Some of the measures described above are available for at the national level, therefore, we perform a comparison among those measures for those measures that have a national index to see how they are related. The table 1 below shows the gross dimensions for each index, whereas figure 5 shows how all measures move in the same direction, except the marginalization index.
25
.8
25
.8
27
.0
25
.3
24
.7
24
.7
24
.8
26
.2
25
.7
25
.8
25
.6
26
.1
26
.3
26
.5
26
.4
26
.5
26
.7
27
.1
28
.1
26
.7
26
.9
28
.3
29
.3
29
.9
27
.3
27
.5
28
.1
29
.6
29
.6
28
.7
68
.2
68
.4
67
.7
69
.5
69
.7
69
.5
69
.4
69
.4
70
.2
70
.9
69
.0
67
.6
68
.7
69
.2
70
.2
68
.6
67
.4
68
.2
67
.7
67
.7
67
.6
67
.5
67
.0
66
.9
66
.7
66
.5
67
.1
66
.5
66
.9
65
.4
5.4 5.3 4.7 4.8 5.1 5.3 5.2 3.9 3.6 2.9 4.7 5.7 4.4 3.7 2.9 4.3 5.3 4.0 3.5 4.7 4.6 3.5 3.0 2.5 5.1 5.1 4.0 3.1 2.7 4.9 0.6 0.6 0.5 0.4 0.5 0.5 0.6 0.5 0.5 0.3 0.7 0.6 0.6 0.6 0.5 0.6 0.6 0.6 0.7 0.9 0.9 0.8 0.7 0.7 0.9 0.9 0.9 0.8 0.8 1.00.0
10.0
20.0
30.0
40.0
50.0
60.0
70.0
80.0
90.0
100.0
Pe
rc
ent
age
of
W
ork
ers
per
Cathegory
Quarters
14
Table 1. Summary of dimensions used in different measures of wellbeing
Dimension Multidimensional Poverty Social Lag Marginalization Income Poverty Labor Poverty Non-decent work Education Health Food Social Security Basic Services in the household House materials Social Cohesion Household members Labour Income Non labour income Population distribution Labor rights Family Care
Source: Authors own.
Note: An extensive explanation of each dimension can be found in the appendix.
From the six measures compared, we observed that some dimensions are most of the time present: income, education, social security (including access to health services) and services in the household. Figure 5 is very informing in the sense that it provides us with the view that
15
persons´ wellbeing in Mexico has been deteriorating since 2005 shown by the increase in the income poverty index, and the increase in non-decent work, and increase in the labour poverty tendency. The multidimensional poverty increased from 2008 to 2010, and then decreased a bit. The only measure that shows improvement is the marginalization index which shows that social deprivation has slightly decrease in the last 20 years.
Figure 5. Comparing different measures of wellbeing
Source: Author’s ‘own.
Note: The Social Lag index is not included is because is not available at national level.
What we can infer from these indexes is that in the last 20 years the geographical condition and basics need in Mexico have improve, but individuals and households poverty and non-decent work has increase since 2005. Hence, while government should keep improving Nations welfare as a whole providing public infrastructure and services, there is still place to improve the work conditions which finally are the ones that bring income to the household and decreases poverty.
In the case of income poverty line, a cash transfer will decrease automatically the number of people below the poverty line, but that is an artificial decrement. If we withdraw the cash transfer, the poverty will raise. Therefore, the need of a chronic poverty measure is more
16
suitable to heal poverty, like self-income creation.
4. Public policy example
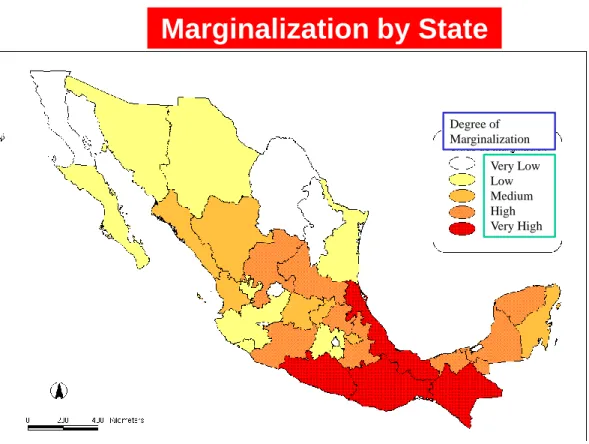
This section highlights the importance of having at least two measures of wellbeing that indicate the level of poverty view from different perspectives, because the objective of the measures is to help policy makers to target poverty accurately. One example where a single measure is of not enough is when we are targeting poverty geographically, for example, using principal component index of marginalization at State level, to tackle extreme poverty may misguide the policy, because this index at State level may not show signs of marginalization, but within State there is inequality, and some Municipalities are living in extreme poverty.
Let’s see the case of Mexico, at State level, the marginalization index shows that high marginalization is seen in the southern states of Mexico. In the map of figure 6, they are shown y red color. In the case the policy maker decide that the budget to fight poverty should be allocated in those States, this decision miss specified poverty, because there exist in Mexico areas of high marginalization in the northern Stated too that can only be shown using the same index but at Municipality level.
17
Source: authors own using (Hernandez & Orozco, 2002)
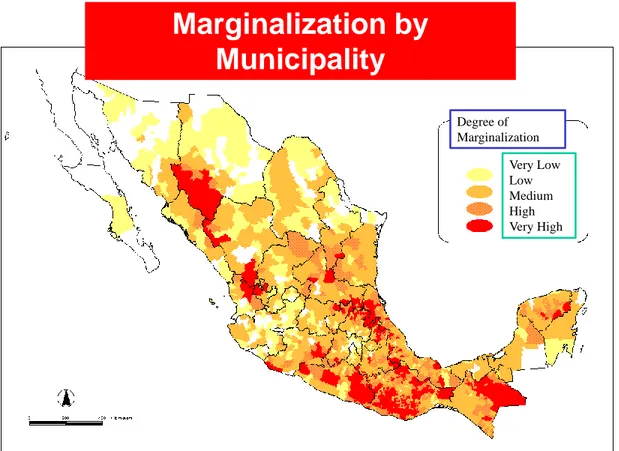
In figure 7 we can see that municipal level sheds more light about where people who suffer high deprivations levels. At this level we can observe that marginalized areas are not only in the south of the country, but in the center and north. The north for example, corresponds to the Sierra Tarahumara zone.
Figure 7. Marginalization index by Municipality
Marginalization by State
Very Low Low Medium High Very High Degree of Marginalization18
Source: authors own using (Hernandez & Orozco, 2002)
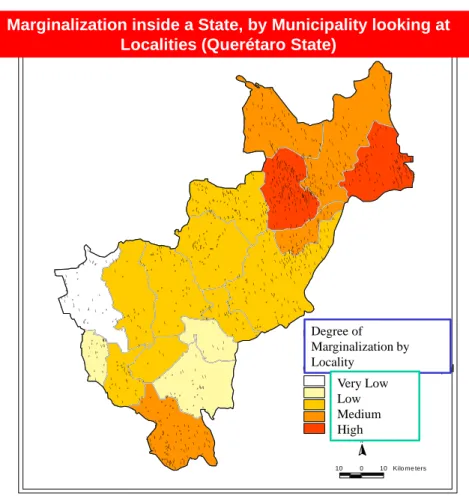
Going deeper, we can use the marginalization index by locality, shown in figure 8. This shed more light of the importance of unit of measurement, because the State of Querétaro which in figure 6 seems to be of low marginalization, has in fact localities with high marginalization. This geographical index helps us to acknowledge the concentration of household in a region that urged to be attended. But once we have targeted an area with the marginalization index, it comes with the need of deciding which household in that area is should be selected, and we require another index. For example, assessing which dimension of deprivation is the most relevant to tackle is better done by using a multidimensional index where dimensions can be analyzed isolated, one by one, and by household rather than with the marginalization index that is an aggregated measure of the geographical area.
Figure 8. Marginalization of a State
Marginalization by
Municipality
Degree of Marginalization Very Low Low Medium High Very High19
Source: authors own using (Hernandez & Orozco, 2002)
This statement means that we need a different tool to select the household and the deprivation. Continuing with the example of Queretaro, we can determine whether is a priority to set a social program that fights access to health services rather than a social program that provides access to education. For instance, using the dimension of the multidimensional index described in section 2.6, we can see in table 1, that the percentage of people that suffers from a deprivation is always lower for Querétaro, than for the whole country, consistent with the State marginalization, but that two main concerns for the household is the same: access to social security and access to health services. So we can match both indexes and analyze weather policy makers should start fighting one of this dimensions in the geographical areas with high marginalization.
Table 1. Dimensions of Multidimensional Poverty
\ \ \ \ # \ \ # # \ \\ \ \ \\\ \ # # \ \ \ \ \ \ \ # \\ \ \ # \\\\\\###\\ \ \ \#\ \ \\ \\\ \\ \ \\\\\\\# \##\\\\\\\\#\\\\\ \\\ \\\\\ \##\\\\\\\\\ \ \\# \\\\#\\\\\ \\\\\\\\\\\\\\\ \\\\\\\\\#\#\ \#\#\\\ \#\\\\\#\\\\\\\\\\\\#\\##\#\\\##\\\#\\\\\\\\#\\\\\\\\\\#\\\\\\\\\###\\##\#\#\\#\\#\\\ \#\\\\\\ \\\\# #\\\\\\\#\\\\\\\#\\\\\\\\\\\\ \#\###\\\ #\\\#\\#\\\#\\#\ # \\##\\##\\\\\\\\#\\\\\\\\\#\\\\\\#\\#\##\\\\\\\\\\\\\\\\\\\\\\\\\\\#\#\\\\\#\ \## #\ # \ \ \\#\##\# #\\\\\\#\#\### #\#\#\\\##\##\\#\\#\#\#\\###\#\#\\\\\\##\\\#\\\\\\\\####\#\\\\\\\\\\\\\\\\\\\\\\\\\\\\\\\\\\\\\\\\\\ \ # \ \\ \ \\\ \ \\\#\\\\\\##\\ #####\ \#\\ \\##\#\\\#\\\#\\##\#\\\ \\ \ \ # \ \ \ \# ### \#\ \ \ # # \ \\### \ \\ # \ ##\##\\\ \\ #\### ###### #\# #\\\\\#\\#\\\\\\##\\\#\#\#\##\\\\\\\ # \ \ # \ # \ \ # # \ ## # #\ # # \ \\\#\\###\\ # \ \ \ \\\ \ \ # # # \ \ \\ \ \\##\ # # ## \ ###\\\ ## ## ####\\\#\\ \ \\\ \ \ # \ \ \ \ \\\ #\#\\\##\# \ ####\ ##\\#\##\ \ ## \ #####\\\\#\\\\#\\\\######\#\ # # #\#\##\\\#\#\\\\\ # #\# # \ # #\# # # # # \ \\\\ # \\ \ \#\\\ \ \ \ \\ \ \ # \ \ \ # # #\ # # ## # #\ # \ \ \ # # \\#\ # \ #\ \ \\ \# ## # \\ #\ # \\ \ \ # # ##\ # # \ \ # # # \\ \\\ # ####\ # \ \ ## # # # # # # # \ ### \ # \ \ \ # \ \ ## \ # # # \ \ \ \# \ \ # #\\ # \ \\\\##\\# ##\\#\\\\###\\\\#\\\#\\\ ### \ # # # ##\ \ \\#\ \\\\\ \\\ \ 10 0 10 Kilo me ters N
Querétaro. Localidades de 2,500 o más habitantes que cuentan con AGEB
Querétaro. Marginación municipal y localidades marginadas Querétaro. Infraestructura de carreteras
Grado de marginación municipal Muy bajo Bajo Medio Alto Muy alto Localidades marginadas # Alta marginación
\ Muy alta marginación
Marginalization inside a State, by Municipality looking at Localities (Querétaro State)
Degree of Marginalization by Locality Very Low Low Medium High
20
In the case of OPORTUNIDADES social program, they use both region marginalization and a poverty index based on socioeconomic characteristics. One single index may not provide us with all the information we need to take a policy decision, but they are complements.
5. Conclusions
In this work we have described six different indexes to measure poverty or deprivation in Mexico, five official measures and one proposed by the author. We compare them and see that income, education, social security (including access to health services) and services in the household are the dimensions most of the time taken into account to build the indexes. This is relevant because even though the present analysis was performed for Mexico, the appendix B includes multidimensional indexes that rule in the world and they use the same dimensions.
When we compare the different measures, they all have the same increasing tendency since 2005, poverty in Mexico is increasing measured with 4 different measures at national levels, and only the marginalization index shows some improvement in the last 20 years. This doesn’t mean that we need just one measure to be used as a general rule, and that some of the measures can be complementary.
We placed an example using the marginalization index at different geographical levels, which shows the importance that future of other measures can be calculated at national, State and Municipality level at least, and this would be complemented with measures where the unit of measurement is the person, like the multidimensional index of poverty. In conclusion it is always important to consider different measures to assess a policy maker, but these measures
Indicators 2008 2010 2012 2008 2010 2012
Deprivation indicators
Educational lag 21.9 20.7 19.2 20.4 19.5 17.5
Lack of access to health services 38.4 29.2 21.5 26.8 22.1 15.5
Lack of access to social security 65.0 60.7 61.2 57.7 60.6 56.7
Lack of access to good quality housing spaces 17.7 15.2 13.6 11.9 9.9 10.9
Lack of access to basic housing services (water, electricity)19.2 16.4 15.0 12.8 13.5 9.0
Lack of food security 21.7 24.8 23.3 17.9 21.3 19.8
Source: Authors own using CONEVAL using MCS-ENIGH 2008, 2010 and 2012.
Multidimensional Poverty in Mexico
21
should be comparable in time. For future work we will be assessing and summarizing the surveys used to calculate this measure.
Bibliography
Alkire, S., & Foster, J. (2011). Counting and multidimensional poverty measurement. Journal of
Public Economics, 95(7–8), 476-487. doi: http://dx.doi.org/10.1016/j.jpubeco.2010.11.006
CONAPO-PROGRESA. (1998). Índices de marginación 1995. Retrieved from
http://www.conapo.gob.mx/es/CONAPO/Indices_marginacion_1995.
CONEVAL. (2007). Los mapas de Pobreza en México:Anexo técnico metodológico. Consejo
Nacional de Evaluación de la Política Social Retrieved from www.coneval.gob.mx.
CONEVAL. (2009). Metodología para la medición multidimensional de la pobreza en México. CONEVAL. (2011). Índice de la Tendencia de Laboral de la Pobreza (ITLP ). Consejo Nacional de
Evaluación de la Política de Desarrollo Social: Retrieved from
http://web.coneval.gob.mx/Paginas/principal.aspx.
Hernandez, D., & Orozco, M. (2002). Concentración de hogares en pobreza en el medio urbano. Mexico: SEDESOL.
Hernández Franco, D., Orozco Corona, M., & Vázquez Báez, S. (2008). Métodos de focalización en la política social en México
Un estudio comparativo. Economía Mexicana, Nueva Época, XVII(1), 36.
Jusidman, C. (2009). Desigualdad y Política Social en México. Nueva Sociedad, 220.
Ortega Díaz, A. (2013). Defining a Multidimensional Index of Decent Work for México. The Mexican
Journal of Economics and Finance, 8(1).
Ortega-Díaz, A., & Székely, M. (2014). Pobreza Alimentaria y Desarrollo en México. El Trimestre
Económico, LXXXI(321), 43-105.
Ortega-Díaz, A., & Vilalta, C. (2012). The Challenge of Inequality and Poverty. In T. d. Monterrey (Ed.), Building a Future for Mexico (Vol. 1). Mexico: Tecnológico de Monterrey.
SEDESOL. (2002). Comité Técnico para la Medición de la Pobreza (2002), Variantes Metodológicas
22
25
Appendix B. Leading papers in Multidimensional Poverty
Title Authors Countries Weights Dimensions
Acute Multidimensional Poverty: A New Index for Developing Countries Sabina Alkira Emma Santos Developing countries Years of schooling 16.7% Child enrolment 16.7% Mortality 16.7% Nutrition 16.7% Electricity 5.6% Sanitation 5.6% Water 5.6% Floor Coal 5.6% Assets 5.6%
*The model has three
dimensions with ten indicators
Education Health Living standard
Years of Schooling No household member has completed five years of schooling MDG2 Child Enrolment Any school-aged child is not attending school in years 1 to 8 MDG2 Mortality Any child has died in the family MDG4 Nutrition Any adult or child for whom there is nutritional information is malnourished MDG1 Electricity The household has no electricity MDG7 Sanitation The household ́s sanitation facility is not improved (according to the MDG guidelines), or it is improved but shared with other households MDG7 Water The household does not have access to clean drinking water (according to the MDG guidelines) or clean water is more than 30 minutes walking from home. MDG7 Floor The household has dirt, sand or dung floor MDG7 Cooking fuel The household cooks with dung, wood or charcoal. MDG7 Assets The household does not own more than one of: radio, TV, telephone, bike, or motorbike, and do not own a car or tractor MDG7 Multidimensional Measurement of Poverty in Sub-Saharan Africa Yélé Maweki Batana Ghana y Senegal (entre otros)
Equal weight for each dimension (1). In the cases of assets, weight (1) is dividing into the 8 indicators. *Women are the
unit f analysis Empowerment Measured by the latitude a woman has to decide on her visits to family and relatives. It seems reasonable to consider that a woman is deprived if she has no say regarding her Assets Ownership of durable goods (radio, television, bicycle, motorcycle, car, refrigerator, etc.) Access to services (electricity, phone, Schooling Single years attendance (MDG) Health Measured by BMI (Based on WHO)
26 visits to family and relatives. quality of floor, drinking water- MDG, sanitation -MDG) Income and beyond: Multidimensional poverty in six Latin American countries Diego Battiston, Guillermo Cruces, Luis Felipe López Calva, Maria Ana Lugo, María Emma Santos. México Brasil Chile (entre otros) Equal weight would count dimensions twice (e.g. child education and education of the household refer to education) Weighting structure based on Mexico’s index. Results: Income 2.4 Sanitation 0.3 Water 0.6 Shelter 0.3 Child attendance 1.8 Education HH 0.6 Income World Bank’s poverty line (2USD per capita per day). Considered to be conservative, but it allows comparability in all countries. Sanitation Flush toilet or pit latrine. Water Having access to running water in dwelling Shelter Having a shelter with no precarious wall materials Child attendance at school All children between 7 and 15 year-old are required to go to school. Households with no children are considered no deprived in this dimension. Education of the household Threshold set at 5 years of education. Measuring Multidimensional Poverty in India: A New Proposal Sabina Alkire and Suman Seth
India Equal weights (illustrative purposes) Since two dimensions have two indicators: living standard, sanitation/water, fuel, assets, education, livelihood, electricity, child status and empowerment receive equal weights of 11/9. Housing, electricity, sanitation, and water are Living standard The indicators used to measure this dimension are the type of house and access to electricity. A household is deprived in terms of housing if the household lives in a kachha house. A household is deprived of Health The minimum BMI of the women in the household is less than 18.5 Kg/m2. Water and sanitation A household is classified as deprived in terms of access to safe drinking water supply if the sources of water are an unprotected well and spring, river, dam, Air quality The household is considered deprived if he/she does not have a separate room used as a kitchen and the sources of fuel are coal, lignite, charcoal, wood, straw/shrubs/grass, agricultural crop, animal dung, and other. Assets Owns any one of the following assets: a b/w television, an electric fan, a pressure cooker, or a radio. At the same time, does not own any of the following assets: a refrigerator, Education Maximum year of education completed by any member is less than five years. Livelihood The respondent and her partner both fall into the following occupation categories: unemployed, agricultural labourer, plantation labourers, simply labourers, and new workers seeking jobs. Child status There is at least one incidence of child labour and/or at least one child aged 5–14 does not attend school. Women’s empowerment If any woman in the household does not have right to go alone in the market, health facility, and somewhere outside of village .
27
provided nested weights of 11/18 each.
electricity if it does not have access to electricity. lake, ponds, stream, tanker truck, cart with small tank, bottled water, other. A household is classified as deprived in the sanitation dimension if the household uses one of the following: pit latrine without slab, no facility/uses bush/field, composting toilet, dry toilet, other. a motorcycle, a car, a phone, a mattress, a table, a colour TV, a computer, a thresher, or a tractor. Multidimensional Poverty in Mexico María del Rosario Cárdenas Elizalde Fernando Alberto Cortés Cáceres Agustín Escobar Latapí Salomón Nahmad Sittón John Scott Andretta Graciela María Teruel Belismelis Mexico
*The model has two spaces: Economics Wellbeing and Social Rights, each of them with several indicators. *The methodology is based in Alkire and Santos (2007). Income There are two income lines: wellbeing and minimum wellbeing. The second refers to people that even when spending all their income cannot buy the good to have an adequate nutrition. Educational lag. A person aged 3 to 15 years old is in educational lag when he/she has no compulsory basic education, and do not attend a formal educational center. Or when a Access to health services. Do not have access to health services in any institution including “Seguro Popular”, public institutions (IMSS, ISSSTE Federal or State, Pemex, Ejército o Access to Social Services. Any formal remunerated person that by article 2° of the Labour Law or equivalent legislation, and a person by law that is covered by him/her. Quality and Space in the Household. Dirth floor. Carton, lit of waste material Ceiling Palm, bamboó, lit, carton, or similar walls. The ratio persons by room are higher 2.5. Access to basic services in the household. The water comes from a lake, river, pipe truck, or carrying buckets. There is no sewage neither connection to the potable water system. , Access to food. Food security index Social cohesion Gini coefficient of income
28
Source: Authors´s own using different articles.
*The document explains how to construct each indicator, but do not report the results. person born before 1982 and has no the compulsory educational level at that time (primary mainly). Or when a person was born after 1982 and has no the compulsory educational level at that time (secondary mainly). Marina) or private services. Don’t have electricity. Use of Wood or carbon as fuel to cook.
21
NOPOOR