The Bank Lending Channel Asymmetry and the Efficiency of
the Polish Interest Rate Monetary Policy During Transition
Rafał Kierzenkowski
1* CREFED-CERPEM, Paris IX Dauphine UniversityFebruary 2002
Abstract
We study the impact of interactions between the bank lending channel and the traditional interest rate channel on the efficiency of the monetary policy transmission in Poland since 1994. First, we develop a small open-economy credit-augmented model with an interest rate control, flexible prices, imperfect capital mobility and nominal wage indexation. Under two different exchange rate arrangements, namely a fixed rate regime with sterilized intervention and a pure floating rate regime, we establish that the bank lending channel may amplify but also attenuate the impact of monetary policy shocks on output, prices and the real exchange rate as compared to the standard interest rate channel. The variations in the interest rate spread between the loan rate and the central bank’s intervention rate are found to be a good indicator when distinguishing between amplification and attenuation effects of monetary policy shocks, provided that there is a positive relationship between both rates. Second, using the interest rate spread indicator, we find attenuation effects of monetary policy impulses from the beginning of 1996 to mid-1998, and on average a neutral effect of the bank lending channel from mid-1998 to June 2001.
JEL Classification: P20, F41, E51, E52
Keywords: Monetary policy, Bank lending channel, Economic transition
1 This is a revised version of a paper presented at the CEPR Transition Economics Workshop for Young Academics,
Portorož, Slovenia, 26th June-5th July 2001. I am grateful to László Halpern, Hartmut Lehmann, Janez Prasnikar, Gérard Roland, Mark Schaffer, Àdàm Szeidl, Grzegorz Trojanowski, and many other participants at the Workshop for helpful comments. I would like also to thank Anton Brender for guidance and Jérôme de Boyer des Roches, Balázs Ègert, Olivier Grosse, Hélène Lenoble-Liaud, Joël Métais, Jean-Marie Renaud and Jérôme Sgard for useful suggestions. Finally, many thanks go to people from the National Bank of Poland who helped me in obtaining the time series used in this paper: Jakub Borowski, Michał Brzoza-Brzezina, Norbert Cie´sla, Marta Gołajewska, Paulina Krzysztofik, Małgorzata Pawłowska, Zbigniew Pola´nski and Paweł Wycza´nski. The standard disclaimer applies. Comments are welcome.
Introduction
It is widely accepted that monetary policy actions conveyed through various interrelated transmission channels have a significant impact on real economic activity (at least in the short run) and inflation. There is also a broad consensus that more than a decade after the beginning of transition, the Polish capital markets are still fairly shallow as compared to international standards and the financial system is principally a bank-oriented one. These stylized facts motivate our study since we seek to explain the role played by the banking sector in the transmission mechanism of monetary policy in Poland from 1994 to mid-2001. More specifically, we investigate the impact of interactions between the bank lending channel and the traditional interest rate (or money) channel within an open economy framework. The difficulties of the authorities’ control over credit activity prove that the Polish banking sector is a key element in the understanding of the efficiency of monetary policy actions during the 1990s (Pola´nski, 1998; Brzoza-Brzezina, 2000).
Based on the Bernanke and Blinder’s (1988a,b) seminal model of the transmission mechanism, the main result presented in the literature states that the bank lending channel generates an amplification of monetary policy actions when compared to the traditional interest rate channel. The existence of an imperfect substitutability between bonds and loans on the asset side of the banking sector and on the liability side of firms makes monetary policy more restrictive (expansionary) due to a reduction (increase) in the loan supply by the banking sector to “bank-dependent” borrowers2. The variations in
both the spread between loan and bond interest rates and the credit supply summarize the amplifying nature of the bank lending channel: the interest rate spread increases (decreases) and the supply of credit decreases (increases) in the event of a restrictive (expansionary) monetary policy (Bernanke, 1993).
Following Dale and Haldane (1993,1998) and using the Bernanke and Blinder’s (1988a,b) model, Kierzenkowski (2001) demonstrates that the bank lending channel can either amplify or attenuate the effects of the traditional interest rate channel, since the systematic amplification result is in fact conditioned by several special assumptions (see Bernanke and Blinder (1988a) for their detailed exposition). The attenuation corresponds to a situation where the impact of monetary shocks on output is smaller than in the standard IS/LM model. This work also establishes that, as a general rule, after a monetary policy shock the direction of change in the spread between loan and bond interest rates is a good indicator of the asymmetric feature of the bank lending channel. Following a monetary tightening (expansion) there is an increase (decrease) in the interest rate spread in the event of amplification effects and a decrease (increase) when monetary policy shocks are attenuated.
However, these testable implications cannot be used for empirical investigations in Poland since Polish monetary authorities use an interest rate target monetary policy and not, as assumed in the model, a base money one. More generally, we study the impact of an interest rate control within a Bernanke and Blinder’s (1988a,b) framework that we extend in several ways. We consider a small open-economy credit-augmented model with flexible prices, an imperfect nominal wage indexation and capital mobility under two different exchange rate regimes: a fixed rate with sterilized intervention and a floating rate. Within this framework, we derive the theoretical assumption that must be met in order to use the variations in the interest rate spread between the loan rate and the central bank’s intervention rate as a valuable indicator of the bank lending channel asymmetry.
The paper is organized as follows. The first section provides a bird’s eye view on Polish monetary policy during the 1990s. In the second section, we develop the theoretical credit-augmented model. Finally, in the third section, we use the testable implications of the model to investigate the efficiency of the transmission mechanism from February 1994 to June 2001.
1 An Overview of the Polish Monetary Policy in the 1990s
1.1 The Main Goals of Monetary Authorities
The monetary policy during the 1990s aimed to achieve several goals, but this task proved to be difficult because of constant changes in the national and international environments.
The primary goal was to carry out a lasting disinflation process in order to converge to an inflation level comparable to those prevailing in the European Union countries. This objective was fulfilled even though the disinflation path was rather slow. The main instrument of monetary policy used for this purpose was the interest rate policy.
The weakness of Polish exporters’ competitiveness was the second authorities’ concern. Thus, they acted in order to control the volatility of the nominal exchange rate and to curb the appreciation of the real exchange rate. Different types of fixed exchange rate policies implemented since 1990 played a major role in this respect. However, the growing commercial and financial integration of Poland considerably increased the cost of these policies, implying huge and costly sterilization operations, particularly since 1995.
Finally, in order to stimulate national currency savings, special attention was given to guarantee positive real interest rates in zlotys’ denominated deposits.
1.2 The Monetary Policy Trade-offs
Until 1994, the disinflation and pro-exporters’ policies did not encounter major external constraints. Yet, the problem of their consistency emerged. A fixed exchange rate system against the US dollar was in force between January 1990 and May 1991. It acted as a nominal anchor for inflation while producing a strong real appreciation, which turned the trade surplus in 1990 into a deficit in 1991. After a 14.4 per cent devaluation of the zloty against the US dollar, and a brief period of fixed exchange rate against a currency basket, Poland adopted a pre-announced crawling-peg regime in October 1991. This mechanism was designed to offset the inflation differential between Poland and its main commercial partners. The zloty was devaluated on a daily basis against a basket of currencies with a publicly known monthly rate. The devaluation rate was reduced each time the registered inflation was lower. However, in order to limit the pro-inflationary characteristics of this mechanism, the initially fixed devaluation rate was lower than the inflation rate (Pola´nski, 1999). This led to an appreciation of the real exchange rate, and consequently to a fall in exports, pushing the authorities to conduct two separate devaluations against the basket: 8 per cent in February 1992 and 12 per cent in July 1993.
Figure 1. Basket Exchange Rates, V/95 - VIII/00
Composition of the basket prior to 1999: 45 per cent USD, 35 per cent DEM, 10 per cent GBP, 5 per cent FRF and 5 per cent CHF. Since 1.01.1999: 55 per cent EUR , 45 per cent USD.
Source: National Bank of Poland.
1994 was a transitory year, characterized both by capital inflows and a rise in the central bank’s gross official reserves. There were several factors that announced their escalations (Pola´nski, 1998). First, between 1991 and 1993, most long-term and partial short-term (e.g. resulting from T-bill transactions) capital flows were liberalized. Second, privatization of firms occurred with an increased involvement of foreign investors. Third, the agreements signed for foreign debt rescheduling with both the Paris and London Club creditors (respectively in 1991 and 1994) and positive growth prospects led
several rating agencies to give positive marks to Poland, enabling the country’s return to international capital markets. More importantly, the co-existence of a pre-announced crawling-peg exchange rate regime, and a policy of high interest rates (see Figure 4), both acted as magnets for short capital inflows in search of high return with relatively low risk, especially after the December 1994 Mexican financial crisis.
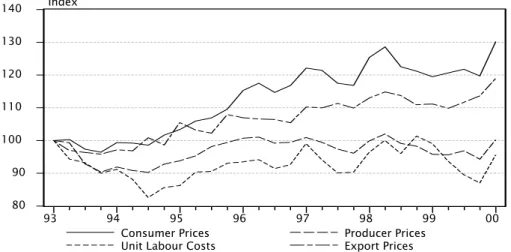
Figure 2. Real Effective Exchange Rate of the Zloty (December 1993=100), Q1/93 - Q1/00
80 90 100 110 120 130 140 93 94 95 96 97 98 99 00 Consumer Prices
Unit Labour Costs Producer PricesExport Prices Index
Source: National Bank of Poland.
In 1995, the stock of gross official reserves increased from 6 to 15 USD billion (see Figure 3). Two factors were behind this huge foreign assets growth. First, although the official trade balance was in deficit, the existing price differential between Poland and its neighbours produced a strong increase of unregistered foreign trade which, included in the current account statistics, yielded a 5.5 USD billion surplus. Second, for the aforementioned reasons, there were long-term and short-term capital inflows. Throughout 1995, in order to counter appreciating pressures and defend the crawling-peg mechanism, the National Bank of Poland (hereafter NBP) carried out interventions on the foreign exchange market that it subsequently sterilized. In the perspective of future debt repayment, the increase of gross official reserves was initially welcomed by monetary authorities (Durjasz and Kokoszczy´nski, 1999). Nevertheless, in mid-May 1995 the central bank introduced a pre-announced crawling-band mechanism with a +/−7 per cent exchange rate band around the central parity rate. The essence of the crawling-peg mechanism was preserved but the introduction of the band aimed to increase the risk of foreign portfolio investments. Moreover, in order to break the appreciation anticipations, the authorities made a 6 per cent appreciation of the exchange rate (in December 1995) and reduced the rate of crawl to 1 per cent on a monthly basis (in January 1996).
In the 1996-1998 period, the gross official reserves accumulation and the appreciation pressures on the exchange rate continued as capital inflows overfinanced the increasing deficit of the current
account. Short-term capital inflows were particularly huge in 1997 amounting to 2.1 USD billion. This resulted from the interest rate differential between Polish and foreign interest rates (see Figure 4), but also from an almost absent exchange risk that lasted until the end of 1997. As shown in Figure 1, the central bank continued its interventions on the foreign exchange market by closely controlling the nominal exchange rate in a much narrower corridor than the official band. By this method, it was slowing down the appreciation of the real exchange rate (see Figure 2). However, the monetary authorities had to sterilize the impact of their interventions afterwards by using open-market operations. Were the opposite to occur, there was the potential risk that the increase in the base money would subsequently lead to a decrease in market interest rates. This would have included T-bills, lending and deposit rates and would have undermined the disinflation interest rate policy. Therefore, every rise in gross official reserves was followed by an increased scale of open-market operations for a given interest rate. The withdrawals of liquidity were conducted primarily with 1 to 14-days reverse repo operations, with the central bank’s securities issued for different maturities in the 1994-1997 period, and with the 28-days NBP’s securities since then. They created a situation of net indebtedness of the central bank towards commercial banks.
Figure 3. Gross Official Reserves and End-of-Year Profit of the NBP in USD Million, I/93 - VI/01
0 5000 10000 15000 20000 25000 30000 93 94 95 96 97 98 99 00 01
Gross Official R eserves
0 200 400 600 800 1000 1200 1400 P rofit
Gross Official R eserves E nd-of-Year P rofit
Source: National Bank of Poland.
In December 1998, the scale of overliquidity of commercial banks absorbed in open-market operations and in mandatory reserves amounted to 13.6 USD billion, approximately 14.2 per cent of the total assets of the commercial bank sector (NBP, 1998). The cost of sterilization operations ranged between 1-1.5 per cent of GDP in 1995-1997 according to Nuti (2000) and were of the order of 0.7-0.8 per cent of GDP between 1997 and 1998 according to Rosati (1999). This led to an exhaustion of the NBP’s profit (see Figure 3) and required a gradual evolution towards a flexible exchange rate system. Exchange rate bands were progressively widened to 10, 12.5, and finally 15 per cent. Above all, the
NBP ceased its direct interventions on the foreign exchange market since the end of July 1998, and its indirect interventions by abolishing fixing transactions starting in June 1999 (Pola´nski, 2000). This move eliminated the main source of overliquidity in the banking system. Finally, a floating exchange rate system was adopted in April 2000.
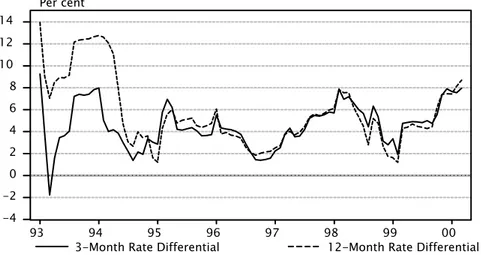
Figure 4. Relationship of Polish and Foreign Interest Rates, I/93 - III/00
-4 -2 0 2 4 6 8 10 12 14 93 94 95 96 97 98 99 00
3-Month Rate Differential 12-Month Rate Differential Per cent
3 (12)-Month Rate Differential = 3 (12)-Month Polish Treasury bill rate−3 (12)-weighted average foreign rate−crawling peg devaluation, weighted average foreign rate = weighted average of interbank interest rates of zloty basket currencies.
Source: National Bank of Poland, Datastream and own calculations.
2 A Simple Small Open-Economy Model of the Bank Lending Channel
2.1 General Assumptions
In the closed-economy model developed by Bernanke and Blinder (1988a,b) monetary policy is characterized in terms of the authorities’ control over banking reserves, assuming fixed prices. We extend this framework in several ways.
First, in a perfectly deterministic environment without any stochastic disturbances, we invert the policy rule, modelling the central bank as operating on interest rates rather than controlling the base money. The interest rate control assumption reflects the actual conduct of monetary policy in Poland since 1994. According to Osi´nski (1995, 1999) and Sławi´nski and Osi´nski (1997,1998), the NBP was setting a 1-day reverse repo interest rate (and more generally was controlling the short-term WIBOR T/N interest rate3) in the 1994-1995 period, while during the 1996-1997 period the main interest rate
instrument was a 14-days reverse repo rate. Since February 1998, the Monetary Policy Council sets the minimum yield on 28-days NBP’s securities. For the period under study (February 1994 - June
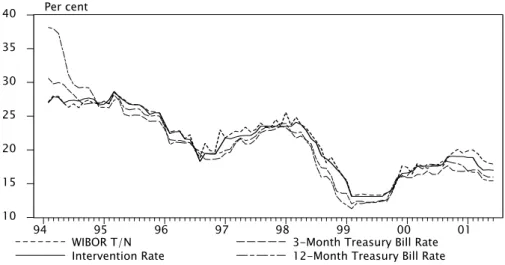
2001), these interest rates were used in open-market operations in order to mop up the excess liquidity of the banking system created by a combination of strong capital inflows and fixed exchange rate policies followed near the end of the 1990s. We calculated a single intervention rate of the NBP as a weighted average of 1 to 14-days reverse repo operation rates and that of the central bank securities issued for different maturities between February 1994 and January 1998 and, since then equal to the actual rate on 28-days NBP bills4. As it appears in Figure 5, our indicator of monetary policy stance
is almost equal to WIBOR T/N and, since at least August 1994, is very close to the yield of 3-month and 1-year Treasury bills on the primary market.
Figure 5. Intervention, WIBOR T/N and Treasury Bill Interest Rates, II/94 - VI/01
10 15 20 25 30 35 40 94 95 96 97 98 99 00 01 WIBOR T/N
Intervention Rate 3-Month Treasury Bill Rate12-Month Treasury Bill Rate Per cent
Source: National Bank of Poland and own calculations.
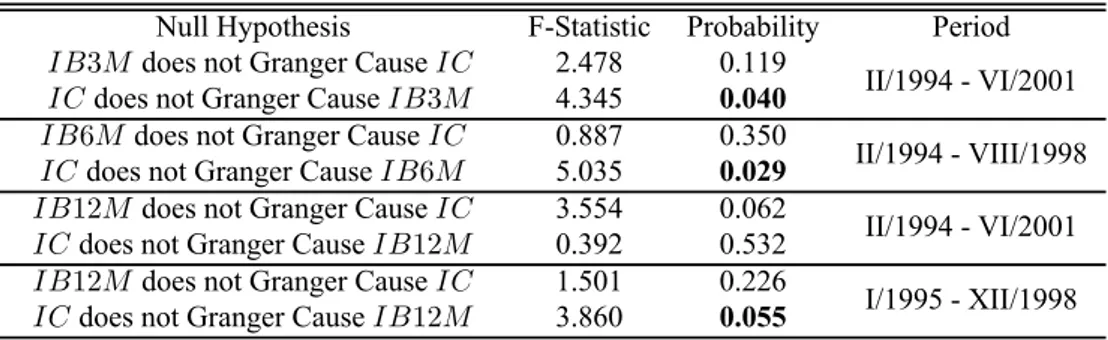
An indicator of monetary policy stance comparable to ours is used by Kokoszczy´nski (1999). Moreover, similarly to Kokoszczy´nski (1999), we find a significant impact of our indicator on Treasury bill interest rates. More precisely, as shown in Table 1, the intervention rate (IC) Granger caused the 3-month Treasury bill interest rate (IB3M) for the entire period under consideration, the 6-month interest rate (IB6M) in the February 1994 - August 1998 period5but failed to affect the 12-month rate
(IB12M). However, in the latter case, the expected relationship still occurred for a shorter period of time. On the whole, by controlling its intervention rate, the central bank exerts an important influence on the market interest rates. Given these different observations, we assume, for the sake of simplicity, that the bond interest rate of the model6and the yield of NBP’s securities, i.e. the intervention rate, are
perfect substitutes (hence both are equal). Presenting the model, we use both terms interchangeably. Second, we model two exchange rate regimes in order to take into account the heterogeneity of the
4 The indicator also includes the average rate of outright operations, which were systematically used
since September 2000 and seldom before that date.
5 Due to breaks in data since August 1998, the test could not be made for the entire period.
6 Empirically, Bernanke and Blinder (1988a,b) use the 3-month Treasury bill interest rate as a proxy
Table 1.Granger Causality Tests
Null Hypothesis F-Statistic Probability Period IB3M does not Granger Cause IC
IC does not Granger Cause IB3M
2.478 4.345
0.119
0.040 II/1994 - VI/2001
IB6M does not Granger Cause IC ICdoes not Granger Cause IB6M
0.887 5.035
0.350
0.029 II/1994 - VIII/1998
IB12M does not Granger Cause IC ICdoes not Granger Cause IB12M
3.554 0.392
0.062
0.532 II/1994 - VI/2001 IB12M does not Granger Cause IC
ICdoes not Granger Cause IB12M
1.501 3.860
0.226
0.055 I/1995 - XII/1998
As in Kokoszczy´nski (1999), we used one lag nominal variables in first differences.
period under study. A fixed rate regime with sterilized intervention aims to reflect, at least partially, the period ranging from 1994 to June 1999 and characterized by capital inflows and sterilization operations under the crawling-peg and, since May 1995, the crawling-band exchange rate regimes. The second regime under study is a pure float, that Poland officially adopted since April 2000 but existed in practice as from June 1999, date at which the central bank stopped its indirect interventions on the foreign exchange market.
Third, we assume that the prices of goods are perfectly flexible but there is an imperfect indexation of nominal wages to the price level. As a consequence, a monetary policy shock will act on both output and prices. It should be noted, however, that if the central bank is setting the nominal interest rate, and prices of goods and nominal wages are simultaneously perfectly flexible, the price level and the nominal exchange rate under the flexible rate regime are indeterminate7.
Fourth, as is standard in the literature, we introduce in the aggregate-demand-and-supply framework (hereafter AD/AS) a bank lending channel working over and above the interest rate channel by assuming that bonds and loans are imperfect substitutes. Therefore, there is a clear distinction between both assets. Hence, following a monetary tightening, banks cannot offset a decline in deposits by simply adjusting their bond holdings and keeping their loan supply unaffected. Similarly, firms cannot offset a decrease in loan supply by simply increasing their bond issue without incurring higher costs.
Finally, as the methodology employed in the model is comparative statics, the expected exchange rate and inflation rate are assumed fixed and omitted. Foreign country variables are marked with an asterisk.
The characteristics of different markets are as follows.
The loan supply is deduced from the following simplified banks’ balance sheet (which ignores net
7 The result of price level indeterminacy of the nominal interest rate instrument in a closed-economy
worth):
Rb+ Bb+ Ls= Ds,
with assets: nominal reserves, Rb; nominal bonds, Bb; nominal loans, Ls; and liabilities: nominal deposits, Ds. Since reserves consist only of required reserves, i.e. Rb = τ Ds, where τ denotes the reserve requirement coefficient, the banks’ adding-up constraint is:
Bb+ Ls = (1− τ)Ds.
Assuming that the desired structure of banks’ portfolio is a function of rates of return on loans and bonds, the loan supply is:
Ls = Γ(Il, Ib)Ds(1− τ) with: ΓIl > 0, ΓIb < 0, (1)
where Γ is the proportion of deposits out of required reserves that banks wish to hold under credit form. The loan supply is an increasing function of the loan interest rate. This means that the price of loans is perfectly flexible and clears the loan market. Due to the substitution effect, it is a decreasing function of the bond interest rate. In order to simplify our expressions we write hereafter each variable as a deviation around the steady state: we write, for instance for an X variable, x as a deviation in percentage (or in logarithm):
x = log X X0 '
X− X0 X0
.
Therefore, for a given reserve requirement coefficient, the linear form of the loan supply function (1) is:
ls = γlil− γbib+ ds, (2) with γl and γb standing for the loan interest rate and the bond interest rate elasticities of loan supply respectively. In the credit market, borrowers choose between loans and bonds according to the interest rates on the two instruments. The nominal loan demand is:
ld= p− λlil+ λbib+ λyy, (3) with λl, λb and λy denoting the loan interest rate, the bond interest rate and the income elasticities of loan demand respectively, y the real output and p the price of output. The positive dependence on income captures the transactions demand for credit which might arise from working capital or liquidity considerations.
We ignore cash and we do not model the deposit supply while assuming that it is determined by shocks to deposit demand. Hence, the nominal supply of deposits is equal, for a given reserve requirement ratio, to bank reserves rb:
ds = rb. (4)
The nominal demand for deposits dddepends positively on the real income and negatively on the bond interest rate:
where βb and βy are the bond interest rate and the income elasticities of deposit demand respectively. As in Dibooglu and Kutan (2001) we assume an imperfect capital mobility, hence the equation of the overall balance of payments is written as:
b≡ −zy + ρ(e + p∗− p) + k(ic− i∗c), (6) with e the nominal exchange rate expressed as the domestic currency price per unit of foreign currency, zthe imports elasticity of output demand, p∗the price of foreign output and i∗
cthe foreign interest rate. The current account is determined by the level of output at home in relation to output abroad (assumed fixed and hence omitted) and the real exchange rate. The positive coefficient on the real exchange rate assumes that the Marshall-Lerner-Robinson condition holds. The capital account is determined by the home interest rate in relation to the interest rate abroad. The parameter k represents the degree of capital mobility and large values of k indicate higher levels of capital mobility. In case of a purely flexible exchange rate regime the balance of payments converges towards zero in equilibrium (b = 0) because by definition there is no foreign exchange intervention. However, in a fixed exchange rate regime with sterilized intervention, b = rc where rc is the amount of international reserves needed to clear the foreign exchange market. To illustrate what is meant by sterilization policy, consider the following simplified balance sheet of the central bank:
rc+ bg = rb+ bc,
with bg government bonds and bc central bank securities, meaning there is net indebtedness of the central bank towards commercial banks. As will be shown hereafter, a monetary tightening leads to an increase in international reserves and to a decrease in output, in prices and hence, given (4) and (5), to an endogenous decrease in banking reserves. We consider that the central bank completely neutralizes the effects that its intervention in the foreign exchange market has on the monetary base. Therefore, sterilization operations imply an increase in bc such that dbc = drc− drb or, alternatively, monetary authorities can proceed to an outright sale of government bonds (i.e. to a decrease in bg such that dbg = drb − drc). In practice, the second possibility was seldom used by Polish monetary authorities. With foreign income and consumption exogenous, the real net demand for domestic goods is given by:
y =−θlil− θbib − zy + ρ(e + p∗− p), (7) with θl, θb and z the loan interest rate, the bond interest rate and the imports elasticities of output demand respectively.
In accordance with Walras’s law, we do not need to consider the bond market. The aggregate supply function is derived from the following four equations:
p = w− a + (1 − α)n, (9)
w = σpc with: σ ∈ [0; 1[, (10)
pc = χp + (1− χ)(e + p∗), (11)
with n labor, w wages, a total labor productivity, pc the consumer price index and σ measuring the degree of nominal rigidities in the labor market. Equation (8) is a production function, (9) is a price setting equation issued from the profit maximization condition in a perfect competition framework, (10) is a wage setting equation and (11) defines the consumer price index as a weighted average of the price of home goods and the price of imported goods. We assume an influence of price variations on real wages due to an imperfect adjustment of nominal wages: σ < 1. The bigger the nominal rigidities are, the smaller σ is. Using (8), (9), (10) and (11) the aggregate supply curve can be written as:
y = κ0+ κ1p− κ2e with: κ0 = a− ασ(1 − σχ)p∗ 1− α , κ1 = α(1− σχ) 1− α , κ2 = ασ(1− χ) 1− α . (12) Finally, given our assumption that the bond interest rate is equal to the intervention rate, i.e. ib = ic, the general equilibrium of the model is solved for (y, p, il, rb)and e (under a flexible rate regime) or rc (under a fixed rate regime with sterilized intervention) using the following system of five equations:
(IS) y =−θlil− θbic− zy + ρ(e + p∗− p), (LM) p + βyy− βbic= rb,
(BP) b ≡ −zy + ρ(e + p∗− p) + k(i
c− i∗c), (CR) p − λlil+ λbic+ λyy = γlil− γbic+ rb, (AS) y = κ0+ κ1p− κ2e.
(13)
2.2 Comparative Statics of an Interest Rate Monetary Shock in the Two Regimes
Let us first consider the fixed exchange rate regime with sterilized intervention. Using (13) with b = rc, the comparative statics of a monetary policy shock assimilated to a change in the intervention rate can be shown to take the following form:
µ dy dic ¶ sa = −κ1[θl(λb+ γb+ βb) + θb(λl+ γl)] ∆1 , (14) µ dp dic ¶ sa = −θl(λb+ γb+ βb) + θb(λl+ γl) ∆1 , (15) µ dil dic ¶ sa = θbκ1(βy− λy) + (λb+ γb+ βb) [ρ + κ1(z + 1)] ∆1 , (16) µ drc dic ¶ sa = (ρ + zκ1) [θl(λb+ γb+ βb) + θb(λl+ γl)] ∆1 + k, (17) µ drb dic ¶ sa = µ dp dic ¶ sa + βy µ dy dic ¶ sa − βb, (18) where: ∆1 = κ1θl(λy − βy) + (λl+ γl) [ρ + κ1(z + 1)] <> 0.
Let us now consider a pure floating exchange rate regime. Using (13) with b = 0 the comparative statics results of a monetary shock can be written as:
µ dy dic ¶ f a = −∆2 ∆3 , (19) µ dp dic ¶ f a = −∆2(ρ + zκ2) ∆3ρ(κ1− κ2) − kκ2 ρ(κ1− κ2) , (20) µ dil dic ¶ f a = (βy− λy)(θb + k) + λb+ γb+ βb ∆3 , (21) µ de dic ¶ f a = −∆2(ρ + zκ1) ∆3ρ(κ1− κ2) − kκ1 ρ(κ1− κ2) , (22) µ drb dic ¶ f a = µ dp dic ¶ f a + βy µ dy dic ¶ f a − βb, (23) where: ∆2 = θl(λb+ γb+ βb) + (λl+ γl)(θb+ k) > 0and ∆3 = θl(λy − βy) + λl+ γl <> 0. There is one theoretical ambiguity concerning these results, linked to the value of the income elasticity of deposit demand, βy, as compared to the income elasticity of loan demand, λy. If λy > βy then ∆1 > 0, ∆3 > 0and there are no ambiguities relating to the sign of all different multipliers in both regimes, except for the interest rate multipliers (16) and (21). If, instead, λy < βy then ∆1 <> 0, ∆3 <> 0and the sign of all multipliers in both regimes is undetermined.
Theoretically, we can solve these ambiguities directly by assuming that (16) and (21) are positive: µ dil dic ¶ sa > 0and µ dil dic ¶ f a > 0. (H1)
In this case, a rise in the intervention rate will lead to a decrease in output, in prices and in banking reserves in both regimes but also to an increase in international reserves in the fixed rate regime and to an appreciation of the nominal exchange rate in the floating rate regime.
Empirically, provided that the model and the corresponding regimes are a good description of the economy, all these ambiguities will not occur if a positive correlation is found between the intervention rate and the loan rate. In the next section, we present the empirical results indicating that the loan rate was an increasing function of the intervention rate in the period under consideration.
2.3 The Variations in the Interest Rate Spread as an Indicator of Amplification
and Attenuation Effects
In order to measure the impact of the bank lending channel we need to define a standard AD/AS model as a benchmark model. This is readily done by assuming perfect substitution between bank
credit and bonds. The above augmented model (13) then collapses to a model of the form: (IS) y = −(θl+ θb)ic− zy + ρ(e + p∗ − p), (LM) p + βyy− βbic= rb,
(BP) b ≡ −zy + ρ(e + p∗ − p) + k(i
c− i∗c), (AS) y = κ0+ κ1p− κ2e.
(24)
For the fixed exchange rate regime, the multipliers corresponding to the above model (24) (with b = rc) are: µ dy dic ¶ sm = − (θl+ θb)κ1 (1 + z)κ1+ ρ < 0, (25) µ dp dic ¶ sm = − θl+ θb (1 + z)κ1+ ρ < 0, (26) µ drc dic ¶ sm = (ρ + zκ1)(θl+ θb+ k) + kκ1 (1 + z)κ1+ ρ > 0, (27) µ drb dic ¶ sm = µ dp dic ¶ sm + βy µ dy dic ¶ sm − βb < 0. (28)
While under a pure float the comparative statics results of a monetary shock issued from (24) (with b = 0) can be written as:
µ dy dic ¶ f m = −(θl+ θb+ k) < 0, (29) µ dp dic ¶ f m = −(θl+ θb+ k)(ρ + zκ2) + kκ2 ρ(κ1− κ2) < 0, (30) µ de dic ¶ f m = −(θl+ θb+ k)(ρ + zκ1) + kκ1 ρ(κ1− κ2) < 0, (31) µ drb dic ¶ f m = µ dp dic ¶ f m + βy µ dy dic ¶ f m − βb < 0. (32)
We derive the conditions under which the bank lending channel amplifies or attenuates the impact of monetary policy shocks:
1) on output, prices and international reserves in the fixed rate regime with sterilized intervention, using the expressions (14), (25), (15), (26), (17) and (27);
2) on output, prices and the nominal exchange rate in the floating rate regime, using the expressions (19), (29), (20), (30), (22) and (31).
In the amplification case, the impact of monetary policy on the aforementioned variables in both regimes is higher in the augmented model compared to that in the standard AD/AS model. Solving these inequalities indicates that this situation corresponds to an increase (decrease) in the interest rate spread between the bank lending rate and the intervention rate in the case of a restrictive
(expansionary) monetary policy.
AMPLIFICATION
A fixed rate regime with sterilized intervention A flexible rate regime ³ dy dic ´ sa− ³ dy dic ´ sm < 0 ³ dp dic ´ sa− ³ dp dic ´ sm < 0 ³ drc dic ´ sa− ³ drc dic ´ sm> 0 ⇒³dil dic ´ sa> 1 ³ dy dic ´ f a− ³ dy dic ´ f m< 0 ³ dp dic ´ f a− ³ dp dic ´ f m< 0 ³ de dic ´ f a− ³ de dic ´ f m< 0 ⇒³dil dic ´ f a > 1
In the attenuation case, the impact of monetary policy on the aforementioned variables is smaller in the augmented model compared to that in the standard AD/AS model. Solving these inequalities indicates that this situation corresponds to a decrease (increase) in the interest rate spread between the bank lending rate and the intervention rate in the case of a restrictive (expansionary) monetary policy.
ATTENUATION
A fixed rate regime with sterilized intervention A flexible rate regime ³ dy dic ´ sa− ³ dy dic ´ sm > 0 ³ dp dic ´ sa− ³ dp dic ´ sm > 0 ³ drc dic ´ sa− ³ drc dic ´ sm< 0 ⇒³dil dic ´ sa< 1 ³ dy dic ´ f a− ³ dy dic ´ f m> 0 ³ dp dic ´ f a− ³ dp dic ´ f m> 0 ³ de dic ´ f a− ³ de dic ´ f m> 0 ⇒³dil dic ´ f a < 1
Finally, if the variations in different variables are exactly the same in both frameworks, then after a monetary shock we should observe an unchanged interest rate spread.
NEUTRALITY
A fixed rate regime with sterilized intervention A flexible rate regime ³ dy dic ´ sa− ³ dy dic ´ sm = 0 ³ dp dic ´ sa− ³ dp dic ´ sm = 0 ³ drc dic ´ sa− ³ drc dic ´ sm= 0 ⇒³dil dic ´ sa= 1 ³ dy dic ´ f a− ³ dy dic ´ f m= 0 ³ dp dic ´ f a− ³ dp dic ´ f m= 0 ³ de dic ´ f a− ³ de dic ´ f m= 0 ⇒³dil dic ´ f a = 1
Several additional comments can be made.
First, it follows from these results that the variations in the interest rate spread are also a good indicator when distinguishing between amplification and attenuation effects of monetary policy shocks on the real exchange rate in both regimes. For the floating rate regime, the explanation originates from the fact that the real exchange rate is an decreasing function of the intervention rate: since κ1 > κ2, there is a higher impact of a monetary shock on the nominal exchange rate than on prices in the augmented model (see (20) and (22)) as well as in the AD/AS model (see (30) and (31)).
Second, in the fixed exchange rate regime an amplified restrictive monetary policy shock leads to a stronger increase in international reserves and decrease in banking reserves and therefore to a higher volume of sterilization operations.
Third, a closer examination of (16) and (21) indicates that both interest rate multipliers are an increasing function of γb and λb, and a decreasing function of λland γl. Therefore, if ceteris paribus γl > γb, i.e. banks are more reactive in their credit decisions to loan interest rates as compared to monetary policy-led bond interest rates, then the response of loan rates to a change in the intervention rate will be smaller and the probability of attenuation effects will increase. The same outcome will arise if ceteris paribus λl > λb, i.e. firms are “bank-dependent” borrowers having a more difficult access to the bond market as compared to the loan market.
One should note that if the two main assumptions detailed in Bernanke and Blinder (1988a) apply, there will be a systematic amplification of monetary policy shocks in both regimes.
If λy = βy and if ½ γl= γb λl = λb ⇒ µ dil dic ¶ sa = µ dil dic ¶ f a > 1.
Fourth, Poland’s capital markets are fairly shallow: in March 2000, commercial bonds represented only 1.2 per cent and commercial papers only 5.8 per cent of total bank credit to enterprises (Łyziak, 2001). Hence, banks are almost the unique source of borrowed funds for the corporate sector. Moreover, according to the National Bank of Poland’s monthly surveys of companies, the share of firms using bank credit grew from approximately 80 per cent in 1995 to more than 85 per cent in 1999 (Łyziak, 2001). These stylized facts render attenuation effects more likely since they suggest that the value of λlshould be strong while that of λbclose to zero.
3 An Empirical Assessment of the Bank Lending Channel Asymmetry
3.1 Data Description and Pre-testing
We analyze monthly data of a sample that runs from February 1994 to June 2001 inclusive. We use 3-month, 6-month and 1-year minimum loan rates granted to Polish firms. The loan rates are weighted averages of interest rates applied by major banks, depending on the period (having gone from 20 banks in January 1994 to 12 in June 2001, the difference due to the consolidation process) and representing, on average for the period under consideration, 75.2 per cent of the banking system in terms of total credit extended to firms and 84.7 per cent in terms of total deposits. Recall that the intervention rate of the central bank is defined as a weighted average of 1 to 14-days reverse repo operation rates and that of the central bank securities issued for different maturities between February 1994 and January 1998, and is equal since then to the actual rate on 28-days NBP bills (also taking into account the average rate
of outright operations). These data are used to construct three different interest rate spreads defined as a difference between 3-month, 6-month and 1-year loan rates and the intervention rate of the central bank.
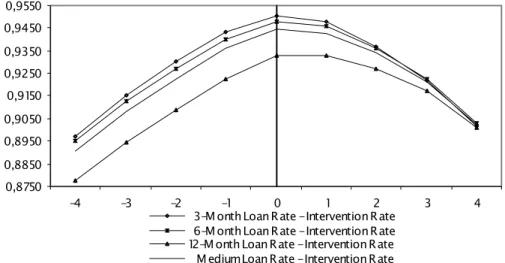
Before having a closer look at the operation of the bank lending channel in Poland, we seek to verify two elements. First, we need to find out whether the loan rates and the intervention rate move in the same direction. This is the (H1) theoretical assumption of the model that must hold in order to ensure that the change in the spread makes it possible to distinguish between attenuation and amplification effects. Second, it is necessary to check the transmission lag between the intervention rate and the loan interest rates. To this end, we use advanced and lagged correlations between the intervention rate and the loan rates. In Figure 6 are shown the correlation coefficients between the intervention rate at date t and the loan interest rates at date t + k. The left-hand side of the origin shows correlations between the current monetary policy rate and lagged loan interest rates whereas the right-hand side depicts correlations between the current monetary policy rate and the future loan rates.
Figure 6. Advanced and Lagged Correlations Between Loan and Intervention Rates, II/94 - II/01
0,8750 0,8850 0,8950 0,9050 0,9150 0,9250 0,9350 0,9450 0,9550 -4 -3 -2 -1 0 1 2 3 4
3-Month Loan Rate - Intervention Rate 6-Month Loan Rate - Intervention Rate 12-Month Loan Rate - Intervention Rate Medium Loan Rate - Intervention Rate
Source: National Bank of Poland and own calculations.
As we can see from Figure 6, there is a strong positive correlation between the intervention rate and all loan rates. Hence, the assumption (H1) of the model is satisfied.
Concerning the transmission lag, we notice that the maximum correlation is obtained for k = 0: this indicates an instant (within the month) pass-through of official interest rates to loan interest rates8. This
finding allows us to study the reaction of the spreads calculated between current loans and intervention rates to changes in the intervention rate (see Figure 7).
8 For the 12-month loan rate the correlations for k = 0 and k = 1 are almost identical, equal
3.2 Results
The visual inspection of Figure 7 shows that the period under study is not homogeneous. Recall that a scissors-like evolution of the spreads, as compared to the policy rate, indicates attenuation effects of monetary policy: the spreads decrease after a rise of the central bank’s rate and rise otherwise. On the other hand, a co-movement between the spreads and the intervention rate indicates amplification effects of monetary policy: the spreads go up after an increase in the central bank’s rate and diminish otherwise. Using this simple rule, we can distinguish three periods.
Figure 7. Nominal Intervention Rate and the Interest Rate Spreads, II/94 - VI/01
5 10 15 20 25 30 0 2 4 6 8 10 12 14 94 95 96 97 98 99 00 01 Intervention Rate
3-Month Spread 6-Month Spread12-Month Spread
Intervention Rate Spreads
Source: National Bank of Poland and own calculations.
According to Osi´nski (1999), in 1994-1995, the reverse repo rate was the most important policy instrument acting on banking interest rates. Our analysis shows possible amplification effects in April and May 1994 and from June to October 1995 because of the observed co-movement between the spreads and the policy rate. Yet, care should be taken when dealing with the first period. Indeed, the important decline in all spreads resulted probably rather from the structural overliquidity of the banking system which pushed down the yield of Treasury bills (see Figure 5) and subsequently the loan interest rates, than from an enhanced monetary policy effectiveness, although there was a reduction of the intervention rate in April and May 1994. There was also an intermediate, 8-month lasting period from October 1994 to May 1995 characterized on average by possible attenuation effects of monetary policy. However, the February 1994-December 1995 period must be analyzed with cautiousness since in several cases, the medium lending rate moved significantly in the opposite direction as compared to the intervention rate.
Beginning with January 1996 is a rather lengthy period, that lasted more than two years and a half, until August 1998, clearly indicating a reduced potency of monetary policy. Since December 1996, the central bank tried to curb the credit and demand expansion raising its intervention rate and the rate of required reserves. Since these measures did not yield the expected results on banks’ behaviour, the NBP undertook an unprecedented action. In September 1997, it began to accept 6- and 9-month deposits directly from the public at above market rates. The goal of this move was to force banks to substantially increase their deposit rates and, subsequently, their lending rates. Our analysis confirms the existence of a period of monetary policy weakness between December 1996 and April 1997.
The third and rather ambiguous period started in September 1998. First, we can depict several amplification episodes which occurred between September 1998 and January 1999 (except November 1998) and sporadically for example in December 1999, February 2000 and August 2000. However, banks were clearly reducing the impact of monetary shocks for example in February 1999, March and September 2000 and in the March-April 2001 period.
When using real ex post spreads and intervention rates, the analysis yields approximately similar although not identical results (see Figure 8). The reason for this is that given the evolution of the inflation rate, the real and nominal intervention rates did not necessarily move in the same direction. There are two major differences. Taking the real intervention rate, there was an amplification of the central bank’s impulses between September 1994 and February 1995 and the second period should have started at least six months earlier as compared to what is predicted by the nominal rate analysis.
Figure 8. Real Intervention Rate and the Interest Rate Spreads, II/94 - VI/01
-5 0 5 10 94 95 96 97 98 99 00 01 3-Month Spread
6-Month Spread 12-Month SpreadIntervention Rate Per cent
Deflator: Consumer Price Index.
Conclusion
In this paper we have developed an open-economy credit-augmented model of the transmission mechanism. The extensions include an interest rate control with flexible prices, an imperfect nominal wage indexation and capital mobility under two different exchange rate systems: a fixed rate regime with sterilized intervention and a pure floating rate regime. Our results appear to yield an important information for policymakers, eager to find out the desired level of monetary conditions. We established that in both exchange rate arrangements, the bank lending channel may amplify as well as attenuate the action of the traditional interest rate channel. We found that the change in the interest rate spread between a loan rate and a policy rate is a good indicator of the bank lending channel asymmetry since it allows to gauge the efficiency of monetary policy impulses. If the pass-through of official interest rates to loan rates is less (more) than one, this implies a weaker (stronger) impact on prices, output and the real exchange rate in both regimes and on central bank’s foreign reserves in the fixed rate regime: the bank lending channel will therefore reduce (increase) the strength of the traditional interest rate channel. An important explanatory factor of amplification and attenuation effects is the sensitivity of banks and firms to loan and market interest rates. Even though these results require a positive relationship between loan rates and the policy rate, this is a highly probable outcome. Our analysis shows that the bank lending channel was reducing the overall efficiency of monetary policy from January 1996 to August 1998 and had, on average, a neutral effect since then. This could indicate that the efficiency of monetary policy transmission increases as the transition process develops.
References
BERNANKE B.S., BLINDER A. (1988a), “Credit, Money, and Aggregate Demand”, NBER
Working Paper, N◦2534, March, 13 p.
BERNANKE B.S., BLINDER A. (1988b), “Credit, Money, and Aggregate Demand”, American
Economic Review Papers and Proceedings, Vol. 78, N◦2, May, pp. 435-439.
BERNANKE B.S. (1993), “Credit in the Macroeconomy”, Federal Reserve Bank of New York
Quarterly Review, Vol. 18, N◦1, Spring, pp. 50-70.
BRZOZA-BRZEZINA M. (2000), “Neutralno´s´c pieni ˛adza a badanie mechanizmów transmisji
monetarnej w Polsce”, (“Neutrality of money and the transmission of monetary policy in Poland”), Bank i Kredyt, N◦3, March, pp. 34-46.
DALE S., HALDANE A. (1993), “A simple Model of Money, Credit and Aggregate Demand”,
Bank of England Working Paper Series, N◦ 7, April, 28 p.
DALE S., HALDANE A. (1998), “Interest Rate Control in a Model of Monetary Policy”, The
Manchester School, Vol. 66, N◦3, June, pp. 354-375.
DIBOOGLU S., KUTAN A.M. (2001), “Sources of Inflation and Output Fluctuations in Poland
and Hungary: Implications for Full Membership in the European Union”, Working Paper, 36 p., http://www.siu.edu/~dibo/work/inf_transition.pdf
DURJASZ P., KOKOSZCZY ´NSKI R. (1999), “Financial Inflows to Poland, 1990-1996”, in: The
Mixed Blessing of Financial Inflows. Transition Countries in Comparative Perspective, edited by J. Gacs, R. Holzmann and M. Wyzan, Edward Elgard.
KASHYAPA., STEINJ., WILCOXD. (1993), “Monetary Policy and Credit Conditions: Evidence
from the Composition of External Finance”, American Economic Review, Vol. 83, N◦1, March, pp. 78-98.
KIERZENKOWSKI R. (2001), “Le canal étroit du crédit: une analyse critique des fondements
théoriques”, (“The bank lending channel: a critical assessment of theoretical foundations”), Working Paper, Paris IX Dauphine University, 22 p.
KOKOSZCZY ´NSKI R. [red.] (1999), “Mechanizm transmisji impulsów polityki pieni˛e˙znej w
Polsce”, (“The monetary policy transmission mechanism in Poland”), National Bank of Poland Materials and Studies, N◦91, August, 68 p.
ŁYZIAK T. (2001), “Monetary Transmission Mechanism in Poland. Theoretical Concepts vs.
Evidence”, National Bank of Poland Materials and Studies, N◦19, March, 48 p. NATIONAL BANK OFPOLAND(1998), Inflation Report 1998, http://www.nbp.pl
NUTI D.M. (2000), “The Polish Zloty, 1990-1999: Success and Underperformance”, American
OSI ´NSKI J. (1995), “Operacje otwartego rynku Narodowego Banku Polskiego”, (“The
open-market operations of the National Bank of Poland”), Bank i Kredyt, N◦6, June, pp. 37-48.
OSI ´NSKI J. (1999), “Polityka Pieni˛e˙zna Narodowego Banku Polskiego w okresie
1993-1997. Do´swiadczenia i mo˙zliwo´s´c wykorzystania w przyszło´sci wniosków z nich płyn ˛acych”, (“Monetary policy of the National Bank of Poland. Experience and opportunities for using related conclusions in the future”), Bank i Kredyt, N◦7-8, July-August, pp. 51-71.
POLA ´NSKI Z. (1998), “Polish Monetary Policy in the 1990s: A Bird’s Eye View”, in: Financial
Market Restructuring in Selected Central European Countries, edited by K.S. Vorst and W. Wehmeyer, Aldershot: Ashgate, pp. 7-22.
POLA ´NSKI Z. (1999), “Polityka kursu walutowego w Polsce w latach 90. Stabilizacja,
konkurencyjno´s´c i przepływy kapitałowe”, (“Exchange rate policy in Poland in the 1990s: Stabilization, competitiveness and capital flows”), Ekonomista, N◦1-2, pp. 135-153.
POLA ´NSKI Z. (2000), “Poland and International Financial Turbulences of the Second Half of
the 1990s”, in: Financial Turbulence and Capital Markets in Transition Countries, edited by J. Hölscher, London: Macmillan, New York: St Martin’s Press, pp. 53-75.
ROSATI D. (1999), “Dylematy polityki pieni˛e˙znej w warunkach swobody przepływu kapitału”,
(“Monetary policy problems in the context of free capital movement”), Bank i Kredyt, N◦7-8, July-August, pp. 34-46.
SARGENT T.J., WALLACE N. (1975), “Rational Expectations, the Optimal Monetary Policy
Instrument, and the Optimal Money Supply Rule”, Journal of Political Economy, Vol. 83, N◦2, April, pp. 241-254.
SŁAWI ´NSKI A., OSI ´NSKI J. (1997), “Mi˛edzybankowy rynek pieni˛e˙zny”, (“The interbank
market”), in Rynek pieni˛e˙zny w Polsce: stan i perspektywy, Z. Pola´nski [red.], Instytut Bada´n nad Gospodark ˛a Rynkow ˛a, N◦84, pp. 57-77.
SŁAWI ´NSKI A., OSI ´NSKI J. (1998), “Mi˛edzybankowy rynek pieni˛e˙zny”, (“The interbank
market”), in Rynek pieni˛e˙zny w Polsce w drugiej połowie lat dziewi˛edziesi ˛atych: stan i perspektywy, Z. Pola´nski [red.], Instytut Bada´n nad Gospodark ˛a Rynkow ˛a, N◦96, pp. 53-70.