AFFORDABILITY OF COMPLEMENTARY HEALTH
INSURANCE IN FRANCE: A SOCIAL EXPERIMENT
SOPHIE GUTHMULLERᵃ1, FLORENCE JUSOTᵃᵇ, JÉRÔME WITTWERᵃ ᵃ Paris-Dauphine University, Paris, France
ᵇ Institute for Research and Information in Health Economics (IRDES), Paris, France SUMMARY
In order to improve financial access to complementary health insurance (CHI) in France, a CHI voucher program, called Aide Complémentaire Santé (ACS) was introduced in 2005. Four years later, the program covered only 18% of the eligible population. Two main hypotheses are put forward to account for this low take-up rate. The first one is related to the lack of information on the program itself and on its application process. While the second one considers that the amount of the financial support is too small to encourage people to purchase a CHI plan. We conduct a controlled experiment with the National Health Insurance Fund in order to assess these assumptions. A sample of eligible insurees living in an urban area in northern France were randomly split into three groups: a control group who received the standard level of financial aid, a group benefiting from a 75% voucher increase, and a third group benefiting from the same 75% voucher increase plus an invitation to an information meeting on ACS.
After six months of follow-up, we observed how many application forms were sent back and how many of them entitled to ACS. Five main conclusions can be drawn from that analysis. (1) The voucher increase has a slight but statistically significant effect on ACS take-up. (2) It also allows better targeting of people actually eligible and thus reduces the number of ACS refusals due to resources above the upper limit. (3) However the invitation to the meeting seems unexpectedly to cancel the positive effect of the voucher increase when both treatments are applied jointly. (4) On the contrary, after controlling for potential selection bias, we observed that attending the briefing has a significant impact on ACS take-up. (5) This study confirms that ACS is complex and reaches poorly its target population. Only 17% of the insurees applied for ACS and only 9% of insures who were invited to the information briefing actually attended it. Moreover, previous CHI holders responded similarly to CHI non holders to treatments, which suggests that the central issue of ACS low take-up rate is not the CHI cost itself but most certainly the access to information, the burden and the complexity of the application process.
KEY WORDS: Subsidized health insurance; randomized experiment; uninsured; low-income population; France
JEL CODES: C93 D81 I18 I38
1. INTRODUCTION
The French Social Security system only partially covers, about 75% in average, healthcare expenditures (Compte de la Santé 2009). In order to reduce all or part of the remaining cost burden individuals can purchase a complementary health insurance (CHI) plan. This system raises then the issue of the financial access to care and the question of the affordability of CHI for the poorest
1
Correspondence to: LEDa-LEGOS, Université Paris-Dauphine, Place du Maréchal de Lattre de Tassigny, 75775 Paris Cedex 16, France. E-mail : sophie.guthmuller@dauphine.fr.
households. Jusot and Wittwer showed in fact that in France, inequalities in access to health care are mainly explained by inequalities in access to CHI (Jusot & Wittwer, 2009). For example, according to a 2006 survey2, 32% of the non CHI policy holders, stated to have foregone health care for financial reasons over the last twelve months, whereas this figure is 15% for the entire population. (Kambia-Chopin & al., 2008).
Since 2000, a free and public complementary health insurance called CMUC (Couverture maladie universelle complémentaire), has been available for low-income people which pays off most of the out-of-pocket expenses. Despite the existence of this free CHI plan, 7% remained uncovered. This figure is higher among households whose resources are just above the CMUC eligibility threshold and it strongly decreases with household income: 19% of the first income decile and 14% of the second income decile are uncovered (Arnould & Vidal, 2008).
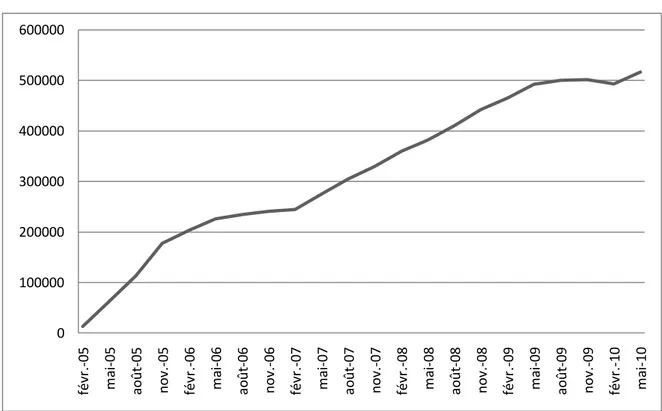
In order to improve financial access of these households to CHI, a voucher CHI program, called Aide Complémentaire Santé (ACS) was introduced in 2005. ACS is intended for households whose resources exceed 20%3 of the free CHI plan eligibility threshold and these households can benefit from that voucher regardless if whether or not they already hold a CHI plan. Uptake of ACS increased slowly since introduction but more steadily in recent months thanks to several information campaigns launched in January 2008 and lead by the mandatory health insurance funds. However, four years later, the program covered only 18% of the eligible population (see figure 1).
Two main hypotheses can be formulated to explain this fact. The first one is related to the lack of information on the program itself and on its application process. It is the main hypothesis explaining the non-take-up of eligible holders of an individual CHI whose do not assert their right, and also support the information campaign in place since 2008. The second hypothesis considers that the voucher is insufficient. That hypothesis concerns directly eligible individuals not covered by a CHI and means that CHI remains unaffordable even after deducting the voucher value. Indeed, the ACS voucher covers on average only 50% of contract premiums (Fonds CMU, 2008)4. Before deduction of the ACS voucher, these premiums may also represent nearly 10% of the income of the poorest households (Kambia-Chopin et al., 2008; Legal et al.,2008). This second hypothesis can be extended to CHI beneficiaries on the premise that the application process is a cost which is not entirely covered by the financial benefit of the voucher.
Fear of stigmatization is also a major reason for not claiming Social Security benefits conditional on resources (Hernanz et ali., 2004). Revealing earnings information to public services or to healthcare players might act as a brake on take-up. In the case of ACS, the stigmatization issue is certainly less important than for CMUC because only the CHI provider, apart from public services, is informed, whereas physicians know when patients benefit from CMUC (Desprès, 2010). Furthermore, knowing
2 Health, Health care and insurance survey (ESPS) is a biannual survey conducted by Irdes and the National Health Insurance Fund for Salaried Workers (CNAMTS). The survey is representative of 96% of the French population. It focuses on self perceived health status, public coverage and private supplementary health insurance, visits to a physician, consumption of medical goods and services, care and services administered by non-physician clinicians, hospitalization, reasons for not seeking care and opinions about health.
3
Since January 2011, ACS is intended for households whose resources exceed 26% of the CMUC plan eligibility threshold and will be extended to 30% in 2012 (PLFSS, 2011)
that the non take-up of CMUC is lower compared to that of ACS, it is tempting to conclude that fear of stigmatization is not a major factor for ACS.
Thus, the focus of this paper is to test the two main hypotheses put forward to explain the low take up of ACS, which are the lack of information on one hand and insufficient voucher amounts on the other hand.
The analysis of the non take-up of social benefits faces two obstacles. The first one is to find a sample of eligible individuals. In the case of ACS, this is particularly difficult given the narrowness of the target population. Samples of eligible individuals from general population surveys are usually too small. In addition, identification of the eligible population is made harder by the multitude and accuracy of information to be collected in order to meet all eligibility criteria5. Conducting a broad and representative survey of eligible individuals is then made even harder.
The other obstacle is very different in nature; it bears on revealing the reasons for non take-up. Assuming that one can build a sample of eligible individuals, it is possible to distinguish the subpopulation receiving ACS benefits from the subpopulation who did not apply for. One can then infer the reasons (informational, economic) for non ACS take-up by comparing both sub-populations. One may link for example the proximity of a household to relevant information to present or past benefits of other welfare payments, or assume that households who are less sensitive to the ACS voucher are those whose incomes are the lowest ( i.e. make the assumption that the price elasticity of demand increases with income)6. But, on the one hand, the reasons are necessarily revealed indirectly, and on the other hand, with narrow target populations such as that of ACS, eligible population is very homogeneous, especially from an economic point of view, which leaves little hope to get results.
It is also possible to reveal directly the reasons for non take-up by interviewing individuals7 but responses are then subjective and sensitive to question wording. These responses are very useful as they give a comprehensive overview of reasons, but give only indirect indications on expected effects of an information campaign or a voucher increase.
In this study, we use a direct approach of public policy evaluation consisting in measuring the effects on the ACS take-up rate of a change in the subsidized CHI program in force. The implementation of this approach assumes of course that one can observe such changes. As it can be seen from table 1 and figure 1, it is the case since the introduction of this program in 2005, especially concerning the voucher amounts. However, the evaluation of these modifications relies on the observation of a control population kept out of the new rules. Indeed, a before and after analysis of the ACS take-up rate is insufficient because the rate follows its own dynamics, independent of legislative changes which is therefore impossible to take into account robustly without observing a control population.
5
ACS eligibility assessment assumes examination of all household resources (labor income, capital, social benefits, pensions received, including benefits in kind like for instance owning an accommodation, or be housed free of charge) over the twelve months preceding the application.
6
An alternative method is to identify price elasticities of demand for insurance in a general population survey and to infer the expected impact of the voucher increase. This implies either to have data gathering heterogeneous price contracts (see Auerbach and ali, 2006, Thomas, 1995), or to introduce strong assumptions (like Grignon and Kambia -Chopin, 2009), based on a utility function linking income effect and price effect).
This is even more relevant in the case of ACS as it is a relatively recent program, whose take-up rate is not stabilized (see figure 1).
To overcome this problem, we built a randomized experiment. The principle is simple: identify individuals eligible for ACS (or more precisely individuals potentially eligible) and split these individuals randomly into groups that will be offered different ACS voucher amounts and differentiated access to information. This type of controlled experiment requires the active participation of involved institutions and therefore it is particularly costly for both the evaluation team as for the institutions. Given the resources at our disposal in this study, the experiment was conducted at local level precisely that of a local Health Insurance Fund of a city in northern France (Lille city). Consequently, we gain in robustness by building a control group, but we lose in representativeness.
The rest of this paper is structured as follows. In order to better understand the role that CHI plays in gaining access to health care in France, the French health insurance system is firstly presented. The experimental design and the data are described in section 3 before specifying the methods used in section 4. Section 5 presents the results. These results are discussed with some concluding remarks in section 6.
2. INSTITUTIONAL FRAMEWORK
2.1 The role of CHI in gaining access to health care in France
The French health insurance system consists of two parts: the public health insurance (PHI) and the complementary health insurance (CHI). The first one is public, compulsory and universal. PHI is mainly funded by social contributions deducted from people’s salaries, and partially from income tax (the General Social Contribution, (CSG). It is divided into schemes according to profession: Our sample of insurees is, as the majority of the French population, insured by the National Health Insurance Fund for Salaried Workers. Approximately 2% of the population (students and people who are not covered by a professional insurance scheme) receive compulsorily cover through the universal health insurance program, within the National Health Insurance Fund, called Couverture maladie universelle (CMU). CMU is free for low-income people and people earning more than a certain threshold, 9,029€ in 2010, have to pay a contribution of 8% (Fonds CMU, 2010). PHI covers only part of health expenditures: on average 75% of the government regulated price, about 90% for inpatient care, 66% for ambulatory care and very little for dental and optical care. However, some people (such as those suffering from long-term illnesses) benefit from full coverage of the treatment costs related to their situation. But this exemption from financial contributions does not mean that these patients don’t have to cope with relatively large out-of-pocket healthcare costs, due to, besides healthcare expenditures related to other illnesses they may have, flat fees, deductibles or charges exceeding the statutory fee for expenditures related to their chronic illness (Elbaum, 2008).
Thus, the French PHI leaves part of the health care costs to be borne by insurees. However, part or all of these remaining costs can be covered by a complementary health insurance (CHI). CHI is additional, voluntary and private. In France, CHI is not only complementary to PHI, CHI covers co-payment, but also supplemental to PHI because it can reimburse charges exceeding the statutory fee
or health care expenses not covered at all by PHI (for instance, orthodontic care, non-reimbursed medication, homeopathic medicine,...). CHI contracts can be purchased either individually or at the firm level. Since 2000, a free and public complementary health insurance, called CMUC (Couverture maladie universelle complémentaire), has been available for low-income people which pays off most of the out-of-pocket expenses and is funded jointly by the state and by private CHI providers.
2.2 The Subsidized Insurance Program
In order to improve financial access to CHI, a voucher program, called Aide Complémentaire Santé (ACS) was introduced in 2005. ACS is intended for households whose resources are between the CMUC eligibility threshold (in 2010 it is 634€ monthly for a single) plus 20%8 (761€). The voucher is delivered by public health insurance funds and entitles holders to a premium discount for health insurance taken individually. ACS was created not only to encourage these households to purchase a CHI plan or a plan of better quality, but also to financially compensate those who were already covered. Thus, eligible individuals already covered can benefit retroactively from that price reduction. This program can be looked upon as a smoothing instrument introduced to reduce the threshold effect induced by the free CMUC plan eligibility ceiling.
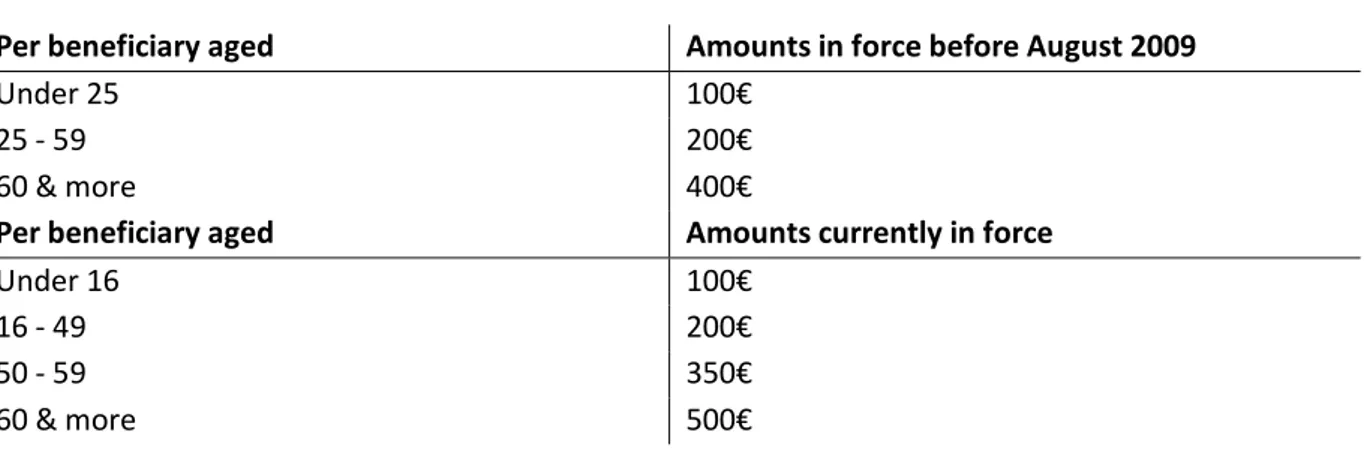
The voucher amounts are determined by the number of beneficiaries and their age. They ranged from 100€ to 400€ per insuree in 2005 but have been revised upwards and new age brackets have been defined in August 2009. Table 1 shows the amount scales currently in use and those in force before August 2009, that corresponds to the time period of our study.
According to the CMU Funds, the average annual cost of a CHI plan took out by ACS beneficiaries was 764€ in 2009 (Fonds CMU, 2010).
Table 1: ACS voucher amounts
Per beneficiary aged Amounts in force before August 2009
Under 25 100€
25 - 59 200€
60 & more 400€
Per beneficiary aged Amounts currently in force
Under 16 100€
16 - 49 200€
50 - 59 350€
60 & more 500€
Uptake of ACS increased slowly since introduction but more steadily in recent months thanks to several information campaigns launched in January 2008 and lead by the mandatory health insurance funds. Despite that increase, four years later, the program concerned only a little over 500,000
8
Since January 2011, ACS is intended for households whose resources exceed 26% of the CMUC plan eligibility threshold and will be extended to 30% in 2012 (PLFSS, 2011)
insured persons (figure 1). This result is far below the 2 million people initially targeted. However this figure must be regarded as a rough order of magnitude because only people not covered by a group CHI plan are eligible for ACS9. After all, ACS take–up is low and this is even more surprising because a significant part of the eligible population is covered by a CHI taken individually and thus could get a price reduction for that contract10.
Figure 1: Number of ACS beneficiaries since enactment in 2005
Source: Data from Fonds CMU website, http://www.cmu.fr/userdocs/PrevACS.02.09.pdf, consulted on December 9, 2010
3. THE EXPERIMENT
This section firstly describes the experiment design and then the data employed in the analysis.
3.1 Experiment design
The experiment is an extension of a specific program already in place at the Health insurance funds (HIF) in Lille. This HIF proposed a specific treatment for individuals going to the HIF office in order to apply for CMUC but who were actually eligible for ACS. These persons were offered additional financial support during a briefing. This additional aid was supported by the welfare fund in Lille. Thus, to promote the ACS voucher program, HIF acted by improved information support and by more generous voucher. The national information campaign on the ACS program launched in 2008 gave us
9
In fact, it is estimated that one tenth of individuals eligible for ACS are covered by a collective insurance contract, if one approximates the eligible population by people belonging to the first decile group of living standards. This estimates rises to one fifth if the eligible population is approximated by the second decile group (Arnould & Vidal, 2008).
10
Arnould & Vidal, 2008, estimated that 33% of individuals belonging to the first decile group of living standards are covered by a CHI taken individually and this figure is 50% for the second decile group.
0 100000 200000 300000 400000 500000 600000 févr .-05 m ai -05 ao ût -05 no v. -05 févr .-06 m ai -06 ao ût -06 no v. -06 févr .-07 m ai -07 ao ût -07 no v. -07 févr .-08 m ai -08 ao ût -08 no v. -08 févr .-09 m ai -09 ao ût -09 no v. -09 févr .-10 m ai -10
the opportunity to evaluate the effect of a generalization of this program in an experimental setting11. This campaign actually mailed information leaflet to people insured by HIF and identified as potentially eligible for ACS according to their resources recorded by the Family Allowances Fund (FAF)12. We could then take advantage of these mailings to conduct the experiment.
The information campaign on ACS began in Lille in January 2009. Based on the mailing lists of FAF and the HIF files, we could identify 4,209 insured persons13 potentially eligible for ACS and not benefiting from it, according to their resources in 200714. This population, defining the experimental population, was randomly divided into three groups.
The first group, named Control group further in this paper, received an ACS information leaflet and an application form with the current financial aid. The second group, called Treated group 1, received the same letter but with a voucher increase. The third group, Treated group 2, received the same letter with the voucher increase but got also a social take-up proposal. The amounts of voucher proposed are summarized in table 215.
11
We couldn’t use the specific program as it was to evaluate its potential impact on the entire eligible population since treatments were proposed to a selected population (i.e. only to insures who came to HIF office in order to get information), not representative of the eligible population.
12
In French “Caisse d’allocations familiales”. FAF offered allowances related to family, children, housing, minimum incomes,… . Allowances entitlement and amounts are conditional to income level of the household.
It is important to note that using mailing lists of FAF to identify potential eligible for ACS restricts the analysis to people entitled to allowances offered by FAF. Without being able to give a specific figure, it is likely that the selected sample is broadly representative of the eligible population. Nevertheless, we selected a population already using social security. It means that we remove from analysis households eligible for ACS but systematically not taking-up social security in the one hand and households eligible for ACS but not eligible for family allowances in the other (For instance, elderly home owners.)
13
Originally, 5,000 insured persons were identified. However, one must keep in mind that eligibility for ACS is evaluated in terms of household resources and the program itself is a benefit attributed to the household. Moreover, some households (the dual-earner couples in particular) are composed of several insured persons identified by FAF as potentially eligible. As during the information campaign the letters were sent by HIF to each insured persons, some households have received several letters. In our experimental setting, these cases are problematic. Indeed, two insured persons who were randomly assigned into different groups but who belong to the same household may have received two different letters. To address this contamination bias, we removed from our sample all insured persons belonging to the same household but assigned to different groups. In addition, we randomly selected an insured person within the household in which several insurees were assigned to the same group. Accordingly, the dual-earner couples are generally but identically under-represented in each group. The sample of experienced individuals was finally reduced to 4,209 insurees.
14 Identification was made possible by a query-based application originally designed by the Observatory on Non-Take Up of Social Rights and Public Services (Revil, 2008).
15
The increased vouchers are only provisionally proposed. They last two years and the voucher is cut in half the second year.
Table 2: ACS voucher amounts proposed during experiment Age
Group Under 25 between 25 & 59 60 & older
Control 100€ 200€ 400€
Treated 1 & Treated 2 175€ 350€ 650€
Note: ACS voucher amounts per persons in the household. The amounts proposed to the control group are the official amounts offered at the time of experiment (January – July 2009, see table 1). For example, when CHI covers a 26 years old adult and 2 children under 25, the ACS voucher is (200€ + 2*100€)= 400€. This household could benefit from a 400€ discount on his annual insurance premium. The increased vouchers were those proposed by the HIF of Lille within the specific program in place before the experiment, which explains the non-uniform rate of increase between age groups. This sample of potential eligible insurees was invited to return an application form to HIF office for effective assessment of their eligibility for ACS. As already mentioned, the files were compiled on the basis of income year 2007, while eligibility for ACS is studied from the resources of the past 12 months.
The social take-up for the second treated group took the form of a group information meeting on ACS leaded by a social worker and took place at the HIF head office in Lille. These briefings were done before HIF assessment proceeding, unlike the proposed meetings in the current frame of the specific treatment for insured persons who were not eligible for CMUC but for ACS. Fourteen meetings were held from February to April 2009, about twice a week. The letters for the second treatment group were sent in waves over two months in order to manage the flow of insurees responding positively to the briefing invitation.
3.2 Data
These insurees were followed-up over six months (January – July 2009) and we recorded how many application forms were sent back and how many of them entitled to ACS. More precisely, data collected by HIF give, for each insuree, information about, his/her group, if an application form were sent back, if after assessment proceedings ACS were notified and if in case of refusal, if it was justified by resources too high or otherwise too low for ACS eligibility, which in the latter case CMUC were offered. Finally, for insured persons assigned to treated group 2, the meeting participation and the date of attendance were recorded.
These data were then matched to HIF administrative data. For each insuree in the sample, we got information on age, sex, if he/she has got beneficiaries and if yes how old they are, his/her reimbursement scheme on December 31, 2008 (employed, retired, unemployed, disability pension or allowance recipient, long term illness scheme), his/her total healthcare spending on outpatient care in 2008, and if he/she is covered by a CHI plan before (December 31, 2008) and after (September 30, 2009) the experiment. We also know if the insured person was a CMUC recipient on December 31, 2007.
Appendix A presents the full set of variables used.
Data on health care expenditures are those reimbursed by the public health insurance one year before the experiment started. However, we only have information on ambulatory health care as inpatient cares are not recorded by HIF. But as described in the introduction, inpatient care is almost
entirely reimbursed by the public health insurance. So not taking these expenditures into account in the analysis does not much affect the willingness to buy a CHI, as CHI mostly covers ambulatory care expenditures.
It is also important to note that insured persons, who were initially identified as eligible for ACS according to their resources in 2007, are actually not eligible16, when they are covered by a CHI received through employer. Unfortunately, data on CHI coverage recorded by the National health insurance fund does not tell us if CHI were purchased through employer or individually. However, we will be able to differentiate the two in further research thanks to a survey realized on the same population after the experiment (Wittwer et al., 2010).
Information on CHI plan status are collected by HIF thanks to a computer information exchange standard, called NOEMIE (Norme Ouverte d’Echange entre Maladie et les intervenants Exterieurs). This standard allows electronic transmissions of healthcare invoices between HIF offices and CHI providers. Note however that all CHI providers are not affiliated to NOEMIE, which leads, in our data, to an underestimation of the CHI rate of coverage.
All these collected data allow us to evaluate the effects of the specific letters sent to the treated groups, on the take-up for ACS. For convenience, we will use the word “treatments effect” to speak whether about the voucher increase, “treatment 1”, or whether about the voucher increase and the meeting invitation, “treatment 2” and we will speak about the insured persons "response to treatments".
Table 3 provides a first description of the experienced population. We verify that random assignment led to very similar distributions of observed variables between groups17. Insured persons in the sample are, equally, men and women, 15% have at least one beneficiary under the age of 318. A large proportion of them, nearly 80% are aged 25 to 59 while the under 25 years old represent less than 10% of each group. Then, if we consider the HIF scheme of the insured persons, 60% are employed, nearly 25% are unemployed because of a disability and 15% have a retirement pension. Finally, we note that one month before the start of the experiment, an insured person of three was not covered by a CHI plan19 while 50% of the population had ambulatory healthcare expenditures exceeding 700€ in 2008.
16
As ACS apply only to CHI bought individually. 17
Chi-square tests performed do not allow the rejection of the null hypothesis of independence. 18
Note here that we only observed beneficiaries of the insured persons and not the households’ composition. 19 This rate is well above the estimates on survey data for this population (This rate is 19% if the population is approximated by the first income decile and 14% for the second decile (Arnould and Vidal, 2008)). The gradual build-up of the standard exchange system NOEMIE certainly explains part of the difference: all CHI providers are not affiliated to the system in December 2008.
Table 3: Description of the population before experiment
Group
Control Treated 1 Treated 2 Total
Age Under 25 105* 7,5% 113 8,0% 108 7,7% 326 7,8% Btw. 25-59 1048 75,2% 1056 74,8% 1040 74,1% 3144 74,7% 60 & older 241 17,3% 243 17,2% 255 18,2% 739 17,6% Sex Man 679 48,7% 691 48,9% 693 49,4% 2063 49,0% Woman 715 51,3% 721 51,1% 710 50,6% 2146 51,0%
Beneficiary under of age 3
No 1188 85,2% 1201 85,1% 1186 84,5% 3575 84,9% Yes 206 14,8% 211 14,9% 217 15,5% 634 15,1% HIF scheme Employed 812 58,3% 819 58,0% 830 56,2% 2462 58,5% Disability pension 339 24,3% 349 24,7% 338 24,1% 1026 24,4% Retired 210 15,1% 206 14,6% 200 14,3% 616 14,6% Unemployed 32 2,3% 38 2,7% 35 2,5% 105 2,5% Healthcare expenditures in 2008 0€ - 200€ 374 26,8% 350 24,8% 362 25,8% 1086 25,8% 200€ - 700€ 342 24,5% 366 25,9% 356 25,4% 1064 25,3% 700€ - 2000€ 339 24,3% 334 23,7% 358 25,5% 1031 24,5% >=2000€ 339 24,3% 386 25,6% 327 23,3% 1028 24,4%
Long-term illness care in 2008
No 1009 72,4% 1014 71,8% 996 71,0% 3019 88,4% Yes 385 27,6% 398 28,2% 407 29,0% 1190 28,3% CHI coverage in 2008 No 467 33,5% 477 33,8% 480 34,2% 1424 33,8% Yes 927 66,5% 935 66.2% 923 65,8% 2785 66,2% CMUC coverage in 2007 No 1296 93,0% 1312 92,9% 1312 93,5% 3920 93,1% Yes 98 7,0% 100 7,1% 91 6,5% 289 6,9% Total 1394 100,0% 1412 100,0% 1403 100,0% 4209 100,0%
Note: Descriptive statistics of the insured persons before the experiment. *In the control group, 105 (7.5%) insured persons are under the age of 25 on January 1, 2009.
4. METHODS
The evaluation of the effect of the voucher increase and the information meeting on the demand for ACS is theoretically based on the potential outcome model, developed by Roy in 1951 and Rubin in 1974 (Roy, 1951; Rubin, 1974).
4.1 Potential Outcome Model
We are interested in estimating the causal effect of a treatment T on an outcome Y. This model defines two potential outcomes, the outcome of individual i when i is treated and the outcome of individual I when i is untreated. The causal effect of participating in the treatment for i is then equals to = - . But is always unobservable as only one of both outcome variables is observable; when i is treated, is realized and is not observed. is then called the counterfactual outcome and refers to the outcome Y that would have occurred if the individual were treated.
The Roy-Rubin model defines several parameters to assess the causal effect of a measure. The most common parameter used in the literature is the average treatment effect on the treated (Average Treatment Effect On the Treated (ATT)). More precisely, we want to measure how the treatment affects the outcome variable in average compared to what it would be if treated people wouldn’t be treated. Formally, .
As the counterfactual is unobservable, aim is to find the best substitute to estimate ATT without bias. In practice, when attempting to estimate the impact of treatment, we calculate the difference between the mean of the outcome variable on individuals who received the treatment and that of other individuals who did not receive the treatment: = E[ \T=1]- E[Y\T=0]. However, is likely to be biased because treatment participation is often not independent of the potential outcomes, individuals self-select into treatment. In fact, individuals with positive are more likely to participate. If there is self-selection, then and and is biased. Furthermore, we cannot estimate the counterfactuals.
Consequently, ATT estimate is unbiased only if is verified, that is if .
In order to account for the potential selection bias, we use three different methods (Imbens and Wooldridge, 2008). Firstly we constructed an experimental design; next we use matching methods, and finally a bivariate Probit regression.
4.2 Effect of the voucher increase and the meeting proposal
Randomized experiment
Within the framework of an experimental design, treatment is randomly assigned across individuals. Untreated individuals form the control group and treated individuals the treated group. Thus if the sample of individuals is sufficiently large, random assignment ensures that both groups are similar, not only on observable variables but also on unobservable ones. It solves the self-selection issue by construction. Formally we have, and .
In our analysis we defined two different treatments; an ACS voucher increase for the first treated group and an information meeting proposal in addition to the voucher increase for the second treated group. As these treatments were randomly assigned, evaluation is primarily based on a quantitative review of returned application forms, ACS proposals and refusals in the different groups.
The impact of treatments can then be estimated by difference in means between treated and untreated groups. Comparison between groups is done with Chi square tests.
4.3 Impact of the meeting participation
Propensity score matching methods
Individuals assigned to the second treated group were invited, to an information meeting on ACS. Some of them attended the meeting, others did not. So, it is likely that individuals self-selected themselves i. e. individuals with positive expected outcome are more likely to participate. Thus, we first use propensity score matching methods in order to control for potential bias on observables (Heckman et al., 1997), (Heckman et al., 1998), (Rosenbaum and Rubin, 1983). The aim is to estimate the average causal effect of meeting participation on the probability of applying for ACS for those individuals who went to the meeting ( ). Treatment T is here defined as meeting participation. Matching methods consist of finding pairs of ‘identical’ individuals, one belonging to the treated group (people who did go to the meeting) and another belonging to the untreated group (people who did not go to the meeting). The goal is to build a “control group” with similar characteristics as the treated population in order to compare them. For each individual belonging to the treated population, we seek his pair in the control population by adjusting for confounding variables (Xi). Matching methods rely on two assumptions: (1) Conditional independence: all variables that are relevant for jointly determining treatment and outcomes are observed and included in Xi. So that we have: . Selection is only based on observables. (2) Overlapping support: .
The average effect of the meeting participation on the participants (ATT) estimated using a matching procedure can be written as follows:
,
where and are respectively the number of individuals who didn’t attend the meeting, and the number of individuals who participated. W(i,j) is the weighting chosen to build the counterfactual i.e. the weighting that selects individual (individuals) j in the non participant population who is (are) the closest to individual i in the participant population. We then have for all i.Since conditioning on a high-dimensional vector of observable characteristics is complex, we follow Rosenbaum and Rubin (1983) and match on the predicted meeting participation probability.
Several techniques have been developed to estimate the weighting. The first one we use is called nearest neighbor and consists in finding a pair in the untreated group with the closest propensity score (in that case . We then decided to use the four nearest neighbours because we have a relative large group of untreated compared to the number of treated individuals (Abadie et al., 2004) (in that case . Moreover, we allow for replacement (one control individual can be matched to more than one treated individual) because it better control for bias although it’s less efficient in terms of variance.
However matching on the nearest neighbour(s) has the disadvantage of pairing two individuals regardless of the distance between the participant and its nearest neighbor in the non participant population. Thus, if the nearest neighbor in terms of propensity score, is very remote, the pair of individuals may have very different characteristics. The Radius matching control that risk in excluding
pairs of individuals whose score difference exceeds a fixed value. We also apply kernel matching (Heckman et al., 1998) which chooses the matches by a kernel – weighted average of the outcome of all non-treated individuals (in that case;
). A central issue of these
non-parametric methods is the selection of the bandwidth value. Large values tend to decrease variance but increase bias. We decided to use the default Epanechnikov kernel function and a bandwidth value of 0.01 for kernel matching and radius matching.
Finally, following Hirano et al., 2003, we estimate the counterfactual by weighting each individual not participating by the inverse of its propensity to return an application form. Formally, the average effect of the meeting participation on the participant population is:
Propensity score matching is a two-step method. We first estimate the propensity to participate to the meeting using a binary outcome model (Logit) controlling for regressors: . We then calculate the average meeting effect on the outcome variable: the probability of applying for ACS. For more information on all of these estimators, the reader may consult Heckman et al., 1997 and 1998, Givord, 2010 and Caliendo and Kopeinig 2008.
Bivariate probit model
However, matching methods do not account for heterogeneity bias due to unobservables. Indeed, regressors at our disposal characterize only imperfectly experimented individuals. They obviously differ in many other dimensions and some of these can both explain their propensity to attend the meeting and to apply for ACS. For example, the interest they have in their own health. In other words, it is possible that previous methods impute to the meeting the impact on demand for ACS which is actually the result of unobserved variables. It will be necessary to extend the statistical analysis to verify that it is not. The challenge is to identify one or more variables that could influence the probability of going to the meeting but not the probability of returning a form.
In order to control for potential bias due to endogeneity of the meeting participation, we use a bivariate probit model (Lollivier, 2009). We define two latent variables, the propensity of meeting participation and the propensity of returning an application form as follow:
For which we respectively observe and . The conditional rule of if is realized can be written as:
Where the error term u follows a normal distribution N(0, ). α=ATT is our parameter of interest. Under this estimation technique, the betas (the coefficients on the Xs) are restricted to be
the same for people who went to the meeting and people who did not. In other words, we suppose that meeting participation has merely an intercept effect on the probability of applying for ACS20. But this model rely on the use of an identification variable i.e. at least one variable that has a significant effect on the probability of attending the meeting but not on the probability of returning an application form to get ACS. Theoretically, we can suppose that the meeting date proposed to the second treated group should have a direct and significant effect on the probability to attend it21.
5. RESULTS
This section presents the result of the experiment. To evaluate the treatments effectiveness we focus on two outcome variables: the rate of returned application forms and the rate of ACS notified, i.e. the proportion of experienced individuals who effectively received an ACS voucher after re-assessment of the eligibility criteria by HIF Lille. The random assignment of the treatments allows direct comparisons of the outcome variables between groups.
We now detail how groups respond to treatments. As stated above, we first focus our attention on the effect of treatments on the rate of returned forms and in a second time on ACS notifications. Weak but significant effect of the voucher increase
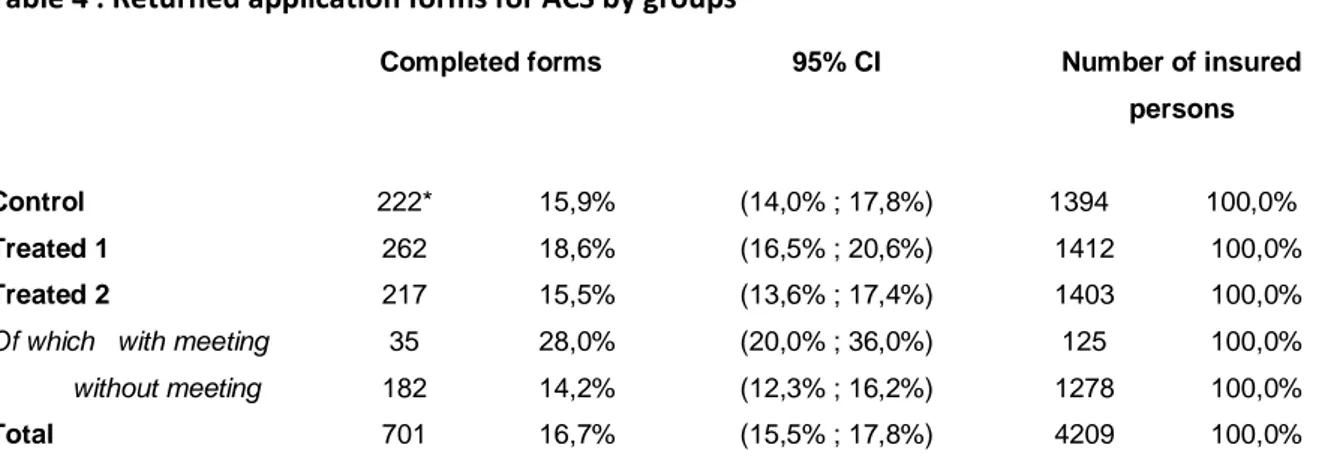
We investigate if subsequent to the letter received from HIF, insured persons applied for ACS. We then assess the demand or the interest for ACS by the number of returned application forms. Out of the 4,209 letters sent, 701 complete forms were received, that is a return rate of 17%. The first observation is that the rate of returned forms is generally quite modest (Table 4).
We now measure differences between groups to assess the effectiveness of treatment. For the control group, 16% of policyholders returned a completed form to get ACS (222 cases). Insured persons having been offered only an increased voucher (treated group 1) significantly more often completed a form than insured persons of the control group, with a return rate of 18,6% (5% statistical significance level). Increasing ACS voucher seems to have an impact on the probability of applying, although this impact is small.
20
Alternatively, if we suppose that meeting participation has not only an intercept effect but also a slope effect (i.e., the betas differ according to meeting participation as well), then an endogenous switching probit model is called for.
21 Alternatively, we could have used assignment to the first treated group as an instrument and estimate a local average treatment effect. However, as it is explained in the results section, in our case, assignment to the first treated group is not a valid instrument because the meeting proposal has a negative and significant impact on the probability to apply for ACS.
Table 4 : Returned application forms for ACS by groups
Completed forms 95% CI Number of insured
persons
Control 222* 15,9% (14,0% ; 17,8%) 1394 100,0%
Treated 1 262 18,6% (16,5% ; 20,6%) 1412 100,0%
Treated 2 217 15,5% (13,6% ; 17,4%) 1403 100,0%
Of which with meeting 35 28,0% (20,0% ; 36,0%) 125 100,0% without meeting 182 14,2% (12,3% ; 16,2%) 1278 100,0%
Total 701 16,7% (15,5% ; 17,8%) 4209 100,0%
Note: Number of returned application forms for ACS by groups. *In the control group, among the 1394 insured persons 222 (15.9%) returned an application form to get ACS.
Comparing rates of returned forms in the control group and in the first treated group allow assessing the voucher amount elasticity of demand for ACS. This elasticity is calculated by the ratio of the growth rate of the probability of returned forms and the growth rate of the voucher amount22. It is 0,22 (Table 5). This indicator reflects the sensitivity of insured persons to the voucher amount, and in our case, it means that an increase in ACS voucher of 10% increases the probability of applying for ACS by 2.2%.
Table 5: Voucher amount elasticity of the demand for ACS
Returned form ACS notification
Elasticity 95% C.I. Elasticity 95% C.I.
Total 0,22 (-0,01 ; 0,49) 0,49 (0,11 ; 0,96)
CHI coverage in 2008
No 0,23* (-0,16 ; 0,76) 0,51 (-0,12 ; 1,47)
Yes 0,21 (-0,06 ; 0,55) 0,48 (-0,03 ; 1,06)
Note: Elasticity calculated as the ratio between the growth rate of the probability to return an application form (to get ACS) between control and treated group 1, on the one hand, and the growth rate of voucher amount between the national amount and the increased amount for insured persons under 59 years (the rate being slightly lower for those over 60 years) on the other.
The voucher increase allows better targeting of people actually eligible
After looking at returned application forms, we can also examine how many of them finally entitled to ACS. Indeed, ACS was not awarded to all applying insured persons because some of them had resources outside eligibility thresholds.
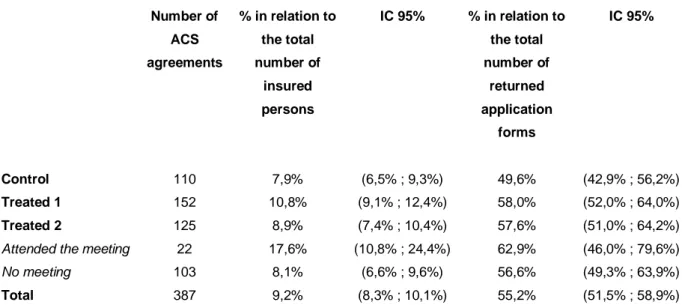
ACS agreements are presented in Table 6 and cases of ACS refusal in Table 7.
22
By using a growth rate of 75% for the voucher amount (although this figure is equal to 62.5% for the over 60 years), we choose to under-estimate an aggregate elasticity rather than to estimate elasticity by age groups with insufficient accuracy because of the small number of people over age 60.
Table 6 : ACS agreements per group Number of ACS agreements % in relation to the total number of insured persons IC 95% % in relation to the total number of returned application forms IC 95% Control 110 7,9% (6,5% ; 9,3%) 49,6% (42,9% ; 56,2%) Treated 1 152 10,8% (9,1% ; 12,4%) 58,0% (52,0% ; 64,0%) Treated 2 125 8,9% (7,4% ; 10,4%) 57,6% (51,0% ; 64,2%)
Attended the meeting 22 17,6% (10,8% ; 24,4%) 62,9% (46,0% ; 79,6%)
No meeting 103 8,1% (6,6% ; 9,6%) 56,6% (49,3% ; 63,9%)
Total 387 9,2% (8,3% ; 10,1%) 55,2% (51,5% ; 58,9%)
Note: Number of ACS agreements by group and their proportion in relation to the total number of insured persons included in the experiment and the total number of completed application forms.
Table 7 : Cases of ACS refusal
CMUC agreement Resources above upper limit
Number % in relation to the total number of insured persons % in relation to the total number of completed application forms Number % in relation to the total number of insured persons % in relation to the total number of completed application forms Control 25* 1,8% 11,3% 87 6,2% 39,2% Treated 1 25 1,8% 9,5% 85 6,0% 32,4% Treated 2 21 1,5% 9,7% 71 5,1% 32,7% Attended to meeting 2 1,6% 5,7% 11 8,8% 31,4% No meeting 19 1,5% 10,4% 60 4,7% 33,0% Total 71 1.7% 10,1% 241 5,8% 34,7%
Note: Number of CMUC agreements and the number of refusals due to resources above the limit of eligibility, and the corresponding percentage in relation to the total number of insured persons and in relation to all completed application forms.
In total, 55% of application forms entitled to ACS (Table 6), 10% to CMUC because resources of households were below the eligibility threshold for ACS and 36% to refusal because of resources above the upper limit (Table 7). The refusal rate for applications is substantial for a FAF preselected population. Finally, only 9% of insured persons got ACS, 2% got CMUC and 6% were refused ACS and CMUC.
Comparing rates of ACS agreements in relation to the total of letters sent between the different groups leads to conclusions quite similar to those drawn from the analysis based on returned forms,
the difference between control and second treated group, however, being accentuated. The proportion of ACS agreements is 8% in the control group and 11% in the first treated group.
The voucher amount elasticity of the probability of ACS agreement is 0.48 (Table 5), an elasticity significantly higher compared to the one calculated on the basis of the rate of returned forms. This increase in elasticity is explained by a much lower proportion of returned forms in the control group than in the treated groups. In fact, the proportion of ACS agreement among returned application forms is only 49% in the control group, whereas it is 58% in treated group 1 and 57,6% in treated group 2 (Table 6).
However, the observable characteristics of insured persons applying for ACS among the three groups are very similar (Wittwer et al., 2010). Therefore, the explanation for the difference in agreement rates between control and treated groups cannot be attributed to their observable characteristics. We can then speculate that the increased amount of ACS voucher decides some individuals, among the poorest, to apply for ACS, whereas they would not apply for it given the expected premium subtracted from the national ACS voucher amounts. The proposed treatments seems then to have selected more specifically insurees actually eligible, ie the poorest among the experimental population since the refusal rate due to resources above the upper limit is lower in both treated groups than in the control group (Table 6).
Meeting proposal seems to nullify the impact of the increased voucher
For the second treated group, whose members received an invitation to a briefing and an increased ACS proposal, the return rate of application forms ranks 15,5%. Although this rate of return is slightly lower than the one in the control group, statistical analysis does not establish that it is significantly lower (5% level of significance). However, there is a marked difference if one considers only the insured persons who didn’t attend the briefing; the return rate is now 14.2%, whereas the same voucher amounts were offered.
Among the 1,403 members of the second treated group, only 125 actually attended the meeting to which they were invited (9%). Among these, 35 returned a form (28%). The proportion is significantly higher than that in other groups (at the 1% level of significance). This result will be discussed later. As expected, the briefing invitation seems to impact positively the demand for ACS to people who attended, but in a less expected manner, the meeting invitation played negatively on people who did not participate. One explanation is that part of the insured persons in the second treated group, those who did not go to the meeting, held the meeting attendance for compulsory and therefore did not consider it a good think to apply for ACS since they could not attend the meeting. This interpretation seems to be confirmed by the post survey and a qualitative study which states that some insured persons who went to the meeting understood their presence at this meeting as a prerequisite to obtaining ACS (Wittwer et al., 2010).
This shows how chosen forms of communication determine the effectiveness of information transmitted. The complexity of the ACS program asks for direct information, face to face, but getting information by HIF seems to deter some people to apply for. This certainly legitimises the use of third party institutions (associations, CHI providers, social workers ...) to spread information (Chauveaud and Warin, 2009).
Significant impact of meeting attendance on ACS application
As indicated above, insured persons who attended the meeting are significantly more likely to complete an application form (and to get an ACS agreement). This result is expected and encouraging but must be strengthened as we cannot rely on the experimental nature of our data.
People, who attended the briefing, have a particular profile. These individuals are older, had more often LTC, weren’t covered by a CHI at the beginning of experiment and had higher healthcare expenditures in 2008. People having a disability allowance are also significantly less likely to attend the meeting (Wittwer et al., 2010). These results raise questions about whether their greater ACS take-up is not simply explained by this particular profile. To verify this, we use several methods. Firstly we use several matching methods in order to control for potential bias on observables23. Table 8 confirms the preceding results. Whatever the specification used, meeting participation has a significant and positive effect on the probability of applying for ACS. But this result is not sufficient. Indeed, the variables at our disposal only imperfectly characterize the experienced individuals. These obviously differ in many other dimensions and some of them can both explain their propensity to go to the meeting and to apply for ACS, for example their interest in their health. In other words, it is possible that previous estimates attribute to the meeting the impact on the demand for ACS, which is actually the result of unobserved variables.
Finally, we intend to control for potential bias due to unobservables by estimating a bivariate probit model. We use the meeting date in months as an identification variable. We see that the correlation coefficient (rho=-0,14) is negative but not statistically different from 0. Therefore, we can conclude that there is no selection bias due to unobservable in our case. The marginal effect of meeting participation on the demand for ACS can be estimated by a simple probit model and is very similar to the marginal effect estimated with the other estimation strategies (table 8). The participants have a probability of returning an application form from 11 to 13 percent points higher compared to what it would be if they have not attended the meeting.
Table 8: Evaluation of the meeting attendance effect
Propensity score matching methods ATT
Nearest neighbor (1 - 1) 0,112** (0,0527) 4 nearest neighbors (1 - 4) 0,13*** (0,0492)
Radius 0,115*** (0,0540)
Kernel 0,121*** (0,0431)
Hirano, Imbens et Ridder (2003) 0,128*** (0,0427)
Bivariate probit model
Identification variable: meeting’s date Rho=-0,145
Likelihood-ratio test of rho=0: chi2(1)=0,10296 Prob > chi2 = 0,7483
0,112*** (0,0414)
Probit model 0,118*** (0,0405)
Treatment : meeting attendance 125
N 1403
Statistical significance levels * 10%; ** 5%; *** 1%.
Note: Values in parentheses are the standard errors. For the propensity score matching methods values in parentheses are the bootstrapped standard errors of the coefficients estimated with 100 replications. Estimates of the methods of nearest neighbors, radius and kernel were performed using Stata command developed by Leuven and Sianesi, 2003.
ACS only poorly reaches its target population particularly because of its complexity
One important lesson of this experiment is the difficulty of establishing an information campaign on ACS, which ultimately reaches its target population with difficulty.
Despite sending a letter to all insured persons potentially eligible, less than one of five has finally returned a form to obtain ACS (with a return rate of 17%). Equally troubling, the rate of returned form and its sensitivity to the voucher amount are very similar among the 66% of the sample that were covered by CHI plan before experiment and the remaining 33% who were not initially covered. Indeed, the rate of returned forms of persons initially covered is 16.4% in the control group and 19% in the treated group 1 against 15% and 17,6% for those not covered, these differences were not significant. Similarly, we do not note any significant difference in the elasticity depending on CHI status before experiment, it is 0,23 for those initially covered against 0,21 for those not covered (table 5). This result seems very surprising because ACS appears indeed as a boon for individuals who have already incurred expenses for the purchase of a CHI plan, which one would expect a massive take-up, increased as much as the increased voucher. Finally, in the treated group 2, only 9% of those invited actually attended the briefing.
These results raise immediately the matter of the number letters that actually reached the insurees. This is obviously not known precisely, but it is likely that some addresses were erroneous; even more that mobility is closely associated with precariousness.
They also illustrate the difficulty for HIF to inform on ACS. The low success of the information campaign by letters and the complexity of ACS probably call for the use of more direct or face to face information. However, our results also show that the invitation to inquire information in the HIF offices discourages some to apply for ACS. This certainly legitimates the use of third party institutions (associations, CHI providers, social workers ...) to spread information (Chauveaud and Warin, 2009). Moreover, among the application forms returned to the HIF, only 55% were entitled to ACS and 9% of the experimented insurees finally got ACS. This refusal rate is considerable for a preselected population with regard to its resources and social benefits received by FAF. This is an essential point to take into account. The cost of applying for ACS for those potentially eligible is probably considerably strengthened by the low probability of success. This is common to all programs with access based on resources but particularly reinforced in the case of ACS, given the complexity of eligibility criteria and the narrowness of the target population.
These intuitions are confirmed by the qualitative analysis that was conducted to collect the needs and expectations of the experimented population during the meetings observations (see Wittwer et al. 2010).
6. CONCLUDING REMARKS
The results of this experiment show that the increase in the amount of the voucher slightly improves the rate of application for ACS and better targets population that are actually eligible. We can then expect a positive effect of the increased amount of ACS put in place by 1 January 2010 for eligible persons aged 50 and over (table 1). However, the additional amount is smaller than the one proposed in the context of this experiment, so that we can only expect a small-scale effect. This experiment also suggests that the central issue of ACS low take-up rate is not the CHI cost itself but most certainly that of the access to information, the cost and the complexity of the application process. However, it also shows the difficulty of reaching the target population with an information campaign by letters, such as the one implemented at the national level in 2008-2009 and the cons productive character of the invitation to a briefing. Finally the fact that eligibility is not certain is also an aggravating factor. As such, expanding the target population from 1 January 2011 may be promoting the take-up of ACS (PLFSS, 2011).
The experimental approach used in this study has the advantage of relying on the assessment of a program, implemented in vivo and therefore avoid selection issues that are usually the main difficulty in evaluating public policy. However, it is not without limit. On the one hand, the studied population is not representative of the French eligible population, the eligible population to ACS in Lille having specificities. On the other hand, the effectiveness of treatments depends on the institution conducting them and on its relationships with the insured persons, with insurees of most modest means in particular. Nothing says that the same experiment on a similar population would have the same effect in another HIF. Finally, the major drawback of an experiment is that of the
length of follow up. It is likely that the increased vouchers have a long term impact along with the slow diffusion of information, that we cannot studied because a randomized experiment is necessarily limited in time, in particular due to its cost. However this analysis will be strengthened by the use of a post survey on the same population. Moreover, it will be needed to control for unobservables to ascertain the significant effect of the information meeting.
Finally, receiving an ACS notification does not necessary mean using it to purchase CHI coverage. It will therefore be interesting, in further research, to examine the effects of the treatments on CHI coverage.
ACKNOWLEDGEMENTS
The authors are grateful to the financial support of the Haut Commissariat aux Solidarités actives contre la pauvreté (Ministère de la jeunesse et des solidarités actives) as well as to the financial support of the Risk Foundation (Health, Risk and Insurance Chair, Allianz).
APPENDIX A Description of variable set
Type Variables Description
Experimental data
Completed form returned Dummy variable=1 if insured person returned completed application form, 0 otherwise
ACS proposal Dummy variable=1 if insured person got an ACS proposal after HIF assessment, 0 otherwise
CMUC proposal
Dummy variable =1 if insured person got an ACS refusal but a CMUC proposal (in case of resources below ACS eligibility threshold) after HIF assessment
ACS refusal
Dummy variable =1 if insured person got an ACS and CMUC refusal (in case of resources above ACS eligibility cap) after HIF assessment, 0 otherwise
Meeting participation Dummy variable =1 if insured person went to the meeting, 0 otherwise (only for treated group 2)
Meeting date proposal Indicates the date of the meeting proposed in the second letter (treated group 2 only)
Socio-demographic
variables
Age Insured person
Age² Insured person
Gender Insured person Beneficiary younger than
age 3
Dummy variable=1 if insured person got at least one beneficiary under the age of 3, 0 otherwise
Health, Health care utilization and CHI coverage
Health care expenditures in 2008
0€ - 200€ 200€ – 700€ 700€ - 2000€ >= 2000€ Long term diseases care
in 2008
Dummy variable=1 if insured person got long term disease cares in 2008, 0 otherwise (LTC)
Complementary health insurance coverage in 2008 (December 31)
Dummy variable =1 if insured person is covered by a CHI in 2008, 0 otherwise
Complementary health insurance coverage after experiment (September 30, 2009)
Dummy variable =1 if insured person is covered by a CHI after experiment, 0 otherwise
CMUC coverage in 2007 (December 31)
Dummy variable =1 if insured person is covered by CMUC in 2007, 0 otherwise
HIF scheme
Salaried worker Disability allowance Old age pension Unemployed
APPENDIX B
Likelihood of meeting attendance (treated group 2)
Variable O.R. Age 1,14*** Age² 0,99*** Woman 0,83 HIF scheme Employed Réf Disability allowance 0,66 Retired 0,63 Unemployed 0,91
Beneficiary under age 3 1,52
CMUC coverage in 2007 0,90
CHI coverage in 2008 0,65**
Long-term illness care in 2008 1,20
Ambulatory healthcare expenditures in 2008
< 200€ 0.59*
200€ - 700€ 0.46**
700€ - 2000€ 0.96
>= 2000€ Réf.
N 1403
Statistical significance levels * 10%; ** 5%; *** 1%.
Note : Logistic regression of the probability of attending the briefing (dummy variable : 1 the insuree attended the briefing, 0 otherwise). Odds Ratios.
REFERENCES
Abadie A., Drukker D., Leber Herr J. et Imbens G.W. (2004), « Implementing matching estimators for average treatment effects in Stata », Stata Journal, vol. 4, n° 3, pp. 290-311.
Arnould M-L. et Vidal G. (2008), « Typologie des contrats les plus souscrits auprès des complémentaires en 2006 », Etudes et Résultats, n°663.
Auerbach D, Ohri S. 2006. Price and Demand for Non-Group Health Insurance. Inquiry 43(2): 122-134. Caliendo M, Kopeinig S. 2008. Some Practical Guidance for The Implementation of Propensity Score matching. Journal of Economic Surveys, 22(1) : 31-72.
Chauveaud C, Warin P. 2009. Favoriser l’accès aux soins des bénéficiaires de minima sociaux. Expliquer la CMU-C et l’ACS aux populations potentiellement éligibles. Odenore collection Etude, 32. Desprès C. 2010. La Couverture maladie universelle, une légitimité contestée : analyse des attitudes de médecins et dentistes à l’égard de ses bénéficiaires. Pratiques et Organisation des soins. 41(1) :33-43.
Elbaum M. 2008. Participation financière des patients et équilibre de l’Assurance maladie. Lettre de
l’OFCE. 301.
Fonds CMU. 2008. L’aide à la complémentaire santé en 2007. Rapport du Fonds CMU au
Gouvernement sur l’évolution du prix et du contenu des contrats ayant ouvert droit à l’aide complémentaire santé en 2007 (en application de l'article L.863-5 du Code de la Sécurité Sociale).Juin
2008.
Fonds CMU. 2009. Rapport d’activité 2008 du Fonds CMU, 13 mai 2009, http://www.cmu.fr/userdocs/Rapport%202008.pdf
Fonds CMU. 2010. L’aide à la complémentaire santé en 2009. Rapport du Fonds CMU au
Gouvernement sur l’évolution du prix et du contenu des contrats ayant ouvert droit à l’aide complémentaire santé en 2009 (en application de l'article L.863-5 du Code de la Sécurité Sociale).Juin
2010.
Fonds CMU. 2010. Bénéficiaires de l'ACS. Séries mensuelles des attestations délivrées et
trimes-trielles des attestations utilisées. septembre 2010, http://www.cmu.fr/userdocs/PrevACS.02.09.pdf.
Givord P. 2010. Méthodes économétriques pour l’évaluation de politiques publiques. Document de travail de la Direction des Études et Synthèses Économiques de l’INSEE. n°G 2010/08.
Guthmuller S., Jusot F. Wittwer J., Desprès C. (2010), „le recours à l’Aide complémentaire santé : les enseignements d’une expérimentation sociale à Lille », Document de travail Irdes n° 36. 2010/12 Guthmuller S., Jusot F. Wittwer J., Desprès C. (2011), „le recours à l’Aide complémentaire santé : les enseignements d’une expérimentation sociale à Lille », Document de travail LEDa-LEGOS, à paraître en ligne : www.legos.dauphine.fr
Grignon M, Kambia-Chopin B. 2009. Income and the Demand for Complementary Health Insurance in France. Document de travail Irdes. DT24.
Heckman JJ, Ichimura H, Todd P. 1998. Matching as an econometric evaluation estimator. Review of
Economic Studies. 65(2): 261-294.
Heckman JJ, Ichimura H, Todd PE. 1997. Matching as an econometric evaluation estimator: Evidence from evaluating a job training program. Review of Economic Studies. 64(4):605-654.
Hernanz V, Malherbet F, Pellizzari M. 2004. Take-up of welfare benefits in OECD countries: review of the evidence. Document de travail de l’OECD, sur les affaires sociales, l'emploi et les migrations. 17. Hirano K, Imbens GW, Ridder G. 2003. Efficient estimation of average treatment effects using estimated propensity score. Econometrica. 71(4): 1161-1189
Imbens GM, Wooldridge JM. 2009. Recent Developments in the Econometrics of Program Evaluation.
Journal of Economic Literature. 47(1) :5-86.
Jusot F, Wittwer J. 2009. L'accès financier aux soins en France : bilan et perspective. Regards croisés
sur l’économie. 5(1) :102-109.
Kambia-Chopin B, Perronnin M, Pierre A, Rochereau T. 2008. La complémentaire santé en France en 2006 : un accès qui reste inégalitaire. Résultats de l’Enquête Santé Protection Sociale 2006 (ESPS 2006). Questions d’économie de la santé. 132.
Legal A, Jusot F, Wittwer J. 2008, La complémentaire santé : un bien normal ?, communication lors des 30è Journées des Économistes de la Santé Français, Paris, 4 et 5 décembre 2008, http://www.ces-asso.org/docs/articles_JESF2008/legal_a.pdf.
Leuven E, Sianesi B. 2003. psmatch2: Stata module to perform full Mahalanobis and propensity score matching, common support graphing, and covariate imbalance testing, http://ideas.repec.org/c/boc/bocode/s432001.html., version 4.0.2.
Lollivier S. 2006. Econométrie avancée des variables qualitative. Economica. Paris
PLFSS. 2011. Projet de loi de financement de la sécurité sociale pour 2011. http://www.securite-sociale.fr/chiffres/lfss/lfss2011/2011_plfss.pdf
Revil H. 2008. Identifier des populations en non-recours aux dispositifs de l'Assurance maladie : proposition de méthode. Recherches et Prévisions. 93 :102-109.
Rosenbaum PR, Rubin DB. 1983. The central role of the propensity score in observational studies for causal effects. Biometrika. 70:41-55.
Roy AD. 1951. Some Thoughts on the Distribution of Earnings. Oxford Economic Papers, New Series. 3(2):135-146.
Rubin DB. 1974. Estimating causal effects of treatments in randomized and nonrandomized studies.