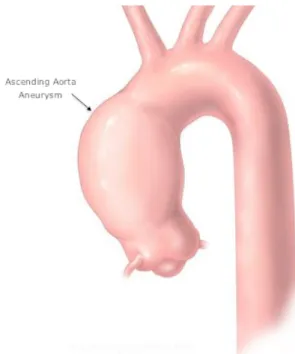
Ascending Aorta Parametric Modeling and Fluid Dynamics Analysis in a Child Patient with Congenital BAV and Ascending Aorta Aneurysm
123
0
0
Texte intégral
Figure

+7


Documents relatifs
