A review of high contrast imaging modes for METIS
Matthew A. Kenworthy
a, Olivier Absil
b, Brunella Carlomagno
b, Tibor Ag´ocs
c, Emiel H. Por
a,
Steven Bos
a, Bernhard Brandl
a, and Frans Snik
aa
Leiden Observatory, Leiden University, P.O. Box 9513, 2300 RA Leiden, The Netherlands
bSpace sciences, Technologies, and Astrophysics Research (STAR) Institute, Universit´e de
Li`ege, 19c all´ee du Six Aoˆ
ut, B-4000 Sart Tilman, Belgium
c
NOVA Optical Infrared Instrumentation Group at ASTRON, P.O. Box 2, 7990 AA, The
Netherlands
ABSTRACT
The Mid-infrared E-ELT Imager and Spectrograph (METIS) for the European Extremely Large Telescope (E-ELT) consists of di↵raction-limited imagers that cover 3 to 14 microns with medium resolution (R⇠ 5000) long slit spectroscopy, and an integral field spectrograph for high spectral resolution spectroscopy (R ⇠ 100, 000) over the L and M bands. We present our approach for high contrast imaging with METIS, covering di↵rac-tion suppression with coronagraphs, the removal of residual aberradi↵rac-tions using QACITS1,2 and Phase Sorting
Interferometry (PSI),3 and simulations demonstrating the expected contrast.
Keywords: ELT, high contrast imaging, coronagraphs, thermal IR
1. INTRODUCTION
This paper details the high contrast imaging (HCI) modes of METIS,4,5 used in the cases where noise caused
by the di↵raction halo of a star is the dominant noise source for a given region of the science image. HCI is used mostly for the direct imaging and characterization of faint point sources and extended structures around stars, typically low mass stars, thermally self-luminous exoplanets, circumstellar disks and associated structure therein. The HCI modes for METIS cover both imaging (for detection, photometric variability and characterization) and spectroscopy (for atmospheric modeling, chemical characterization and orbital dynamics). The coronagraphs are used for imaging in the L, M and N bands, and for the high spectral resolution mode in the L/M band integral field unit, and all have small inner working angles (IWAs) that exploit the large aperture of the Extremely Large Telescope and extreme performance of the adaptive optics system. We describe the optical layout and location of the optical components for the HCI modes along with the expected coronagraphic performances.
2. LAYOUT
We represent the detailed optical design of METIS6 with a “Tube map” of the optical components relevant to
the Tube diagram, observing mode names and optics. Figure1 shows this schematic, starting at the left with the ELT primary mirror M1. Due to the requirement of replacing and recoating mirrors during the operation of the telescope, the primary mirror may have unphased segments that result in an incomplete pupil. Adaptive correction is provided by the adaptive mirror M4, which has actuators used to deform the mirror surface in response to commands from the adaptive optics control system. Further mirrors then pass the light into the METIS dewar, and form a focal plane image at ELT-FP1. The first set of reimaging optics in METIS are referred to as Common Fore Optics (CFO) through which the telescope beam is transmitted. From this point on all optics are in vacuum at cryogenic temperatures. The focal plane is reimaged to a cold stop at CFO-PP1 where a mechanical wheel can place di↵erent masks into the beam. A K mirror acts as the derotator, rotating the observed sky image with respect to the downstream optics. The CFO forms a focal plane image at CFO-FP1 and then a dichroic reflects light shorter than 3 microns into the Wavefront Sensor optical train and all the
longer wavelength light is then reimaged into a pupil image at CFO-PP2 where a fast cryogenic chopping mirror provides the ability for rapid beam steering and chopping.
A second focal plane is formed at CFO-FP2 and then a dichroic splits light between two camera channels, the LM IMG camera and the NQ IMG camera. After the dichroic there is a pupil location in each of the camera channels, LM-PP1 and NQ-PP1, before the final focal plane images are formed at LM IMG and NQ IMG.
3. OBSERVING MODES
Two coronagraphic architectures are in the baseline design for METIS - a vortex phase mask coronagraph (VPM) realized with an Annular Groove Phase Mask (AGPM) and matching Lyot mask, which can be additionally combined with a Ring Apodizer (RA) in a pupil plane to form a Ring Apodized Vortex Coronagraph (RAVC). The RAVC is sensitive to tip tilt errors that are above the bandwidth of the adaptive optics (AO) system, but it allows for a wide search space around a target star in to an IWA of 1.1 /D. Atmospheric dispersion increases with increasing zenith angle of the stellar target, and the resultant dispersion of the star PSF with wavelength results in degraded performance of the VC. To compensate for this, a series of atmospheric dispersion correctors, each with a predetermined and fixed atomspheric dispersion are present in a pupil wheel next to the CFO-PP1. These provide adequate atmospheric dispersion compensation to ensure minimal degradation of VC performance. A pupil plane only coronagraph called the Apodizing Phase Plate (APP) coronagraph is realized in METIS as a grating vector Apodizing Phase Plate (gvAPP) coronagraph, enabling lower throughput and larger IWA (typically 1.5 2.0 /D) but more reliable coronagraphic performance and enabling beam switching during observation cycles.
3.1 The grating vector Apodizing Phase Plate coronagraphs
The grating vector Apodizing Phase Plate coronagraph (gvAPP)7 is a realization of an APP coronagraph8,9
using vector phase to implement the phase pattern on the pupil of the telescope.10
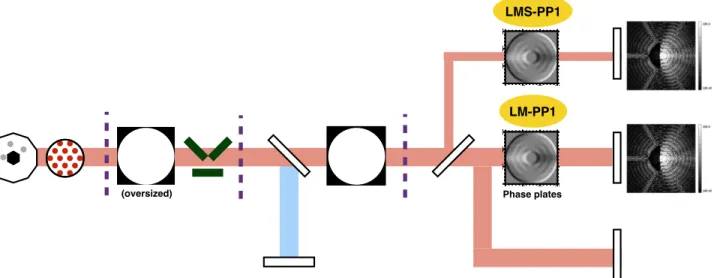
Figure 2 shows the locations of gvAPP coronagraphs in METIS. The gvAPP consists of one optic in one of the pupil planes for METIS. The LM band imager has one gvAPP at the IMG-PP2 location, splitting the PSF of the star into three PSFs, two PSFs with a dark ‘D’ shaped region on opposite sides of it. Each PSF contains about 49% of the total flux of the star. A third PSF, called the ‘leakage PSF’ contains about 2% of the total flux of the star and acts as a photometric and astrometric reference for characterization of the companion’s variability and angular separation/orientation with respect to the (often) saturated coronagraphic PSF core.
ELT Primary M1
Cold Stop Derotator
WFS Camera Chopper LM IMG Cameras LMS R~100,000 ELT M4 (deformable) CFO-PP1 CFO-FP1 CFO-PP2 CFO-FP2 ELT-FP1 LMS-PP1 LM-PP1 NQ-PP1 LMS Beamsplitter NQ IMG Cameras
METIS
Figure 1. The schematic map of METIS showing the location and names of the pupil and focal planes used in HCI, and the names of the optics in the light path.
LM IMG
Cameras
LMS
R~100,000
– 12 –
Fig. 5.— Comparing the effect of manufacturing errors on the VLT APP. The upper row shows hV LT AP P, the ideal APP phase surface, and its resultant PSF. The bottom left-hand image shows the measured APP PSF as seen in the Fomalhaut data reduction, and the bottom right-hand image shows the calculated APP PSF including the manufacturing errors of h(r) as seen in Figure4. Note the brightening of the first and second Airy rings above the theoretical levels. The Fomalhaut data has an uncorrected halo of light from the NaCo system operating at 80% Strehl ratio.
Phase plates
METIS APP coronagraph
(oversized)
LMS-PP1
LM-PP1
– 12 –
Fig. 5.— Comparing the effect of manufacturing errors on the VLT APP. The upper row shows hV LT AP P, the ideal APP phase surface, and its resultant PSF. The bottom left-hand image shows the measured APP PSF as seen in the Fomalhaut data reduction, and the bottom right-hand image shows the calculated APP PSF including the manufacturing errors of h(r) as seen in Figure4. Note the brightening of the first and second Airy rings above the theoretical levels. The Fomalhaut data has an uncorrected halo of light from the NaCo system operating at 80% Strehl ratio.
Figure 2. The schematic map of METIS showing the location of the gvAPPs for LM imaging and LM spectroscopy.
For operation of the LM spectrograph, a beamsplitter is introduced just behind the location of CFO-FP2 and a circular field of 3 arcseconds in diameter is sent towards the LM spectrograph optics. There, a gvAPP sits at LMS-PP1 and produces the three PSFs. The dark zone for the LMS gvAPP is designed so that there is a rectangular hole that matches the aspect ratio of the image slicer, currently baselined at a shape of 0.5 by 1.0 arcseconds.
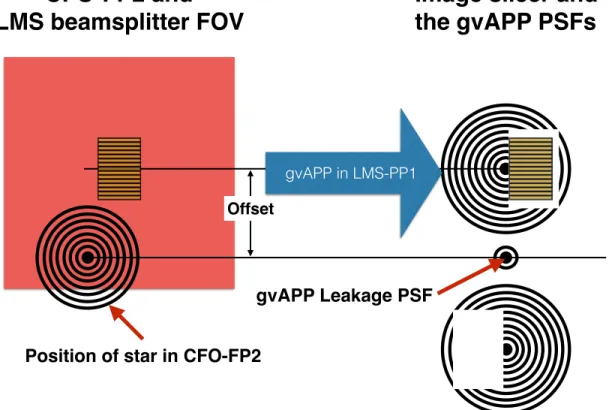
However, the APP has intrinsic limitations; likely the most pressing is that the light in the central core of the PSF is not blocked, leading to very high intensities in the focal plane at the location of the star. For operation with the LMS this implies that the star needs to be located next to the image slicer (see Figure3), since positioning it inside the image slicer field of view would lead to very high levels of stray light. The field of view of METIS is relayed from the entrance window through the common fore optics (CFO) through to the imagers in METIS. To send light from the CFO into the LMS, a partially transmitting beamsplitter or mirror is inserted into the beam just behind the nominal location of CFO-FP2, see Figure4.
The reflected light then passes into the fore-optics of the LMS. Mechanical constraints at the location of CFO-FP2 mean that the field of view is truncated from 20 arcseconds to 3 arcseconds. One proposed design for the beamsplitter pick-o↵ mount is seen in Figure4. A square beamsplitter is assumed in this drawing (a circular field-of-view will be used in practice).
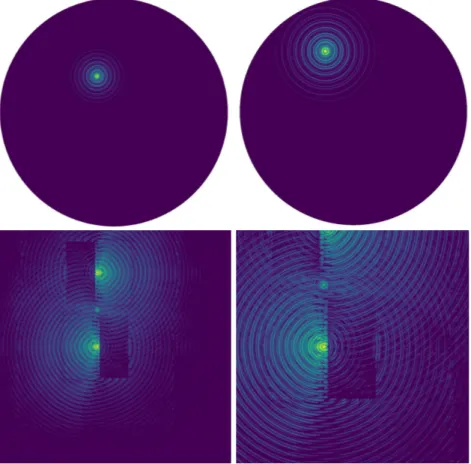
The reflection of this PSF through the beamsplitter means that this PSF is truncated at several tens of di↵raction widths, and the larger radii di↵raction rings of the PSF are removed, resulting in a modification of the incident wavefront. This has the e↵ect of modifying the wavefront incident on the APP coronagraph in the LMS-PP1, and so the coronagraphic e↵ect of the APP coronagraph is diminished. The dark region produced by the coronagraph begins to fill in with light, impacting the sensitivity of the instrument. We design a gvAPP that has a rectangular dark zone, and produces three PSFs, two coronagraphic PSFs that are displaced to either side of the undeviated “leakage term PSF” by 30 /D. The separation of the two coronagraphic PSFs scales linearly with wavelength, and so to keep the dark hole of one of the coronagraphic PSFs centred on the image slicer, an o↵set in the position of the star on the beamsplitter has to be added. The o↵set position from Figure3changes with wavelength as well, and this is seen in Figure5for 3 microns and 5 microns. We determine the magnitude of this impact by simulating a circular beamsplitter with diameter of 3 arcseconds at CFO-FP2, removing the Airy di↵raction ring structure outside this aperture, and then using Fourier transforms to see the e↵ect on the resultant APP coronagraphic PSF. The resultant position of the gvAPP PSF for this o↵set is shown in Figure5. The suppression factor in the dark rectangular region is dependent on the presence of the Airy rings in the upstream focal plane. The beamsplitter removes the outermost Airy rings, and so the rectangular region fills in with speckles, reducing the contrast, as can be seen in Figure 6. For large circular beamsplitters, the
CFO-FP2 and
LMS beamsplitter FOV
Offset
gvAPP in LMS-PP1
Image slicer and
the gvAPP PSFs
Position of star in CFO-FP2
gvAPP Leakage PSF
Figure 3. Cartoon showing the METIS PSF o↵set required at the LM beamsplitter (red square) so that one of the resultant gvAPP PSFs (three separate PSFs - a central “leakage” PSF and two o↵set coronagraphic PSFs) is placed on the image slicer (yellow rectangle) in the LMS.
Input parameters / boundary conditions
•Paraxial analysis •CFO FP2 F-ratio: 17.7
•LMS FOV: 3” x 3” (10mm x 10mm) •LMS pickoff size: 26mm x 30mm
•LMS pickoff beamsplitter thickness: 4mm •LMS pickoff beamsplitter material: CaF2 •LMS pickoff beamsplitter tilt: 45deg •IMG LM F-ratio: 19.3
•Beamsplitter surface 1 vertex is 20mm from FP2
IMG space envelope starts CFO FP2
Vignetting mechanical structure, BUT better mounting, stiffness, stability
IMG LM FOV (10” x 10” square) Mechanical frame Beam footprint LMS pickoff substrate (e.g. CaF2) View from CFO FP2
downstream towards LMS pickoff
LMS pickoff mount 3” x 3”
Figure 4. Left. Three dimensional view of LM pick-o↵ beamsplitter. Light from the CFO comes down from the top through CFO-FP2 in this image, and hits the beamsplitter. A square geometry is assumed in this drawing. Right. Proposed LM Picko↵ schematic. This shows the view looking from CFO-FP2 towards the LMS and imager. This is with the LMS pick-o↵ substrate inserted into the beam, and the 3 arcsecond FOV beam footprint (red square) sending the light from the imagers towards the LMS.
Figure 5. Upper row: The position of the METIS PSF in the field of view of a circular beamsplitter that has a diameter of 3 arcseconds, at a wavelength of 3µm (left) and 5µm (right). Lower row: The resultant images in the LMS focal plane showing the suppression region over the image slicer in the middle of the FOV.
Figure 6. Radial intensity profile of the PSF as seen at the image slicer in the LMS with circular beamsplitters of di↵erent diameters and an o↵set of 25 /D. The wavelength of the simulation is 5 microns. The x-axis is in units of di↵raction widths /D and the y-axis is normalised intensity. For large circular beamsplitters, the radial intensity profile is close to the ideal case. Simulation by E. Por.
radial intensity profile is close to the ideal gvAPP pattern. As the diameter of the beamsplitter is reduced, the di↵raction pattern in the dark hole is filled in with speckles. For METIS, the diameter of the beamsplitter will be set to 3 arcseconds, which corresponds to a dark hole with 10 4.9 speckles. This is lower than the expected
wind driven halo from the AO system.
3.2 Ring Apodized Vortex Coronagraph
Ring apodizer LM IMG Cameras LMS R~100,000 CFO-PP1 CFO-FP2 NQ IMG Cameras
METIS vortex coronagraph
Vortex phase mask Lyot stops LMS-PP1 LM-PP1 NQ-PP1
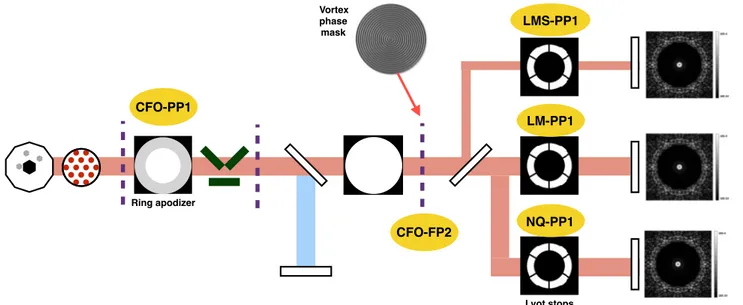
Figure 7. The schematic map of METIS showing the locations of the RAVC optics.
While a vortex coronagraph provides in principle a perfect on-axis rejection for an obstructed pupil, the presence of a central obstruction leads to an amount of stellar leakage that scales as the square diameter ratio between the outer and inner edges of the pupil. Due to the very large central obstruction of the ELT (about 30% of the outer pupil diameter), this leakage term would amount to almost 10% in a nominal vortex coronagraph design. There are two main ways to mitigate this e↵ect. The first one is to enlarge the size of the central obstruction at the Lyot stop plane, since most of the starlight di↵racted into the pupil by the central obstruction appears close to the edge of the central obstruction. This can only lead to a partial mitigation of the problem. A more efficient solution is to include a greyscale apodizer in an upstream pupil plane. Mawet et al.11 have
shown that there exists an analytical solution to this apodization problem in the form of a ring-like apodizer, thereby creating a Ring-Apodized Vortex Coronagraph (RAVC). Figure8illustrates the gain in terms of starlight rejection provided by the RAVC. The remaining leakage of about 1.5⇥ 10 3 is due to the presence of spider
arms in the telescope pupil. The gain in terms of starlight rejection comes at the expense of throughput. The RAVC is the baseline design for the vortex coronagraph in METIS, although a simple vortex coronagraph without apodizer will also be used, especially for faint targets and at the longest wavelengths, where throughput becomes more important than starlight rejection. The METIS RAVC is comprised of three optics: a circularly symmetric grey apodizer located at CFO-PP1, a vortex phase mask located at the focal plane CFO-FP2 which provides a charge-2 phase retardation for on-axis light, and then a Lyot pupil stop made as a binary mask at a pupil plane in the imagers (LM-PP1, NQ-PP1) or LM spectrograph optics (LMS-PP1). An illustration of the pupil planes relevant to the RAVC design in METIS is given in Figure9.
The vortex and ring-apodized vortex coronagraphs will be paired with both imagers (LM and NQ) and with the integral field spectrograph. In the latter case, the vortex position will be fixed at the center of the image slicer, enabling the smallest possible inner working angle in the “high contrast spectroscopy” mode.
An important aspect of mid-infrared observations is the subtraction of the background emission produced by the sky and the telescope. The method used to monitor the background emission di↵ers depending on the operating wavelength. At LM bands, where the background emission is still reasonably low, a sufficient accuracy
CI V'!
,h,. 0.7 0.6 0.5 0.4 0.3 Lyot stop Inner radius a.+;;;;/
![C7r 41, g.\;Ju
4).7lÌim lñÏ w
L/ i
*It
Il o iPt
0
4001*
Figure 8. Stellar leakage as a function of throughput for a classical vortex coronagraph (red curve) and a ring-apodized vortex coronagraph (star) on the ELT/METIS pupil. For the classical vortex, the balance between stellar leakage and throughput can be changed by modifying the size of the central obstruction in the Lyot stop plane (see top axis labels in red). A reasonable tradeo↵ between leakage and throughput is highlighted with dotted lines.
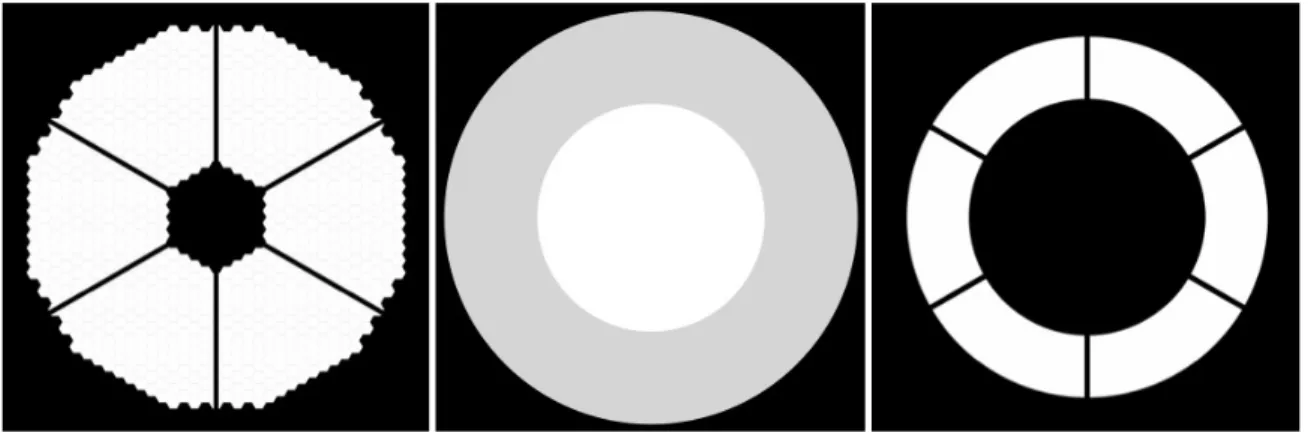
Figure 9. The telescope pupils used in the RAVC design. From left to right: the ELT input pupil, the grey apodizer placed at CFO-PP1, and the Lyot stop at LMS/LM/NQ-PP1. Note that the grey apodizer is slightly oversized to allow for drifts of the ELT pupil with respect to the METIS entrance pupil.
(II S
METIS chopper operation with the vortex coronagraph Doc. number 1-0 06/04/2018
Page 5 of 6
the SCAO closed loop, this offset will be performed by the chopper. After the sky measurement is performed, the star will be placed back at the centre of the VPM by the chopper, with an accuracy of ~1 mas (repeatability), which is largely sufficient to close the QACITS loop right away, and marginally sufficient to continue the vortex observations without the need for additional fine-tuning of the pointing (we will probably prefer to wait for QACITS to close the loop first to ensure sub-mas alignment).
3.2.2 N-band chopping between two VPMs
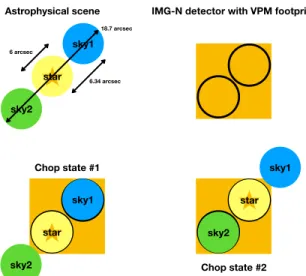
For N-band operations, high-frequency chopping is required not only to monitor the fluctuations of the sky emission, but also to mitigate the effect of excess low-frequency noise (ELFN) in the Aquarius detector. For this reason, two identical VPMs will be installed side-by-side in the same mount in CFO-FP2 to enable fast chopping of the star between the two VPM centres. The data taken with either VPM in the absence of starlight will be used to perform background subtraction from the science data, as illustrated in Figure 1.
Figure 1: Chopping pattern between the two N-band VPMs installed side-by-side at CFO-FP2. The orange square represents the Aquarius detector, while the black circles denote the edge of the VPMs footprint. The main requirement on the chopper related to N-band coronagraphic operations is that the amplitude of the chop throw should be stable and repeatable to within about 1 mas r.m.s. (0.02 λ/D at N band), in order to make it compliant with the expected accuracy of the QACITS closed-loop pointing control. This will ensure that the chopper does not degrade the coronagraphic performance. Note that a slow, global drift of the two chopped positions is not a problem, as it would be sensed by QACITS and fed back to M4 through the SCAO. It is only the chop throw that needs to be stable.
Furthermore, the chop throw should coincide with the angular separation between the two VPM centres (about 6.34”) to within about 1 mas, as described in E-TNT-NOVA-MET-1040.
Astrophysical scene IMG-N detector with VPM footprint
sky2 sky1 star sky2 sky1 star sky2 sky1 star 6.34 arcsec 6 arcsec Chop state #1 Chop state #2 18.7 arcsec
Figure 10. Chopping pattern between the two N-band VPMs installed side-by-side at CFO-FP2. The orange square represents the Aquarius detector, while the black circles denote the edge of the VPMs footprint.
in background subtraction can be obtained through a combination of background estimation on the science frames themselves and dedicated background measurements (see e.g. Hunziker et al. 2018). High-frequency chopping is not required to monitor the sky emission at these wavelengths. When observing in ADI mode with LM-band vortex coronagraphy, accurate sky subtraction is generally performed based on the science frames themselves, at the same time as PSF subtraction, using e.g. ADI-PCA post-processing techniques. However, it is generally preferable to have the mean sky emission removed prior to ADI-PCA processing. Subtracting the sky background prior to post-processing becomes even mandatory for RDI-based post-processing, where the PSF is reconstructed from reference star observations (where the star/background flux ratio is generally not the same as for the science target). For all these reasons, we require the sky and telescope background emission to be measured every 10 min (timescale to be defined during commissioning this cadence may change depending on atmospheric conditions). This measurement will be performed by placing the image of the star outside of the field-of-view of the vortex coronagraph, which is about 6 arcsec in diameter. To make sure that no starlight a↵ects the background measurement, the star should be moved at least 5 arcsec away from the centre of the VPM. After the sky measurement is performed, the star will be placed back at the centre of the VPM by the chopper, with an accuracy of about 1 milliarcsecond (repeatability).
For N-band operations, high-frequency chopping is required not only to monitor the fluctuations of the sky emission, but also to mitigate the e↵ect of excess low-frequency noise (ELFN) in the Aquarius detector. For this reason, two identical VPMs will be installed side- by-side in the same mount in CFO-FP2 to enable fast chopping of the star between the two VPM centres. The data taken with either VPM in the absence of starlight will be used to perform background subtraction from the science data, as illustrated in Figure10.
The main requirement on the chopper related to N-band coronagraphic operations is that the amplitude of the chop throw should be stable and repeatable to within about 1 mas r.m.s. (0.02 /D at N band), in order to make it compliant with the expected accuracy of the QACITS closed-loop pointing control. This will ensure that the chopper does not degrade the coronagraphic performance. Note that a slow, global drift of the two chopped positions is not a problem, as it would be sensed by QACITS and fed back to M4 through the SCAO. It is only the chop throw that needs to be stable. Furthermore, the chop throw should coincide with the angular separation between the two VPM centres (about 6.34 arcsec) to within about 1 milliarcsecond.
4. NCPA MITIGATION
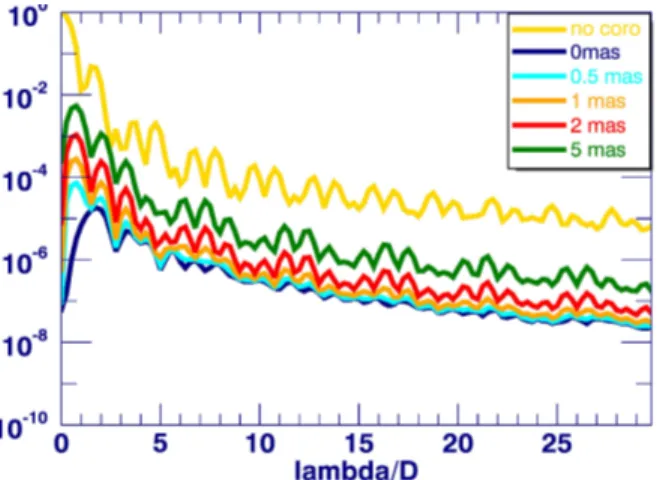
The suppression of Vortex Coronagraph decreases as the star moves o↵ the central spot of the VPM. This is shown in Figure11for di↵ering values of star misalignment from the central spot of the VPM. The suppression
S
Radial Profile (RAVC_EEopt norma max 1) MEAN
10° I I I I I I I I I I I I I I I I I I I
- Omas
- 0.5 mas-1 mas
-2 mas
-5 mas
10° 1010IIIIIIIIIIIIIIIIIIIIIIIIIII1
5 10 15 20 25 lambda /DQACITS principle and requirements Doc. number 0-3 10/08/2017
Page 2 of 8
Figure 1: Vortex suppression as a function of centroid displacement, using the METIS RAVC design at L band with an otherwise perfect wave front (simulations performed by B. Carlomagno on 4 Aug 2016, using a co-rotating circular cold stop at CFO-PP1 with thin spiders)
Although the SCAO will deliver excellent pointing stabilization, slowly drifting non-common path errors between the SCAO WFS and the science camera require the pointing error to be monitored at the position of the VPM, and corrected. Furthermore, on-sky experience has demonstrated that manual alignment of the star onto the VPM is not straightforward, and error prone. In particular, the influence of the central obstruction on the shape of the residual diffracted starlight on the camera leads to a non-intuitive relationship between the asymmetry in the image and the pointing error, which can lead the user to a wrong set point (Huby et al. 2017).
For these reasons, a method has been developed to measure the pointing error based solely on the images obtained by the scientific camera. This method, referred to as QACITS (Quadrant Analysis of Coronagraphic Images for Tip-tilt Sensing), can be used both for the initial acquisition and alignment of the star onto the VPM, and as a means to build up an error signal in a closed-loop pointing control algorithm.
3 P
RINCIPLE AND LIMITATIONS OF
QACITS
The principle of QACITS is to divide the focal plane image into four quadrants around the optical axis of the vortex coronagraph, and to measure differential intensities in these four quadrants to infer the pointing error. The differential intensities are shown to be related to the 2D pointing error through a cubic law, which can be inverted to produce a unique solution giving the pointing error as a function of the measured differential intensities (Huby et al. 2015). In the absence of central obstruction, this relationship is simple and monotonic, so that any given differential intensity corresponds to one and only one possible pointing error. This convenient property however disappears in the presence of a central obstruction. Nevertheless, Huby et al. (2015) show that the pointing error can still be recovered from the measured differential intensities if they are measured in two regions: an inner circular region typically 1.6 λ/D in radius, and an outer, annular region beyond 1.6 λ/D (their sizes depend
Figure 11. The change in suppression of the RAVC as a function of angular separation of the VPM from the stellar PSF. The y-axis is in intensity units normalised to the direct imaging PSF.
decreases from about 10 5 to10 2.2 at 1 /D for a misalignment of 5 milliarcseconds in METIS. Measuring misalignments smaller than one pixel is challenging with a VC, and so an alternative focal plane wavefront sensing method using the shape of the residual donut of light at 1 /D has been developed instead.
QACITS1,2 divides the on-axis PSF into four quadrants and senses the alignment of the RAVC using the
relative intensities of the measured values. The expected precision is around 0.02 /D with 30 secs of data on a 5th magnitude star.
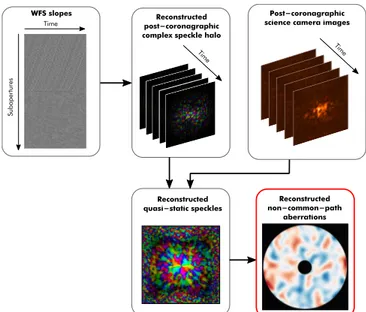
For higher order non-common path aberrations between the science camera focal planes and the wavefront sensor cameras, Phase Sorting Interferometry (PSI3) will be used. Wavefront sensor telemetry is recorded
simultaneously with science camera images that have integration times on the order of 10-100 milliseconds. The telemetry is correlated with the speckles seen in the science camera focal plane from 2 to 7 /D to produce a map of the non-common path aberrations, as shown in Figure 12. These time varying aberrations can either be used in post-processing to generate the science camera PSF for all science exposures, or dynamically applied to the deformable mirror as a static wavefront o↵set in the closed loop operation to reduce the photon shot noise introduced by long lived speckles in the dark region produced by the coronagraphs. There is no NCPA compensation planned for the LMS as the voxel spatial sizes are too large for adequate speckle sampling, and the LMS array cannot be read out fast enough to implement PSI.
5. SIMULATIONS
In order to evaluate realistic high-contrast imaging performance, we simulate angular di↵erential imaging (ADI) observing sequences in pupil tracking mode, and process the observations with classical ADI (median subtraction) or PCA-ADI algorithms to derive the sensitivity limits. These observations are simulated through an optical propagation routine, using the PROPER library, having as input a set of 6000 residual phase screens generated by the SCAO simulations. They represent only 10 minutes worth of AO residuals in standard conditions on a bright star, while a realistic contrast curve needs to be produced over a longer sequence. For this reason, the short SCAO simulation is artificially turned into a 1 hour observing sequence, by modifying the time sampling (from one screen every 100ms to one screen every 600ms). The performance estimations uses a star transiting at 20 deg from zenith, giving a total parallactic angle rotation of almost 40 deg in one hour.
Using the inputs from METIS simulator, the PROPER simulations are converted into ADU, assuming a target star of magnitude L = 5, and the thermal background is added. We multiply the PROPER simulations by the total stellar flux, and add the background emission multiplied by the transmission of all the pupil stops/apodizers in the beam. Photon noise is then added on top of each frame. Classical ADI and PCA-ADI post-processing algorithms are used to process the cubes. The noise radial profile is computed in the final image as the standard deviation of the aperture fluxes measured in as many independent resolution elements as possible at a given
?? ?? ???? ??
0
Su ba pert ures Time Time WFS slopes Reconstructed post-coronagraphic complex speckle haloPost-coronagraphic science camera images
Reconstructed quasi-static speckles Time Reconstructed non-common-path aberrations
Figure 12. Schematic showing the process of PSI in METIS.
angular separation from the star. The noise estimation takes into account the small-sample penalty.12 For
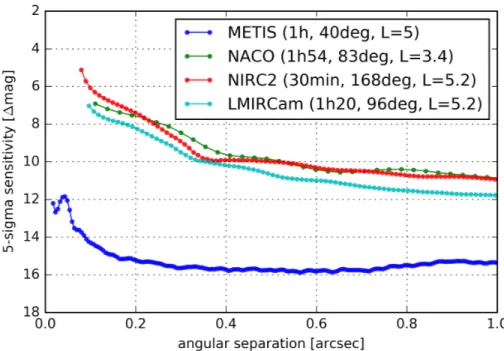
the APP, this estimation is done on the clean half of the FoV. The ADI algorithm throughput is evaluated by injecting fake companions at 10 times the noise level using the o↵-axis PSF as a template, and by comparing their flux in the final image to the injected flux level. The 5-sigma contrast curve is finally obtained by dividing the 5⇥ noise radial profile by the algorithm throughput radial profile and by the aperture photometry of the o↵-axis star (using an aperture diameter of /D). The resultant contrast curve for the RAVC is shown in Figure13, along with measured contrast curves from current high contrast imaging cameras on 8m class telescopes today.13
This comparison must however be taken with care, not only because it compares simulated to measured contrast curves, but also because our METIS simulations presented here do not capture some important contributors to high-contrast imaging performance, such as non-common path aberrations (NCPA) and atmospheric dispersion. It is our goal to increase the fidelity of the simulations in the coming months.
6. CONCLUSIONS
We have presented the latest optical layout and design for the baseline modes of METIS, and we expect these to remain the same as we work towards Preliminary Design Review in 2019. Remaining tasks for HCI preparation is the addition of realistic Non-Common Path Aberrations (NCPAs) into the simulations, to confirm that we are able to remain within the baseline requirements of the instrument.
7. ACKNOWLEDGEMENTS
The research of FS and SB leading to these results has received funding from the European Research Council under ERC Starting Grant agreement 678194 (FALCONER).
REFERENCES
[1] Huby, E., Baudoz, P., Mawet, D., and Absil, O., “Post-coronagraphic tip-tilt sensing for vortex phase masks: The QACITS technique,” A&A 584, A74 (Dec. 2015).
[2] Huby, E., Bottom, M., Femenia, B., Ngo, H., Mawet, D., Serabyn, E., and Absil, O., “On-sky performance of the QACITS pointing control technique with the Keck/NIRC2 vortex coronagraph,” A&A 600, A46 (Apr. 2017).
[3] Codona, J. L. and Kenworthy, M., “Focal Plane Wavefront Sensing Using Residual Adaptive Optics Speck-les,” ApJ 767, 100 (Apr. 2013).
2 4 6 8 10 12 14 16 18 0 U 0.2 0.4 0.6
angular separation [arcsec]
-- K4ET|S(lh'4Odeg.L=5)
°--° NACO (1h54, 83deg, L=3.4)
°--°
N|RC3/30noin'l68deg'L=5.3>
LK4|RCann(Ih2O'96deg.L=5.2)
0.8
1
Figure 13. Contrast curve for the RAVC after 1 hour of on-sky integration and assuming 40 degrees of sky rotation and no non-common path aberrations between the wavefront sensor camera and the science camera focal plane. Comparison curves extrapolates from the current 8m class telescopes are shown as blue, green and red curves.
[4] Brandl, B. R., Feldt, M., Glasse, A., Guedel, M., Heikamp, S., Kenworthy, M., Lenzen, R., Meyer, M. R., Molster, F., Paalvast, S., Pantin, E. J., Quanz, S. P., Schmalzl, E., Stuik, R., Venema, L., and Waelkens, C., “METIS: the mid-infrared E-ELT imager and spectrograph,” in [Ground-based and Airborne Instrumenta-tion for Astronomy V ], 9147, 914721 (Aug. 2014).
[5] Brandl, B. R., Ag´ocs, T., Aitink-Kroes, G., Bertram, T., Bettonvil, F., van Boekel, R., Boulade, O., Feldt, M., Glasse, A., Glauser, A., G¨udel, M., Hurtado, N., Jager, R., Kenworthy, M. A., Mach, M., Meisner, J., Meyer, M., Pantin, E., Quanz, S., Schmid, H. M., Stuik, R., Veninga, A., and Waelkens, C., “Status of the mid-infrared E-ELT imager and spectrograph METIS,” in [Ground-based and Airborne Instrumentation for Astronomy VI], 9908, 990820 (Aug. 2016).
[6] Ag´ocs, T., Brandl, B. R., Jager, R., Bettonvil, F., Aitink-Kroes, G., Venema, L., Kenworthy, M., Absil, O., and Bertram, T., “Preliminary optical design for the common fore optics of METIS,” in [Ground-based and Airborne Instrumentation for Astronomy VI ], 9908, 99089Q (Aug. 2016).
[7] Otten, G. P. P. L., Snik, F., Kenworthy, M. A., Miskiewicz, M. N., and Escuti, M. J., “Performance characterization of a broadband vector Apodizing Phase Plate coronagraph,” Optics Express 22, 30287 (Dec. 2014).
[8] Codona, J. L. and Angel, R., “Imaging Extrasolar Planets by Stellar Halo Suppression in Separately Cor-rected Color Bands,” ApJL 604, L117–L120 (Apr. 2004).
[9] Kenworthy, M. A., Codona, J. L., Hinz, P. M., Angel, J. R. P., Heinze, A., and Sivanandam, S., “First On-Sky High-Contrast Imaging with an Apodizing Phase Plate,” ApJ 660, 762–769 (May 2007).
[10] Snik, F., Otten, G., Kenworthy, M., Miskiewicz, M., Escuti, M., Packham, C., and Codona, J., “The vector-APP: a broadband apodizing phase plate that yields complementary PSFs,” in [Society of Photo-Optical Instrumentation Engineers (SPIE) Conference Series ], Society of Photo-Optical Instrumentation Engineers (SPIE) Conference Series 8450 (Sept. 2012).
[11] Mawet, D., Pueyo, L., Carlotti, A., Mennesson, B., Serabyn, E., and Wallace, J. K., “Ring-apodized Vortex Coronagraphs for Obscured Telescopes. I. Transmissive Ring Apodizers,” ApJS 209, 7 (Nov. 2013).
[12] Mawet, D., Milli, J., Wahhaj, Z., Pelat, D. and Absil, O., Delacroix, C., Boccaletti, A., Kasper, M. and Ken-worthy, M., Marois, C., Mennesson, B., and Pueyo, L., “Fundamental Limitations of High Contrast Imaging Set by Small Sample Statistics,” ApJ 792, 97 (Sept. 2014).
[13] Absil, O., Mawet, D., Karlsson, M., Carlomagno, B., Christiaens, V., Defr`ere, D., Delacroix, C., Femen´ıa Castella, B., Forsberg, P., Girard, J., G´omez Gonz´alez, C. A., Habraken, S., Hinz, P. M., Huby, E., Jolivet, A., Matthews, K., Milli, J., Orban de Xivry, G., Pantin, E., Piron, P., Reggiani, M., Ruane, G. J., Serabyn, G., Surdej, J., Tristram, K. R. W., Vargas Catal´an, E., Wertz, O., and Wizinowich, P., “Three years of harvest with the vector vortex coronagraph in the thermal infrared,” in [Ground-based and Airborne Instrumentation for Astronomy VI ], Society of Photo-Optical Instrumentation Engineers (SPIE) Conference Series 9908, 99080Q (2016).