En vue de l'obtention du
DOCTORAT DE L'UNIVERSITÉ DE TOULOUSE
Délivré par :Institut National Polytechnique de Toulouse (INP Toulouse)
Discipline ou spécialité :
Agrosystèmes, Écosystèmes et Environnement
Présentée et soutenue par :
M. AFIFUDDIN LATIF ADIREDJO
le mardi 8 juillet 2014
Titre :
Unité de recherche : Ecole doctorale :
WATER USE EFFICIENCY IN SUNFLOWER (HELIANTHUS ANNUUS L.):
ECOPHYSIOLOGICAL AND GENETIC APPROACHES
Sciences Ecologiques, Vétérinaires, Agronomiques et Bioingénieries (SEVAB) Agrosystèmes et développement territorial (A.G.I.R.)
Directeur(s) de Thèse : M. PHILIPPE GRIEU M. THIERRY LAMAZE
Rapporteurs :
M. JEAN-MARC GUEHL, INRA NANCY
M. THIERRY SIMMONNEAU, MONTPELLIER SUPAGRO Membre(s) du jury :
1 M. SYLVAIN CHAILLOU, AGROPARISTECH, Président
2 M. NICOLAS LANGLADE, INRA TOULOUSE, Membre
2 M. PHILIPPE GRIEU, INP TOULOUSE, Membre
ACKNOWLEDGEMENTS
I wish to acknowledge to French and Indonesian Governments, who gave me scholarships (Bourse du Gouvernement Français, BGF – Beasiswa Luar Negeri, BLN DIKTI) for my PhD study at University of Toulouse, France and enabled me to finish this Thesis. I also thank to my university (Brawijaya University, Malang, Indonesia) who gave me supplementary fund for my study in France.
I am heartily thankful to my supervisors, Prof. Philippe Grieu and Prof. Thierry Lamaze, who gave me the PhD project and supervised me from the initial to the final level of the research subject. I would like to thank for their patience, enthusiasm and immense knowledge.
My sincere thanks also goes to Mr. Michel Labarrere and Mrs. Patricia Nouvet and all members of the research unit of AGIR (INP-ENSAT) and LIPM laboratory (team of
genetics and genomics of abiotic and biotic stress responses) of INRA Toulouse who assisted my works in this PhD research project. I also thank all my fellow labmates for their help and support.
I would like to recognize and extend appreciation to the following members of
my PhD Thesis committee: Dr. Oliver Brendel (INRA of Nancy), Dr. Nicolas Langlade (LIPM, INRA of Toulouse), and Dr. Pierre Casadebaig (INRA of Toulouse). Their assistance and support are greatly appreciated.
I would like to thank to Rector of Brawijaya University of Malang – Indonesia (UB), Prof. Yogi Sugito; Dean of Faculty of Agriculture of UB, Prof. Sumeru Ashari, Head of Agronomy Department of UB, Dr. Nurul Aini, and Head of Plant Breeding Laboratory of UB, Prof. Lita Soetopo for their support to my study in France.
I owe my deepest gratitude to Ir. Respatijarti, MS, Dr. Damanhuri, Dr. Lily Agustina (Allahyarhamah), and all of staff and my colleagues at Faculty of
Agriculture of UB, whom I cannot express one at a time. Thank you
very much for the encouragement, advice and assistance during my study in France.
My greatest thank to my parents (at Probolinggo and Kudus), my brothers and sisters and all my family in Indonesia for their patience, wish and encouragement.
Last but not the least, deepest and special thanks to my beautiful wife, Aldila Nuris Shoumi, and my lovely children, Safa Haedar Adiredjo and Fazila Ilma Adiredjo, who always give me love, encouragement, and sacrifice. Thank you very much for your patience and faithfulness. This
This This
SOMMAIRE
L’efficience d’utilisation de l’eau (WUE), rapport entre la biomasse produite et l’eau consommée, est un trait essentiel à étudier en agronomie pour améliorer la production des cultures soumises à la sécheresse. Cependant, mesurer l’eau consommée par un couvert végétal est difficile à réaliser. L’objectif général de ce travail de thèse est de répondre à trois principales questions : (i) peut-on déterminer WUE en utilisant la discrimination isotopique du carbone (CID) facile à mesurer? (ii) comment l’analyse de la variabilité de WUE et CID peut contribuer à sélectionner des génotypes de tournesol soumis à la sécheresse? (iii) et les variations de WUE peuvent-elles être révélées par les variations de relations hydriques?
Quatre expériences ont été conduites en serre pendant deux années : (i) avec deux scenario de sécheresse, l’une progressive, l’autre stable, et (ii) avec cinq niveaux de contenu en eau du sol stables. Les principaux traits mesurés sont WUE, CID et d’autres traits représentant les relations hydriques tels que le contrôle de la transpiration (FTSWt), la capacité d’extraction de l’eau (TTSW) et la tolérance à la déshydratation (OA).
Une forte corrélation négative a été mise en évidence entre WUE et CID. Une large variabilité a également été observée pour FTSWt, TTSW et OA. Ces résultats permettent de connaitre le contrôle génétique de WUE et CID, ainsi que des traits associés, lesquels n’ont jamais été relatés dans la littérature. De plus, l’analyse QTL pour FTSWt n’a pas non plus été réalisée, chez aucune plante.
Des QTL pour WUE et CID ont été identifiés pour différents scenario de sécheresse. Les QTL pour CID sont considérés comme ‘constitutifs’, parce qu’ils sont détectés dans les différents scenarios. Les QTL pour CID co-localisent avec ceux pour WUE, pour la biomasse et pour la transpiration cumulée. Des co-localisations de QTL ont également été observées entre FTSWt et TTSW, entre TTSW et WUE-CID-Biomasse, et entre FTSWt-TTSW et Biomasse.
Cette étude met en évidence que WUE est physiologiquement et génétiquement associée à CID. De plus, CID représente un excellent substitue à la mesure de WUE et permet d’améliorer l’efficience d’utilisation de l’eau par sélection assistée par marqueurs.
SUMMARY
Water use efficiency (WUE), measured as the ratio of plant biomass to water consumption, is an essential agronomical trait for enhancing crop production under drought. Measuring water consumption is logistically difficult, especially in field conditions. The general objective of the present Thesis is to respond to three main questions: (i) can WUE be determined by using carbon isotope discrimination (CID), easy to measure?, (ii) how WUE and CID variation analysis can contribute to the genotypic selection of sunflower subjected to drought?, and (iii) can WUE variation be revealed by the variation of plant-water relation traits.
Four experiments were carried out in greenhouse across two different years: (i) on two drought scenarios, progressive soil drying and stable water-stress, and (ii) on five levels of soil water content. The main traits that have been measured include WUE, CID, as well as plant-water relation traits, i.e. control of transpiration (FTSWt), water extraction capacity (TTSW), and dehydration tolerance (OA).
A highly significant negative correlation was observed between WUE and CID, and a wide phenotypic variability was observed for both WUE and CID. A wide variability was also observed for FTSWt, TTSW and OA. The results provide new insight into the genetic control of WUE and CID related-traits, which, unlike to other crops, genetic control of WUE, CID, and TTSW in sunflower have never been reported in the literature. Further, quantitative trait loci (QTL) mapping for FTSWt was never reported in any plant species.
The QTL for WUE and CID were identified across different drought scenarios. The QTL for CID is considered as a ‘‘constitutive’’ QTL, because it is consistently detected across different drought scenarios. The QTL for CID co-localized with the QTL for WUE, biomass and cumulative water transpired. Co-localization was also observed between the QTL for FTSWt and TTSW, between the QTL for TTSW and WUE-CID-biomass, as well as between the QTL for FTSWt-TTSW and biomass.
This study highlights that WUE is physiologically and genetically associated with CID. CID is an excellent surrogate for WUE measurement, and can be used to improve WUE by using marker-assisted selection (MAS) to achieve the ultimate goal of plant breeding at genomic level.
TABLE OF CONTENTS ... i
iTABLE OF CONTENTS
ACKNOWLEDGEMENT
S SUMMARY
CHAPTER 1 INTRODUCTION ... 1
CHAPTER 2 LITERATURE REVIEW ... 4
2.1 Sunflower ... 4
2.1.1 Historical aspects and the utilization of sunflower ... 4
2.1.2 Sunflower production in France and in the world ... 4
2.2 Drought ... 6
2.2.1 Definition and characterization ... 6
2.2.2 Plant responses to drought ... 6
2.2.3 Strategy of plant in response to drought ... 10
2.2.4 Classification of crops by their response to drought ... 11
2.3 Water use efficiency in plant ... 11
2.4 Carbon isotope discrimination and water use efficiency ... 13
2.5 Genetic analysis of water use efficiency, carbon isotope discrimination and plant-water relation traits ... 14
CHAPTER 3 MATERIALS AND METHODS ... 17
3.1 Plant material ... 17
3.2 Growth conditions and experimental setups ... 17
3.2.1 Experiment in greenhouse ... 17
3.2.2 Experiment in growth chamber (“phytotron”) ... 21
3.3 Phenotypic analysis: Trait measurements ... 22
3.3.1 Water use efficiency and carbon isotope discrimination ... 22
3.3.2 Transpiration ... 24
3.3.3 Biomass ... 24
3.3.4 Plant-water relation traits ... 24
3.3.5 Root measurement ... 26
3.3.6 Other traits measurement ... 27
3.3.7 Statistical analysis ... 28
3.4 Genetic analysis ... 28
3.4.1 Heritability ... 28
3.4.2 Genetic map construction ... 28
ii
CHAPTER 4 RESULTS AND DISCUSSIONS ... 30
4.1 Genetic control of water use efficiency and leaf carbon isotope discrimination in sunflower (Helianthus annuus L.) subjected to two drought scenarios ... 30
4.2 Genetic analysis of transpiration control, water extraction capacity, and osmotic adjustment in sunflower (Helianthus annuus L.) under drought ... 70
4.3 Hydraulic conductivity and contribution of aquaporins to water uptake in roots four sunflower genotypes ... 98
4.4 Leaf carbon isotope discrimination as an accurate indicator of water use efficiency in sunflower genotypes subjected to five stable soil water contents... 115
CHAPTER 5 GENERAL CONCLUSION AND PERSPECTIVES ... 133
5.1 General conclusion ... 133
5.1.1 Can WUE be determined by using CID on sunflower? ... 133
5.1.2 How WUE and CID variations analysis can contribute to the genotypic selection of sunflower subjected to drought? ... 134
5.1.3 Can WUE variation be explained by the variation of plant-water relation traits, i.e. control of transpiration, water extraction capacity, dehydration tolerance, and root hydraulic conductance? ... 135
5.2 Perspectives ... 136
REFERENCE
S
1
1 INTRODUCTION
Sunflower (Helianthus annuus L.) has been widely regarded as a plant able to grow under low water-input regimes (Merrien et al. 1981; Connor and Jones, 1985; Unger, 1990; Chimenti et al. 2002). This ability is mainly due to deep roots able to extract or use water efficiently from the deeper parts of the soil (Connor and Hall, 1997; Mwale et al. 2003; Karam et al. 2007; Roche et al. 2009). The ability of sunflower genotypes to use water is not homogeneous and is known to be variable (Merrien et al. 1981). Nevertheless, genotypic variability of sunflower water use has rarely been explored, especially in drought condition (Poormohammad Kiani, 2007a; Casadebaig et al. 2008). Therefore, there is pressing need to understand the variability of sunflower water use for achieving the goal of genotypic selection and crop improvement program of sunflower subjected to drought.
Drought induces a range of physiological and morphological responses in plants. The main responses include: reducing water loss through stomatal control of transpiration (Yeo, 2007), accumulating of compatible solutes (Flowers, 2007), maintaining water uptake through an extensive root system (Kavar et al., 2007), protecting the roots from excessive water loss by decreasing root hydraulic conductivity (Steudle, 1994, 2000), and limiting the number and area of leaves (Schuppler et al. 1998). Intensive studies have been carried out to identify plant responses to drought for obtaining criteria for the selection of drought-tolerant plant (Price et al. 2002; Clavel et al. 2005; Martínez et al. 2007; Karaba et al. 2007; Hessini et al. 2009). Many of these criteria are not only based on plant-water relations, e.g. cumulative water transpired on a period of growth, control of transpiration, water extraction capacity, hydraulic conductivity, and dehydration tolerance, but also based on production, e.g. photosynthesis, biomass, and leaf area (Losch, 1993; Blum et al.1996; Sánchez et al. 1998; Lizana et al. 2006).
The relationship between water relations and production has generated interest for agronomist, physiologists and breeders to study the water use for crop plants (Sinclair et al. 1984; Ehleringer et al. 1993; Condon et al. 2004). In the last years, considerable efforts were made to study the physiology and the genetic control of water-use efficiency (WUE) and much attention has been devoted to the understanding of physiological processes that control this character (Condon et al. 2004; Hessini et al. 2009). WUE is traditionally defined either as the ratio of biomass accumulation to water use over a season, or as the ratio of photosynthesis
2 (A) to transpiration (E) over a period of seconds or minutes (Condon, 2004). This trait can contribute substantially to crop productivity when water is limited (Wright et al. 1994). It is suggested that a way of enhancing plant performance in drought conditions is to improve the WUE (Condon et al. 2004). However, WUE is difficult (i.e. the lack of simple method) and time consuming to measure, especially in field condition because water use is difficult to be determined in field conditions. The difficulty of measuring WUE has been overcome since Farquhar and colleagues (Farquhar et al. 1982; Farquhar and Richards, 1984) proved the negative relationship between WUE and carbon isotope discrimination (CID) in tissue of C3
plant species. CID has been demonstrated to be a simple but reliable measure of WUE, and negative correlation between them has been used to indirectly estimate WUE under selected environments (Ehleringer et al. 1993). In addition, CID is defined as a measure of the ratio of the stable isotopes of carbon (13C/12C) in plant material relative to the value of the same ratio in the atmosphere (Farquhar et al. 1989, Condon, 2004).
The genetic selection for specific physiological and morphological traits in drought environments, such as a high WUE and a low CID is seen as providing part of the solution (Fussel et al. 1991; Richards, 1996; Richards et al. 2002). Genetic selection of WUE and CID could be enhanced with a better understanding of its genetic control (Chen et al. 2011). The advancement of computational methods and DNA-based molecular markers in the late 1980s and 1990s has revolutionized the dissection of quantitative trait inheritance (Baum et al. 2007). Quantitative trait, such as WUE and CID, is governed by quantitative trait loci (QTL) (Hall et al. 1994; Mian et al. 1996; Juenger et al. 2005). The QTL analysis provides opportunities to identify and locate chromosome regions controlling WUE and CID during plant growth in water-limited conditions (Mian et al. 1998). The ultimate goal is to manipulate beneficial QTL alleles through marker-assisted selection (MAS) to derive improved sunflower genotypes and accelerate plant breeding under drought environments.
In the present Thesis, the general objectives are to respond to three questions: (i) Can WUE be determined by using carbon isotope discrimination (CID)?, (ii) How WUE and CID variation analysis can contribute to the genotypic selection of sunflower subjected to drought?, and (iii) can WUE variation be revealed by the variation of plant-water relation traits, i.e. control of transpiration, water extraction capacity, dehydration tolerance and root hydraulic conductance?. The general objectives are divided in four specific objectives that represent the objectives of four publications derived from the present Thesis: (i) to identify the genetic
3 control of WUE and CID by using QTL mapping in a population of RILs of sunflower, and to compare QTL associated with these traits in a dual drought scenario, a progressively water-stressed establishment, and a stable water deficit treatment, (ii) to investigate the physiological behaviors and to analyze the genetic control of plant-water relation traits, i.e. transpiration control, water extraction capacity and dehydration tolerance, (iii) to evaluate root hydraulic properties in four sunflower RILs differing in WUE, and (iv) to explore the possibility of using CID as an indicator to select sunflower genotypes with high WUE, by assessing the relationship between CID and WUE in four RILs of juvenile sunflowers, and by evaluating the CID and WUE at five levels of SWC which were maintained stable during the experiments.
4
2 LITERATURE REVIEW
2.1 Sunflower
2.1.1 Historical aspects and the utilization of sunflower
The domesticated sunflower was introduced from North America into Europe by the early Spanish explorers in 1510, where they initially gained popularity as a garden ornamental. The agronomic development of sunflower as an oilseed crop and for use as edible achenes (confectionery types) took place in Russia, where a number of landraces had been developed by the late 1800s. Initial selection emphasis was given to early maturity, disease and pest resistance, and high seed oil content. Sunflower was reintroduced from Russia to North America in the later part of the 19th century (Putt, 1997).
The common sunflower (H. annuus) is the most important species grown commercially, although other species are also cultivated, e.g. H. tuberosus, which is grown for production of edible tubers, and several other species grown as ornamentals. The name Helianthus is derived from the Greek words ‘‘helios,’’meaning sun, and ‘‘anthus,’’ meaning flower. The Spanish name for sunflower, ‘‘girasol,’’ and the French name ‘‘tournesol’’ literally mean ‘‘turn with the sun,’’ a trait exhibited by sunflower until anthesis, after which the capitula (heads) face east (Fernandez-Martinez et al. 2009). Wild H. annuus was used for food by the Native American Indians and, due to its association with humans, it became a camp-following weed that was introduced into the central part of the U.S., where it was domesticated and carried to the east and southwest (Heiser et al. 1969; Heiser, 1978).
Nowadays, sunflower (Helianthus annuus L.) is one of the most widely cultivated oil crops in the world (Flagella et al. 2002; List, 2014). There are two types of sunflowers: oil types containing about 40% oil and non-oil types with about 30% oil. Oil types represent 80–95% of sunflower seed production. The oil is mainly used for cooking and frying. Industrial uses include lighting, paints, cosmetics, resins, lubricants and biofuel. Non-oil types are mostly used in confectionery products such as roasted seeds (FAO, 2010; Ghobadi et al. 2013).
2.1.2 Sunflower production in France and in the world
France is the first sunflower producer in the European Union with 1.64 million tons of seeds in 2010. About 80% of the French sunflower seeds production goes for domestic uses
5 (Labalette and Raoul, 2012). Despite sunflower hectares (ha) have largely decreased during the last 20 years because of an insufficient profitability, real increases in planting have been observed since 2008 due to the Common Agriculture Policy evolution and of higher selling prices for oil crops (Jouffret et al. 2012). From 2007, sunflower cultivation increased by 35 % in France to reach 695000 ha in 2010 (735000 ha in 2011) mainly due to good prices and to a more favourable European agricultural policy (Labalette and Raoul, 2012).
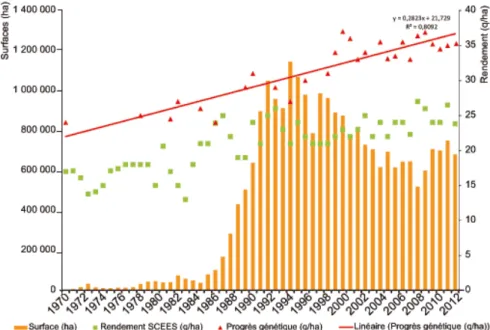
According to research of CETIOM1, sunflower cultivation has a benefit over the last 25 years, is a real genetic progress. Through a series of tests divided into the main areas of production, it has increased 0.5 q/ha per year, or 1.3% annually (Fig. 2.1). However, the gap between the potential yield and the yield in culture remains important due to some limiting factors such as water supply, date of sowing, and fungi of Phoma (Anonymous, 2013).
Figure 2.1 Margin between genetic potential and performance of culture (CETIOM, 2013).
Labalette et al. (2012) reported that the important sunflower areas in the world are Ukraine, Russia, EU-272, Argentina and Turkey. They also reported that particularly for oleic sunflower from these countries have quite doubled in five years, from around 500000 to 950000 ha. Further, the oleic types are mostly introduced in the South-Western Europe and in Hungary where their proportion reach around 30 % of the total sunflower acreage meanwhile the eastern countries starts only cultivating such types (1% of the total surfaces).
1
Centre technique interprofessionnel des oléagineux et du chanvre 2
6 2.2 Drought
2.2.1 Definition and characterization
For agronomist, a drought is defined as any lack of water which the crops could not able to express their performance and yield in a favorable conditions, or which may affect the quality of the harvested products (Ludlow and Muchow, 1990). A tolerant plant in this case is the plant that is able to produce an output (plant production or yield) as high as possible in a given drought scenario (Zhu, 2002; Alqudah et al. 2011). Drought is characterized by its intensity, dynamics (suddenly or gradually implemented), duration and time of occurrence relative to the crop cycle. These preliminary remarks have a consequence: it is very difficult experimentally to identify specific characteristics of drought which agronomist faces (Chaves et al. 2003).
Drought occurs by the combination of (i) the restriction of the availability of soil water and (ii) the increase of the evaporative demand in the air. Water crosses the plant (transpiration) due to a difference in water potential between the air and the soil (Yeo, 2007; Barnabas et al. 2008). Drought intensity at a given time can be physically characterized by water status in the atmosphere and in the soil (Sinclair and Ludlow, 1986). The water status of the air is easy to be determined. The water potential in air is linked to the degree of saturation of the air with water vapor. Another usual physical parameter is vapor pressure deficit (VPD). However, plant transpiration depends on other environmental parameters such as the wind speed. In the soil, there is a high heterogeneity of water status, and its measurement is difficult to be implemented, especially in the field (Jones, 2013). The water status of the plant is related to the difference between the flow of water that enters through the roots and which flows out of the leaves in the same time (Comstock, 2002). Thus, drought experienced by the plant is defined, at every moment, by water conditions at the terminals of the plant, soil and air (Blum, 1998).
2.2.2 Plant responses to drought
Genotypes subjected to the same water deficit do not perceive the stress in the same way. A wide range of mechanisms has been summarized by Tardieu et al. (2007). In addition, a significant genotypic variability is associated with these mechanisms in many crops, especially in sunflower species.
7
Short-term response
At the scale of a few minutes, the plant can reduce transpiration by closing its stomata that reduces stomatal conductance (gs) which determines gas exchange (CO2 and H2O) (Lauteri et
al. 1997). For sunflower, this regulation seems different according to the growth stage, before or after anthesis (Connor and Hall, 1997). Before anthesis, sunflower is known to have a stomatal closure less sensitive to drought than most other species. Therefore, plants may lose water and reduce turgor, and is called “anisohydric” (see Section 2.2.4). In contrast, after anthesis, stomatal closure is more sensitive to water stress and appears as a key process to control plant water status. The stomatal closure is often accompanied by a reduction in CO2
assimilation in the leaves (by decreasing the diffusion) and it increases the temperature of the leaves (the transpiration flow contributes to the dissipation of radiation energy) (Gollan et al. 1985; McDonald and Davies, 1996). However, in sunflower, maintaining high photosynthesis is a major process for obtaining a high yield. Poormohamad Kiani et al. (2007a) reported that there was high genotypic variability for gs and net CO2 assimilation (A) in a sunflower
population grown under field condition at Toulouse. Moreover, different thresholds for stomatal closure have also been reported by Casadebaig et al. (2008) as a function of the fraction of transpirable soil water (FTSW) that represents a normalized way to express soil water content (SWC) (see chapter 3; Materials and Methods). There was a genetic difference in genotypes performance in term of control of transpiration rate (transpiration per unit leaf area).
Regulation of gs is the major mechanism involved in the short term to limit water loss: early
stomatal closure, maintains high leaf water potential (Medrano et al. 2002). Reduction in cellular leaf elongation is one of the earliest processes affected by water stress but the instantaneous effect on water lost is weak. Different genotypes may show different leaf water potentials (Mojayad, 1993) and growth stages (Morizet and Merrien, 1990) under similar drought conditions. Regulation of gs also depends on: (i) a given instant, and (ii) the leaf
water potential and air humidity in the field. Genotypes with low gs are more sensitive to the
vapor deficit in the air and to the lower leaf water potential than genotypes with high gs. Low
gs is generally proposed as a favorable trait to adaptation to drought (Jones and Rawson,
1979; Jones and Corlett, 1992). If the stomata are not totally closed, due to the difference between the diffusion coefficients of water and CO2 in the leaf, transpiration will decrease
8 In sunflower, decrease of intercellular CO2 concentration may be accompanied
by a sustained reduction in the chloroplast efficiency to use CO2, even if subsequently the
CO2 availability is restored (D'Andria, 1995; Grieu et al. 2008). This functional alteration of
chloroplast, more or less rapidly reversible, can contribute to reduce the daily balance of A of some genotypes, following the depression of gs in mid-day or in post-drought (Wise et al.
1991).
Stomatal conductance is also closely related to the hydraulic conductivity of plant tissue, including roots (Lpr). Stomata control involves chemical type messages that pass from the
roots to the leaves by xylem sap, especially H+ (pH of the sap) (Wilkinson and Davies, 1997) and abscisic acid (ABA) synthesized by the non-dry organs (Davies and Gowing, 1991; Tardieu and Davies, 1993). Transformed plants which synthesize more of this hormone maintain a more favorable water status and survive longer in water deficit (Morgan, 1990). An important consequence of this mechanism is that the plant reduces its transpiration prior to leaf cellular dehydration (Borel et al. 2001). In sunflower, the Lpr is generally considered to
be high as compared to other field crops. Some researches in sunflower showed the important role of aquaporins, (AQPs: trans-membrane proteins) on the root Lpr (Ouvrard et al. 1996).
Trans-membrane proteins, AQPs, can modulate the path of water through cell membranes (Maurel et al. 2002; Luu and Maurel, 2005). Control of the AQPs is still imperfectly known, but it is clear that the water deficit and ABA affect the root Lpr (Socias et al. 1997; Zhu et al.
2005). Additionally, higher Lpr is associated to lower difference between the soil and leaves
water potential (Carvajal et al. 1999, Steudle, 200; Christmann et al. 2007).
Middle-term responses (hours, days)
At the scale of a few hours to a few days, the plant can maintain tissue turgor through various mechanisms. The growth process is particularly sensitive to dehydration and performance of plants subjected to water stress. It depends not only on the ability of the acquisition of water, but also on the ability of organs to maintain their physiological functions (Morgan, 1984). Maintaining turgor during water deficit contributes to limit the negative effects of water stress on gs and photosynthesis (Maury et al. 2000) as well as cell expansion (Cosgrove, 1986) and
growth (Barlow, 1986), in particular the roots (Passioura, 1983). In sunflower, osmotic adjustment (OA), the ability to actively accumulate solutes in cell vacuoles, contributes to
9 drought tolerance, mainly by allowing extraction of more water from the soil and retaining this water in the tissues (Chimenti et al. 2002).
Leaf development decreases in water deficit condition before any reduction in photosynthesis (Boyer, 1970; Sperry et al. 2001). As turgor is the driving force of growth, many genetic programs aimed at improving their maintenance at water deficit via the accumulation of solutes in the cell. Other mechanisms are involved in maintaining the growth such as cell division (Granier et al. 2000), the mechanical characteristics of cell walls (Cosgrove, 2005), maintaining a high Lpr through membrane proteins, AQPs (Tyerman et al. 2002; Maurel et al.
2008) and hormone signals (Sharp, 2002).
Long-term responses (weeks)
At the scale of a few weeks, the plant acclimates through morphological modification in addition to physiological adaptation and adjusts its transpiration by decreasing leaf area which will cause the reduction of plant production (Lambers et al. 2008). This is an adaptive mechanism which is to limit the development of leaves tissues. Similarly, a major consequence for the roots: is the maintenance of growth that allows exploring deeper soil layers where water supplies are essential (Kramer and Boyer, 1995; Hund et al. 2009).
During early drought, the decrease of leaf area is closely associated with the decrease of leaf expansion; the association is closer rather than with acceleration of leaf senescence, but, the acceleration of leaf senescence will also contribute to lower leaf area. In sunflower, this decrease may be followed by the decrease in performance if the leaf area index falls below 2.5 at flowering (Merrien and Grandin, 1990). Performance is correlated to the leaf area development after flowering, and is strongly affected when senescence is accelerated by late water deficits (Poormohammad Kiani, 2009).
The optimization of the water absorption is related to the complex of morphological characteristics of roots: mass, volume, and branching depth (Ramanjulu and Bartels, 2008). Many plants that adapt to arid area do not control their water loss through transpiration, but have very deep roots which can extract water from the soil. Root growth in dry conditions can be maintained by OA which limits the drop turgor in potential (Turner, 1986; Schachtman and Goodger, 2008). However, two types of reasons limit the use of many root criteria by breeders (Turner et al. 2001): (i) the impracticality of field screening for this feature on a large scale
10 and the difficulty of correlating field observations to those made in pots, (ii) the lack of a precise understanding of the exact role of the roots in water limited conditions is another limitation factor at the establishment of a screening system (Passioura, 1994).
2.2.3 Strategy of plant in response to drought
Several mechanisms expressed more or less effectively and occur simultaneously in plant during drought adaptation. According to the combination of mechanisms of plant response to drought, different behaviors (i.e. strategies) may be defined (Jones, 2013).
A first major way to avoid drought is “drought escape” or “drought avoidance”. Drought escape allows the plant to avoid water stress by a well adaptation of the plant cycle to length of the rainy season (Jones, 2013). The rapid development with early flowering allows the plant to avoid dry periods. This strategy was applied to crops by moving sowing date and/or select early sowing varieties to avoid water deficit at the end of growth cycle (Farooq et al. 2009). A second major and general way to adapt is the ability of plants to maintain high water status by preventing dehydration. The strategy is mainly based on: (i) reduction of transpiration (Schuppler et al. 1998; Connor, 2005), (ii) an optimization of the water absorption through the roots (Turner et al. 2001), and (iii) the ability to maintain water in cells through OA (Zhang et al. 1999). Among these strategies, reduction of transpiration (reduction in leaf area and decrease in gs) play a determinant role (Blum, 2011). In addition, maintaining
turgor under water deficit can: (i) delay stomatal closure (Mojayad and Planchon, 1994), (ii) maintain the chloroplast volume (Gupta and Berkowitz, 1987; Hubbard et al. 2001), and (iii) reduce leaf wilting (Jones and Turner, 1980; Buckley and Mott, 2002).
Dehydration tolerance (better tolerance to internal cellular water deficit) is a strategy that allows plants to perform physiological functions despite degradation of the water status or to protect cellular water content (Ludlow et al. 1983). This internal water deficit tolerance allows extending the photosynthesis function. Carbon products can then be used for OA rather than for roots growth. Another consequence of the maintenance of the carbon metabolism will be the decrease in the frequency of photo-inhibition period (Maury et al. 1996). In sunflower, there is variability for OA capacities and it depends on the genotype (Maury et al. 2000; Chimenti et al. 2002), scenarios of water deficit (Poormohammad Kiani, 2007b), and the leaf age (Jones and Turner, 1980; Sadras et al. 1993). The solutes essentially involved are inorganic ions (in the vacuole), soluble sugars, polyols, amino acids and organic acids. The
11 energy cost of such OA is lower in sunflower than in other species such as wheat, since the contribution of inorganic ions is larger (Mccree, 1986; Zhang et al. 1999).
Tolerance to drought is the result of morpho-physiological, biochemical and molecular complex mechanisms. Expression of different genes and accumulation of various osmolytes (OA) that are associated to an effective antioxidant systems are often the main mechanisms of drought tolerance. Many of these mechanisms have been characterized in different plants (Ramanjulu and Bartels, 2002).
2.2.4 Classification of crops by their response to drought
Classification of crop plants base on the physiological response to water deficit and subsequent to drought stress has grouped plants as “isohydric” and “anisohydric” (Tardieu and Simonneau, 1998; Jones, 2013). These characteristics are essential, as they influence the physiological responses observed during drought stress, and can affect the methods best suited to monitoring drought stress (Jones, 2013).
Briefly, the isohydric characteristics of plants resulted from the tight and continuous control of leaf water potential by root-to-shoot signaling through hydraulic and chemical interactions, thus managing water loss through stomata, particularly during the initial onset of water stress (Buckley, 2005). By contrast, plants that display anisohydric characteristics do maintain control over leaf water potential, but it is at diminished rate when compared to isohydric plants. In this condition, soil water content declines as well as leaf water potential until it reaches a threshold at which point stomata begin to regulate water loss (Jones, 2007, 2008).
2.3 Water use efficiency in plant
Carbon dioxide (CO2) of photosynthesis enters the leaves through the stomata, which also
control transpiration. Stomatal closure that keeps the leaf water status reduces photosynthesis and plant production. In a wide range of water deficits compatible with agronomical and physiological activities, the stomatal part is probably the most important (Cornic and Fresneau, 2002). One consequence is that photosynthesis is intrinsically linked to transpiration, and there is no way to circumvent this trade "carbon against water." This exchange is the main limitation of "drought tolerance": we may never build plants that maintain their productivity without a high level of transpiration. However, the ratio of photosynthesis to transpiration, namely leaf WUE, varies with the environmental conditions
12 and has a significant genetic variability. WUE varies not only with the climate condition but also with the species (Tardieu et al. 2007).
The relationship between water consumption and crop production has become the subject of numerous publications (Ehleringer et al. 1993, Richards et al. 2002, Condon et al. 2004, Blum, 2011). Agronomists were interested in water as a factor of production for crops (Grieu et al. 2008). They showed that there is a significant difference between species and cultivars that need water (Briggs and Shantz, 1913). They began to define the relationship between biomass gain and amount of water consumed: WUE. Then, the need to better understand the determinism of transpiration flow in the field, even in the region, led micro-meteorologists to develop models for determining evapotranspiration (Tardieu et al. 2007). Later, understanding of interactions between carbon gain (photosynthesis) and water use (transpiration), mainly at leaf level, was introduced by the work of de Wit (1958) and Bierhuizen and Slatyer (1965). Currently, all these approaches are developed in order to clarify the relationship between determinism of carbon management and water relations in plants.
WUE could be defined in many ways, depending on the scale of measurement and the units of exchange being considered. All potential definitions will have some measure of water being exchanged for some unit of production (Condon et al. 2004). For physiologists, the basic unit of production could be moles of carbon gained by photosynthesis (A) in exchange for water used in transpiration (E). Thus a physiological definition might equate, at its most basic level, at leaf level, to the instantaneous water use efficiency of leaf gas exchange (A/E) (Ehleringer et al. 1993; Donovan et al. 2007). For agronomists, WUE is defined as the ratio of total plant dry matter produced to total water used over the same period (Tanner and Sinclair, 1983). Besides, for farmers, the unit of production is much more likely to be the yield of harvested product achieved from the water made available to the crop through precipitation and/or irrigation (Condon et al. 2004).
To summarize, the term of WUE in plant can be classified in two levels and scales: (i) leaf level = photosynthetic scale (Farquhar and Richards, 1984; Ehleringer et al. 1993; Bacon, 2004) and (ii) crop level = agronomic scales (Condon et al. 2004; Tuberosa et al. 2007). The terms are provided in Table 2.1 below.
13 Table 2.1. Several common terms of water use efficiency (WUE)
Level Time scale Numerator Denominator Equation
Leaf Minutes or hours Net assimilation rate (A) Transpiration (E) WUEi = A/E (photosynthetic
scale) (µmol CO2 m
-2
s-1) (mmol H2O m-2 s-1)
Stomatal conductance (gs) WUEic = A/gs
(mmol H2O m-2 s-1) Crop Weeks to months Aboveground biomass (BM)
(g or kg)
seasonal evapotranspiration (ET) (ml or l)
WUE = BM/ET
(agronomic scale)
or growing season Grain yield (Y) (g or kg)
seasonal evapotranspiration (ml or l)
WUE = Y/ET
WUEi: instantaneous water use efficiency; WUEic: intrinsic water use efficiency
2.4 Carbon isotope discrimination and water use efficiency
Farquhar et al. (1982) showed the possible use of the discrimination of the heavy isotope of carbon (13C) relative to its light isotope (12C) to directly assess the WUE which can then be easily measured with a mass spectrometer. Approximately 1.1 % of atmospheric CO2 contains 13
C (O’Leary, 1981; Farquhar et al. 1989; Condon et al. 2002). Nevertheless, the molar abundance ratio of 13C/12C in plant tissues usually is less than that in atmospheric CO2
because of discrimination against the ‘heavier’ 13C (lower reactivity) during photosynthesis: firstly, during diffusion of CO2 into the leaf through the stomata and, secondly, during the
first key step in CO2 fixation by C3 plants, catalyzed by the enzyme Rubisco
(ribulose-1,5-bisphosphate carboxylase) (O’Leary, 1981; Farquhar et al. 1982; Farquhar and Richards, 1984; Farquhar et al. 1989).
Carbon isotope discrimination (CID) or ∆13C is a measure of the ratio of the stable isotopes of carbon (13C/12C) in plant material relative to the value of the same ratio in the atmosphere (Farquhar et al. 1989; Condon, 2004). Since the pioneering work of Farquhar and colleagues (Farquhar et al., 1982; Farquhar and Richards, 1984), it has subsequently been demonstrated, for several C3 species, that variation in CID closely reflects variation in WUE. As predicted
by theory (reviewed in Farquhar et al. 1982; Farquhar et al. 1989; Hall et al. 1994; Condon and Hall, 1997; Condon, 2004): WUE and CID should be negatively related. Indeed, when stomatal closure increase, transpiration decreases, discrimination against 13C decreases, and WUE increase.
14 Currently CID is widely used as an indirect assessment of WUE in C3 crops under
water-limited conditions. Extensive studies in C3 species have been reported and have confirmed the
negative relationship between CID and WUE (Hubick et al. 1986; Condon et al. 1990; Lauteri et al. 1993; Wright et al. 1994; Virgona and Farquhar, 1996; Scartazza et al. 1998; Lambrides et al. 2004; Impa et al. 2005; Misra et al. 2010; Roel et al. 2011). This relationship in C3
plants has opened up the prospect of utilizing differences in 13C discrimination (CID) for selecting crops that have high WUE under specific environments.
2.5 Genetic analysis of water use efficiency, carbon isotope discrimination and plant-water relation traits
Understanding the genetic basis of WUE or CID is important for crop improvement (breeding) under water-limited environments (Chen et al. 2011). It has been shown that with adequate attention to sampling strategies, CID is a highly heritable trait that is relatively easy to manipulate in breeding populations (Condon and Richards, 1992; Rebetzke et al. 2002). All these observations indicate CID as a potential candidate for use in breeding for greater agronomic WUE (Condon, 2004). In sunflower, genetic quantitative study has been conducted to analyze the genotypic variability of WUE and the potential use of leaf CID as an indicator to determine WUE (Lambrides et al. 2004). However, determination and improvement of WUE through conventional breeding programs is not practical because of the complexity and difficulty of measuring WUE of a large number of breeding lines under field conditions (Mian et al. 1996; Nguyen et al. 1997; Ober et al. 2005). Thus, there is a need for finding an alternative to the conventional approach for the improvement of WUE of field crops. Indirect selection for improved WUE through molecular-markers approaches conditioning WUE for crops may prove to be a useful approach in this respect (Mian et al. 1998), since quantitative traits such as WUE and CID are generally under considerable environmental influence, and are governed by quantitative trait loci (QTL) (Hall et al. 1994; Juenger et al. 2005; Brendel, 2008).
QTL provides the opportunity to compare whether different traits have a common genetic basis (Tanksley, 1993; Li et al. 1995). Further, QTL mapping: (i) is based on the principle that genes and markers segregate via chromosome recombination (called crossing-over) during meiosis (i. e. sexual reproduction), thus allowing their analysis in the progeny (Paterson, 1996) and (ii) usually provides a starting point for statistically identifying the chromosomal regions contributing to variation of agronomical traits in breeding programs (Zhang, 2007;
15 Chen et al. 2011). Phenotypic correlations are commonly used to associate markers with traits and to genetically dissect complex traits into Mendelian factors. Once markers that are tightly linked to genes or QTL of interest have been identified, breeders may use these markers as diagnostic tools to identify lines carrying the genes or QTL in a marker-assisted selection (MAS) program (Liu, 1998). The selected QTL should account for the largest proportion of the phenotypic variance for the target trait. So by using larger population sizes and a greater number of markers, more tightly-linked markers can be identified in high resolution mapping (Mohan et al. 1997).
In general, polygene controlling WUE and CID are multiple genes each with small effects, implies that several QTL must be manipulated simultaneously to obtain a major impact (Cattivelli et al. 2008). It is preferable to target QTL with a major effect that is consistent across environments and populations and also independent of the genetic background (Rebetzke et al. 2008). From this context, the ultimate goal of QTL mapping is to transfer QTL of WUE and CID into elite breeding lines to improve their performance when drought happens (Shinozaki and Yamaguchi-Shinozaki, 2007; Chen et al. 2011).
The QTL mapping of WUE in crop plants is rarely reported in the literature. Four QTL associated with WUE have been identified in soybean (Mian et al. 1996). The inheritance of WUE has been studied using simple sequence repeat (SSR) markers in alfalfa (Julier et al. 2010). In contrast, QTL mapping of CID has been reported by numerous authors. The first QTL identified for CID was reported in tomato by Martin & Nienhuis (1989) and subsequently QTL for CID have been reported in Arabidopsis thaliana (Hausmann et al. 2005), barley (Ellis et al. 1997; Diab et al. 2004), cotton (Saranga et al. 2001), rice (Takai et al. 2006; This et al. 2010), soybean (Specht et al. 2001) and wheat (Rebetzke et al. 2008; Peleg et al. 2009). Nevertheless, QTL of WUE and CID in sunflower have never been reported.
Besides, the genetic control of the main traits controlling water flow from soil to the atmosphere (plant-water relation traits, i.e. transpiration control, water extraction capacity and dehydration tolerance) remains poorly understood. There have been no reports of QTL identification for threshold of the FTSW (FTSWt; transpiration control). Marguerit et al. (2012) reported the results of QTL analysis for the acclimation of transpiration rate to water deficit in grapevines: calculated values of NTR when FTSW reached 60% (NTRFTSW60%),
16 40% (NTRFTSW40%) and 20% (NTRFTSW20%). They also reported QTL mapping for total
transpirable soil water (TTSW; water extraction capacity), however, QTL mapping for TTSW in sunflower was never reported. In addition, despite OA is receiving increasing recognition as major mechanism of dehydration and drought tolerance (Flower and Ludlow, 1986; Zhang et al. 1999; Serraj and Sinclair, 2002), and genetic analysis (or QTL mapping) for OA has been reported by numerous authors in a wide range of crops (Morgan, 1984; Teulat et al. 1998; Saranga et al. 2004), QTL mapping for OA associated with dehydration and drought tolerance in sunflower is rarely explored (Poormohammad Kiani et al. 2007b).
17
3 MATERIALS AND METHODS
3.1 Plant material
Experiments of this Thesis are based on 150 recombinant inbred lines (RILs), including their parents (XRQ and PSC8), except for the experiment of section 4.3 and 4.4 only consisting of four RILs: RIL 043, RIL 127, RIL 149, and RIL 200.
The XRQ and PSC8 are parental lines of the “INEDI” RIL population developed by INRA3, and behaved differently in response to water use (Rengel et al. 2012). The INEDI RIL population was obtained by single seed descent, self-pollination to at least F8 (Vincourt et al. 2012). In addition, the list of all genotypes (150 genotypes) is provided in Appendix 1.
3.2 Growth conditions and experimental setup 3.2.1 Experiment in greenhouse
Plants for four experiments across two different years (Section 4.1, 4.2 and 4.4), conducted on two drought scenarios and five levels of SWC, were grown in a greenhouse at the INRA Auzeville station, Toulouse, France (43°31’46,94” N; 1°29’59,71” E). Greenhouse air temperature was set at 25/18 + 20C (day/night) and relative humidity (RH) was about 55-75 + 5%.
Three seeds per genotype were sown in a pot (volume: 2 liters) at the beginning of the experiments. Ten to eighteen days after sowing (DAS), depending experiments, the most vigorous plant (based on morphological criteria) in each pot was selected by cutting down the two others. Each pot was then covered with a 3 mm layer of polystyrene sheet with a hole in the middle to allow normal plant growth, thus reducing the evaporation of water from the soil surface.
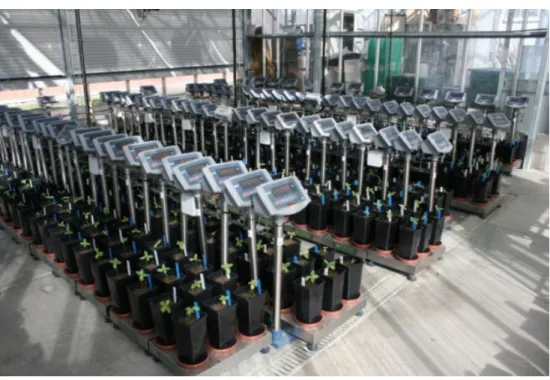
The pots contained a mixture of 50% soil (collected from the field), 30% organic matter and 20% sand, except for one experiment (section 4.4) where pots were filled with soil extracted from the field and sand in equal proportions. The pots were arranged on 100 balances (maximum capacity 30 kg, precision 2 g, model SXS, GRAM, Spain; Fig. 3.1) that were connected by interface
18 wireless communication to a computer with installed software (ENSAT 1.07T, developed by Pesage du Sud Ouest, Launaguet, France).
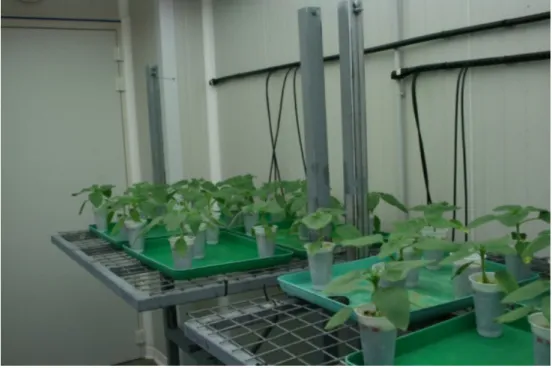
Figure 3.1 Pots were arranged on the balances in the greenhouse.
Drought scenario 1 (experiment in 2011; using 150 genotypes)
A randomized complete block design with three replicates was used for the progressive water stress treatments (three replicates X 150 genotypes = 450 plants; called WS). There was another replicate (150 plants) that was considered as a well-watered treatment, called WW.
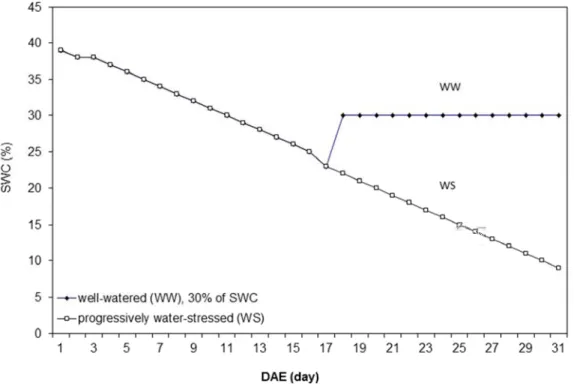
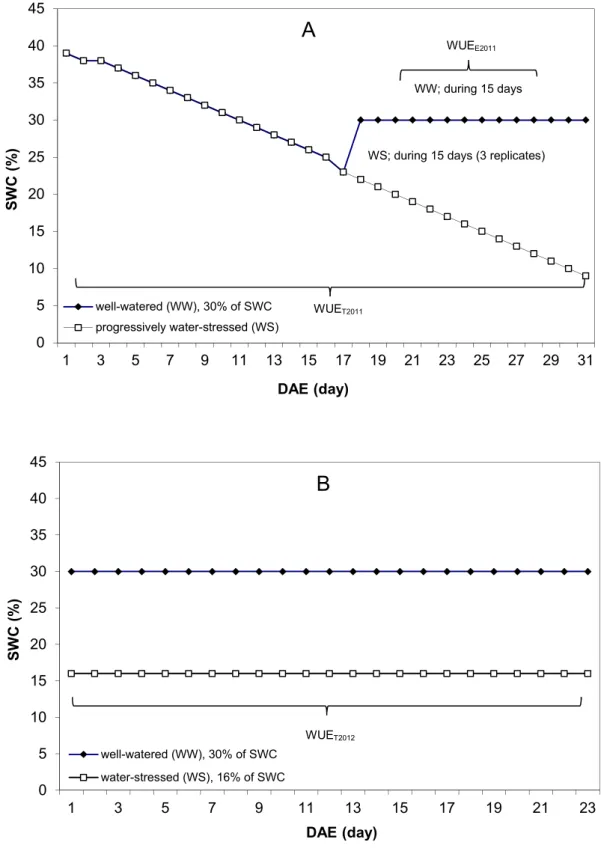
At 1 day after emergence (DAE), 17 DAS, all 600 pots were watered to field capacity, corresponding to 39.5% of soil water content (SWC). These 600 pots (WW and WS) were kept without irrigation until 17DAE. Starting at 17 DAE, when genotypes reached around 23% of SWC, we irrigated the WW treatment to 30% of SWC and we maintained this SWC by daily irrigation (Fig. 3.2) The WS treatment was kept without irrigation until harvest (Fig. 3.4). This experiment was called Exp. 2011 or drought scenario 1.
19 Figure 3.2 Principles of the water treatments used in the experiment
20
Drought scenario 2 (experiment in 2012; using 150 genotypes)
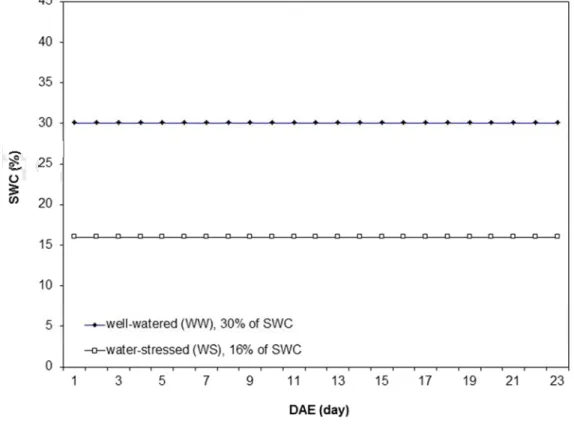
A randomized complete block design with two treatments and two replicates was performed (300 pots per treatment). Treatments consisted of two levels of stable SWC which was imposed: well-watered (30% of SWC, namely WW) and water-stressed (16% of SWC, namely WS). At 1 DAE (19DAS), stable water contents corresponding to 30% of SWC (WW) and 16% of SWC (WS) were maintained for 23 days (Fig. 3.4). This experiment was called Exp. 2012 or drought scenario 2.
Figure 3.4 Principles of the water treatments used in the experiment
Five levels of SWC (two experiments in 2012; using four genotypes)
The experiments were arranged in a randomized complete block design with four RILs, five water treatments and five replicates. In experiment 1 (Exp. 1; spring 2012), water treatments were applied consisting in five levels of SWC: 35%, 23%, 21%, 18% and 16%. In experiment 2 (Exp. 2; autumn 2012), water treatments consisted of five levels of SWC: 25%, 20%, 16%, 13% and 10%. Starting at 21 DAS, the plants were subjected to different water treatments (Fig. 3.5).
21 Figure 3.5 Five levels of soil water content (SWC) maintained stable from emergence to harvest in Exp. 1 (A) and in Exp. 2 (B)
3.2.2 Experiment in growth chamber (“phytotron”)
Plants for the experiment of “root hydraulic conductivity and contribution of aquaporins (AQPs) to water uptake” (section 4.3) were grown in a growth chamber (25°C/20°C in day/night) (Fig.
A 0 5 10 15 20 25 30 35 40 1 3 5 7 9 11 13 15 17 19 21 23 DAE (day) S W C ( % ) 35% SWC 23% SWC 21% SWC 18% SWC 16% SWC B 0 5 10 15 20 25 30 35 40 1 3 5 7 9 11 13 15 17 19 21 23 DAE (day) S W C ( % ) 25% SWC 20% SWC 16% SWC 13% SWC 10% SWC
22 3.6) under 14 h of light, 200 µmol m-2 s-1 photosynthetically active radiation at leaf level (neon type: L 58 W/77, 2250 lm, Fluora, Germany), and 50% RH in 250 ml pots. The plants were arranged in a randomized complete design with four RILs and four replicates without water-stressed treatment (all the plants were irrigated daily). Seedlings were grown in 250 ml glass pots of sand which could be easily washed and saturated with solution and then introduced into the pressure chamber (Soil Moisture Equipment Corp., Santa Barbara, CA, USA).
To minimize the effects of heterogeneity within the growth chamber, the pots were rotated every week. For pressure-flow experiments, upon harvest, pots were washed three times (3 x 50 ml) to saturation with water for the control treatment and HgCl2 solution (500 µM) for the inhibited treatment. In addition, the experiment was repeated three times.
Figure 3.6 Examples of plants in the growth chamber
3.3 Phenotypic analysis: Trait measurements
3.3.1 Water use efficiency and carbon isotope discrimination
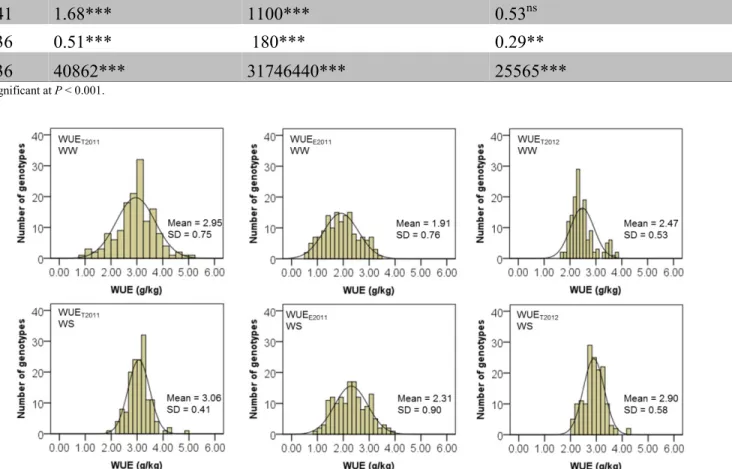
In general, for all experiments, WUE at plant level was determined as the ratio of biomass (BM) to cumulative water transpired (CWT). For Exp. 2011 (drought scenario 1), there were two methods to determine WUE. The first was the total water use efficiency, WUET2011, calculated by
23 dividing the BM by the CWT31d (
d T CWT BM WUE 31
2011 = ); (Equation 1). CWT31d is the total of plant
transpiration during 31 days (from 1 to 31 DAE). The second calculation of WUE was made during the period when the two treatments differed in their soil water content (WW and WS), from 17 to 31 DAE, and called WUEE2011 (water use efficiency “estimation”). WUEE2011 was calculated by dividing the “estimated biomass” (BME), by the CWT15d, calculated from 17 to 31 DAE ( d E E CWT BM WUE 15
2011 = ); (Equation 2). The BME was calculated as follows.
17
31 BM
BM
BME = − (Equation 3)
where BM17 is the biomass estimated at 17 DAE. The BM17 was calculated as follows.
31 31 17 17 BM LA LA BM × = (Equation 4)
where LA17 and LA31 are the leaf areas measured on 17 and 31 DAE, respectively.
WUE at leaf level, intrinsic WUE, was calculated as the ratio of A to gs (see table 2.1). This calculation was only done in Exp. 2 of the experiments that use four RILs (section 4.4). The values of A to gs were obtained from leaf gas exchange measurements. These measurements were made with a portable Li-6400 (Li-Cor, Lincoln, NE, USA) between 09:00 and 12:00 (Central European Time) from 19 to 21 DAE. All the measurements were conducted on a fully-expanded leaf (one per plant) under 1500 µmol m–2 s-1 photosynthetic photon flux density (PPFD) and 40 Pa CO2 partial pressure. Leaf temperature was maintained at 25 ± 20C and RH was 50%.
For carbon isotope discrimination measurement, oven-dried leaves (including petioles) of each plant were ground into a homogeneous fine powder and 2-3 mg subsamples were weighed and placed in capsules (Elemental Microanalysis, UK) to analyze its carbon isotope composition (δ13C) by using a continuous flow Isotope Ratio Mass Spectrometer (IRMS) at UC Davis Stable Isotope Facility (California, USA). CID (or ∆13C) was then calculated as described by Farquhar and Richards, (1984), and Farquhar et al. (1989):
1000 / 1 1 (‰) 13 13 12 13 plant plant air C C C Rplant Rair C δ δ δ + − = − = ∆ (Equation 5)
24 The ratio of 13C/12C in a sample of plant is converted to δ13C which is commonly compared with a reference material, the belemnite carbonate standard from the Pee Dee Formation (PDB) in South Carolina (Craig, 1953; O’Leary, 1981; Farquhar et al. 2001). On the PDB scale, the δ13C value for free atmospheric CO2 is approximately -8‰ (Farquhar et al. 1989).
3.3.2 Transpiration
Transpiration, called water transpired (WT), for each plant was estimated every day from the difference in the pot weight. Total transpiration (CWT) for each plant was determined at the end of the experiment by accumulating daily WT.
3.3.3 Biomass
At the end of the experiments, the above-ground parts of the plants were harvested. Stems and leaves were oven dried at 800C for 48h until they reached constant mass to determine total dry aerial biomass (BM).
3.3.4 Plant-water relation traits
The measurement of plant-water relation traits was mainly focused on Exp. 2011. Three main traits controlling plant-water relation traits include (i) control of transpiration, expressed as threshold of fraction of transpirable soil water (FTSWt), (ii) water extraction capacity, expressed as total transpirable soil water (TTSW), and (iii) dehydration tolerance, expressed as osmotic adjustment (OA) by measuring osmotic potential at full turgor at WW (OP_ww) and WS (OP-ws) conditions. The measurement of all plant-water relation traits was clearly explained in detail below.
Control of transpiration
First of all, the soil water status in the pots for each plant was calculated by soil water content (SWC) as follows.
(
)
wp wp d PW PW PW SWC= − (Equation 6)where PWd was the pot weight on a given date and PWwp was final pot weight at wilting point.
In this experiment, we normalized SWC by using fraction of transpirable soil water (FTSW), as has been proposed by Ritchie (1981), and Sinclair and Ludlow (1986). The daily value of FTSW
25 was calculated as the ratio between the amount of transpirable soil water still remaining in the pot and TTSW:
(
)
TTSW PW PW FTSW = d − wp (Equation 7)Transpiration of WS and WW plants was used to determine normalized transpiration ratio (NTR). Firstly, transpiration rate was calculated by dividing the transpiration of each individual plant of a given genotype by the leaf area (LA) of plant of that genotype. Secondly, the transpiration rate was normalized by dividing each transpiration rate value of WS plant (for each replicate) by transpiration rate value of WW plant. This second normalization gave NTR, which accounted for plant to plant variation in transpiration within each genotype
Finally, the measurement of plant response to water deficit (traits related to the control of transpiration) used a regression approach to model individual plant response. The parameters from these models were used as quantitative traits in the association analysis. Two traits were estimated by using break-linear models: (i) FTSWt, the threshold of transpirable soil water (FTSW) at which the plant transpiration rate (NTR) began to decline, Equation 8, and (ii) SWCt, the value of soil water content (SWC) when the plant transpiration (NTR) rate was null, Equation 9 and 10. (i) If x < a, =0.9×x+0.1 a NTR else, NTR = 1 (Equation 8)
where x was FTSW, and a was FTSWt.
(ii) If x < a, x b a b NTR=1− × + else, NTR =1 (Equation 9)
where x was SWC, a was SWCt, the x-intercept was computed as:
b a b x − × − = 1 0 (Equation 10)
26
Water extraction capacity
For each pot, at the end of the experiment, TTSW was calculated as follows.
wp fc PW
PW ml
TTSW( )= − (Equation 11)
where PWfc was initial pot weigh at field capacity.
Osmotic potential and adjustment
The leaves samples were taken when plants began to be wilt (it was two days before the wilting point was reached). These samples were the half of fully expanded leaf for each individual plant (without petiole).
Before measuring OP, the leaves samples were rehydrated in distilled water during 24 h at 40C in a dark room. This was aimed to make OP at full turgor: called OP_ww and OP_ws for the WW and WS plants, respectively. After rehydration, the osmotic values of leaves samples were measured on expressed sap using 10 µl aliquots placed in an osmometer (Wescor, model 5520, Logan, UT, USA) calibrated with manufacturer solutions. OP was then determined by calculating the osmometer reading (in mmol kg–1) using the Van’t Hoff relation:
1000 )
(MPa RTd c
OP = − × (Equation 12)
where R was gas constant, T was temperature in Kelvin, d was density of water at temperature T,
and c was concentration of osmotically-active solutes, given by the osmometer. OA was then
determined using the following equation:
OPws OPww
MPa
OA( )= − (Equation 13)
where the value of OP_ws was represented by the mean of the replicates.
3.3.5 Root measurement
The measurement of roots properties and hydraulics was only conducted on experiment in growth chamber (Section 4.3). In order to measure root hydraulics (conductance, conductivity and contribution of AQPs), pressure-induced sap rates were determined on six-week-old sunflower seedlings, when above-ground parts were 15-20 cm high.
Before measuring the sap flow (Jv), the plants were washed with water (for control treatment) and with HgCl2 (for inhibition treatment). Following this washing, the above-ground part was cut
27 off with a razor blade just below the cotyledonary leaves (40-50 mm from the base). Pots with whole root systems were placed in a stainless steel pressure chamber. Excised stems were sealed into the lid of the chamber through a silicone gasket so that part of the stem protruded and chamber pressure was gradually increased. Water expressed from each cut stem was collected using an Eppendorf tube containing dry cotton wool. The amount of sap was determined by weighing the tube before and after collecting the water. The Jv, expressed as the quantity of water exuded from the cut stems, was monitored every 5 min for at least 45 min after it had reached a constant rate (less than 25 min).
Upon completion of the exudation experiments, root fresh weight was weighed. Then, properties i.e. root length, root surface area and volume of fine roots of each root system were determined with an image analyzer WinRHIZO 2007d (Regent Instruments, Quebec, Canada). Fine roots are the smallest diameter class (0 – 0.5 mm). Finally, roots were oven dried at 800C for 48h until they reached constant mass to determine root dry weight
The Jv previously obtained was then used to define (i) the whole root hydraulic conductance (root
L0) calculated as the sap flow rate per unit of pressure (µL s-1 MPa-1) and (ii) the root hydraulic conductivity (root Lpr) calculated as the sap flow rate per unit of root surface and per unit of pressure (m s-1 MPa-1). In addition, the contribution of AQPs to root Lpr (AQPs involvement) was determined by expressing as the relative decrease in root Lpr induced by HgCl2 treatment.
3.3.6 Other traits measurement
Other traits measurements in the greenhouse experiments consisted of morphological traits measurements including plant height (PH), leaf number (LN) and leaf area (LA). The measurement of PH and LN was done at the end of experiment (before harvesting the plants). For LA, due to numerous plants in the experiment, LA of the plants was estimated by using computer image analysis system, winFOLIA (Regent Instruments, Quebec, Canada). The image of leaves was taken by a digital camera (Canon, eos400d).
28 3.3.7 Statistical analysis
For all experiment, the software of statistical package PASW statistics 18 (IBM, New York, USA) was used to analyze genotype and replicate effects by analysis of variance (ANOVA) and to estimate phenotypic correlation by Pearson’s correlation. Means of the traits were compared using a Student-Newman-Keuls (SNK) test (P < 0.05), except, for the FTSW and SWC threshold
(FTSWt and SWCt) analysis, R software (R Development Core Team, 2012) was used. Each NTR value was plotted to a corresponding FTSW and SWC values. FTSWt and SWCt where NTR initiated its decline were determined using a plateau regression.
3.4 Genetic analysis 3.4.1 Heritability
The broad sense heritability (h2) was computed from the estimates of genetic (σ2g) and residual (σ2e) variances derived from the expected mean squares of the ANOVA as follows.
+ = r e g g h 2 2 2 2 σ σ σ
(Equation 14), where r was the number of replicates.
3.4.2 Genetic map construction
The genetic map consisted of 2610 markers located on the 17 LG for a total genetic distance of 1863.1 cM and grouped on 999 different loci. The gDNA from the INEDI RILs population obtained from the cross between XRQ and PSC8 lines (210 samples) were genotyped with the Infinium array. All genotyping experiments were performed by Integragen (IntegraGen SA, Genopole Campus 1 - Genavenir 8, 5 rue Henri Desbruères, 91000 Evry, France.) and the genotypic data were obtained with the Genome Studio software (Illumina) with automatic and manual calling. A set of 9832 SNPs were used to produce an Infinium HD iSelect BeadChip (Infinium). These SNPs were selected from either genomic re-sequencing or transcriptomic experiments. From the 9832 SNPs, 2576 were polymorphic between XRQ and PSC8. We used CarthaGène v1.3 (De Givry et al. 2005) to build the genetic maps. We added the genotypic data of markers from a consensus map (Cadic et al. 2013) to assign the Infinium SNPs to the appropriate LG.
29 3.4.3 QTL mapping
QTL mapping was carried out using MCQTL, software for QTL analysis (http://carlit.toulouse.inra.fr/MCQTL/). MCQTL package is comprised of three software applications. The first component, TranslateData reads data from MAPMAKER (Lincoln et al. 1993) like files. The second component, ProbaPop computes QTL genotype probabilities given marker information at each chromosome location for each family and stores them in XML formatted files. The last component, Multipop builds the pooled model using the genotype probabilities, computes Fisher tests and estimates the model parameters (Jourjon et al. 2005). Significant thresholds (P < 0.05) for QTL detection were calculated for each dataset using 1000
permutations (Churchill & Doerge, 1994) and a genome-wide error rate of 0.01 (Type I error). The corresponding type I error rate at the whole-genome level was calculated as a function of the overall number of markers in the map and the number of markers in each linkage group.
30
4 RESULTS AND DISCUSSIONS
4.1 Genetic control of water use efficiency and leaf carbon isotope discrimination in sunflower (Helianthus annuus L.) subjected to two drought scenarios
Afifuddin Latif Adiredjo1,2, Olivier Navaud3, Stephane Muños4,5, Nicolas Langlade4,5, Thierry Lamaze3*, Philippe Grieu1*
1 Université de Toulouse, INP-ENSAT, UMR1248 AGIR (INPT-INRA), Castanet-Tolosan, France, 2 Brawijaya University, Faculty of Agriculture, Department of Agronomy, Plant Breeding Laboratory, Malang, Indonesia, 3 Université de Toulouse, UPS-Toulouse III, UMR5126 CESBIO, Toulouse Cedex 9, France, 4 INRA, Laboratoire des Interactions Plantes-Microorganismes (LIPM), UMR441, Castanet-Tolosan, France, 5 CNRS, Laboratoire des Interactions Plantes-Microorganismes(LIPM), UMR2594, Castanet-Tolosan, France, *PhD supervisors of the first author
Accepted by PLoS One (in press)
Correspondence Philippe Grieu
Université de Toulouse, INP/ENSAT, UMR 1248 AGIR, BP BP 32607, 31326 Castanet-Tolosan, France Tel.: +33(0)534323878
Fax.: +33(0)534323901 Email: [email protected]