UNIVERSITÉ DE SHERBROOKE Faculté de génie
Département de génie chimique et génie biotechnologique
BIOFILTRATION DU MÉTHANE EN ABSENCE
OU EN PRÉSENCE D’ÉTHANOL EN RÉGIME
PERMANENT OU EN RÉGIME TRANSITOIRE
Methane biofiltration in the absence and presence of
ethanol vapors under steady state and transient state
conditions
Thèse de doctorat Spécialité : Génie Chimique
Milad FERDOWSI
Jury: Pr. Michèle HEITZ (Directrice) Pr. J. Peter JONES (Co-directeur)
Dr. Antonio AVALOS RAMIREZ (Co-directeur) Pr. Gervais SOUCY (Rapporteur)
Dr. Gerardo BUELNA (Évaluateur externe) Pr. Seyed Morteza ZAMIR (Évaluateur externe)
i
RÉSUMÉ
Les émissions de méthane (CH4), gaz à effet de serre provoquant le réchauffement climatique doivent être contrôlées. Les biofiltres peuvent être utilisés pour atteindre cet objectif. Les émissions de CH4 issues des industries agroalimentaires ou du traitement des eaux peuvent être accompagnées de vapeurs d’alcool. La présence simultanée de CH4, polluant à limitation par transfert de masse et d’alcool, polluant à limitation cinétique dans un mélange gazeux peut induire des limitations dans le biofiltre. L’objectif principal de cette recherche est l’évaluation des limitations dans un biofiltre traitant le CH4 en présence ou en absence de vapeur d’alcool en régime permanent ou transitoire. Dans un premier temps, une revue de littérature s’est penchée sur les limitations basées sur le transfert de masse et la cinétique lors de l’enlèvement de polluants organiques dans un biofiltre. Par la suite, l’élimination du CH4 a été effectuée dans un biofiltre afin d’évaluer l’influence de la concentration à l’entrée du biofiltre sur la performance du biofiltre. Une capacité d’élimination maximale de 45 g m-3 h-1 a été obtenue pour une charge à l’entrée de 87 g m-3 h-1 du biofiltre. Le biofiltre a toléré des charges par à-coups de CH4 de même que des privations de CH4 et de nutriments. Par conséquent, les comportements en régimes permanent et transitoire d’élimination du CH4 en présence de vapeurs d’éthanol ont été étudiés dans un biofiltre ayant un lit filtrant inorganique sous des temps de résidence en fût vide (EBRT) de 6, 3 et 1.5 minutes. L’ajout d’éthanol sur 3 cycles a été effectué en fonction des 3 EBRTs. Un EBRT de 6 min correspondant à des charges à l’entrée de CH4 et d’éthanol de 4.5 et de 132 g m-3 h-1 a induitdes limitations mineures en ce qui a trait à l’enlèvement du CH4 et de l’éthanol. En régime transitoire, la période de récupération après les 3 cycles a nécessité 10 à 25 jours. Ce délai est relié à la présence d’éthanol dans le lixiviat. Dans un dernier temps, deux biofiltres ayant un garnissage de pierres et un garnissage mixte ont été comparés pour l’enlèvement du CH4 et de l’éthanol présents dans un mélange gazeux en régime permanent. La section inférieure du biofiltre a permis l’élimination totale de l’éthanol. De plus, lors de l’élimination totale de l’éthanol dans la section inférieure du biofiltre, la production de dioxyde de carbone (CO2) dépasse 16 g m-3 h-1, pour des charges à l’entrée de CH4 et d’éthanol de 11 et 13 g m-3h-1 respectivement. Par ailleurs, une concentration en éthanol dans le lixiviat excédant 2500 géthanol m-3lixiviata été obtenue.
Les biofiltres ont démontré une flexibilité pour des charges par à-coups d’éthanol suivies de périodes de carence. Le principal inconvénient du biofiltre à lit de pierres par rapport au biofiltre mixte est une perte de charge élevée dans la section inférieure du biofiltre. Une période de carence est un excellent moyen de contrer la perte de charge.
ii
ABSTRACT
Since methane (CH4) is a greenhouse gas with hazardous effects for global warming, every effort should be made to reduced methane emissions. Biofilters are potential candidates for CH4 removal. In food and beverage industries as well as ethanol refineries, the feed of the biofilter might be a mixture of CH4 emissions from wastewater treatment unit and ethanol emissions from other units. The presence of CH4 as a mass transfer limited and ethanol vapor as a kinetic limited pollutant in a mixture can produce several limitations in a biofilter. The main objective of this research is to evaluate the limitations of CH4 biofiltration or in the presence of ethanol vapors under steady and transient state conditions. First, a literature review was provided on mass transfer and kinetic limited organic pollutants removal in biofilters and the related limitations. Subsequently, the CH4 elimination was assessed in a biofilter in order to evaluate the effect of CH4 inlet concentration in the range of 1000 to 13000 ppmv and a gas flow rate of 3 L min-1 on the biofilter performance. A maximum CH
4 elimination capacity (ECmax) of 45 g m-3 h-1 was obtained for a CH
4 inlet load (IL) of 87 g m-3 h-1. The biofilter tolerated CH4 shock loads as well as different types of CH4 and nutrient starvations. Subsequently, the steady state and dynamic behaviors of CH4 elimination in the presence of ethanol vapor was studied in an inorganic bed biofilter with empty bed residence times (EBRTs) of 6, 3 and 1.5 min. Ethanol addition was performed in 3 cycles based on the EBRTs. An EBRT of 6 min with corresponding CH4 and ethanol inlet loads of 132 and 4.5 gpollutant m-3 h-1 respectively, caused the least limitations for the simultaneous removal of CH4 and ethanol in the biofilter. According to dynamic behavior of the biofilter, the recovery time after the three cycles took from 10 to 25 days. The delayed biofilter recovery was linked to the presence of ethanol in the liquid effluent. Finally, a stone-based bed and a hybrid packing biofilter were compared for CH4 and ethanol removal in a mixture under steady and transient state conditions. Ethanol was completely removed in the bottom sections of both biofilters. A large carbon dioxide (CO2) production rate exceeding 18 g m-3 h-1 occurred in the bottom sections for CH4 and ethanol inlet loads of 11 and 13 g m-3 h-1 respectively. In addition, an ethanol concentration in the leachate exceeding 2500 gethanol m-3leachate was obtained for both biofilters. The biofilters were flexible to an ethanol shock load followed by a starvation period. The main drawback of the stone based bed biofilter compared to the hybrid packing biofilter was an excess pressure drop in the bottom section. Starvation was found an effective strategy for reducing the pressure drop.
iii
ACKNOWLEDGMENT
First, I would like to thank my advisor professor Michèle Heitz who trusted in me for this project. She has been supportive and helpful since the beginning of my doctoral study. I could significantly improve all my research skills especially in terms of writing scientific documents. I also appreciate her for giving me enough freedom in order to develop my new ideas during my study.
I also wish to thank my co-director professor J. Peter Jones for all his helps and supports during my PhD study. In addition, I had a great opportunity to discuss with him in order to improve my language skills in terms of writing, listening and speaking. I also appreciate him for giving me valuable advices for my general life.
I would like to thank my co-director Dr. Antonio Avalos Ramirez for his positive contribution and his valuable suggestions and comments for my PhD project.
Beside my directors, I want to thank my fellow lab mate, Marc Veillette, who helped me to move on at the beginning of my PhD project. I would like to thank my other friends and Colleagues in our research group, David Fernández and Bahman Khabiri.
I also wish to thank nice and helpful technicians of the different laboratories at Université de Sherbrooke: Serge Gagnon, Valérie Larouche, Isabelle Arsenault and Stéphane Guay. I addition, I would like to thank secretaries of the chemical engineering department at Université de Sherbrooke, France Auclair, Louise Carbonneau, Louise Chapdelaine and Sylvie Lebrun for their nice behaviors and helps.
Last but not the least, I would like to thank my family: My parents and my brother, Farzad, for their unconditional supports and motivations during my whole life especially these 4 years. At the end, I express my appreciation to my other friends in Canada, in my county and all over the world who did not leave me alone during my stay in Sherbrooke.
iv
TABLE OF CONTENT
RÉSUMÉ ... i ABSTRACT ... ii ACKNOWLEDGMENT ... iii CHAPTER 1. Introduction ... 1 1.1 Introduction in French ... 5CHAPTER 2. Literature review ... 7
2.1 Résumé ... 8
2.2 Abstract ... 8
2.3 Introduction ... 9
2.4 Biofilter (BF) and biotrickling filter (BTF) ... 10
2.4.1 Performance parameters ... 11
2.5 Classification of organic pollutants based on their mass transfer and kinetic limitations ... 12
2.5.1 Biofiltration and biotrickling filtration of mass transfer limited pollutants ... 14
2.5.2 Biofiltration of kinetic limited pollutants ... 18
2.6 Important parameters for mass transfer and kinetic limited pollutants removal in BFs and BTFs ... 20
2.6.1 Support media ... 20
2.6.2 Water content ... 23
2.6.3 Temperature ... 24
2.6.4 Empty bed residence time (EBRT) ... 26
2.6.5 Microorganisms ... 27
2.7 Biofiltration of mass transfer and kinetic limited pollutants in a mixture ... 28
2.8 Innovative configuration of BFs to overcome mass transfer and kinetic limitations ... 30
2.8.1 Two liquid phase biotrickling filter (TLP-BTF) ... 30
2.8.2 Innovative feeding strategies ... 32
2.8.3 Two-stages and hybrid BFs ... 33
v
2.10 Acknowledgments ... 35
CHAPTER 3. Performance evaluation of a methane biofilter under steady state, transient state and starvation conditions... 36
3.1 Résumé ... 37
3.2 Abstract ... 37
3.3 Introduction ... 38
3.4 Materials and methods ... 39
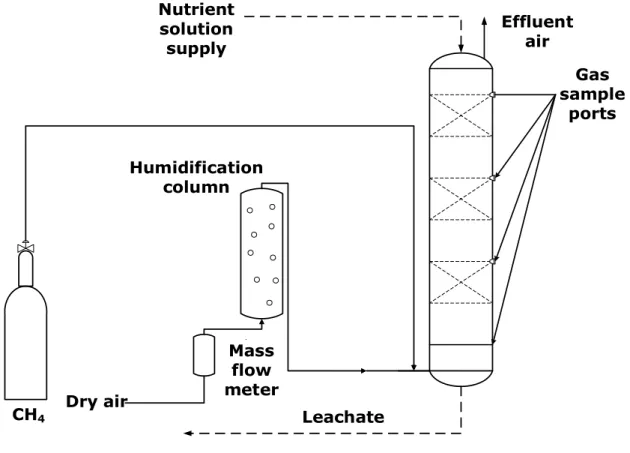
3.4.1 Experimental set-up ... 39
3.4.2 Microbial culture and inoculation ... 40
3.4.3 Nutrient solution ... 41
3.4.4 Analytical methods ... 41
3.4.5 Biofilter operating parameters ... 41
3.4.6 Experimental method ... 41
3.4.6.1 Pseudo steady state IL patterns ... 42
3.4.6.2 Transient state IL patterns. ... 42
3.4.6.3 Starvation ... 42
3.5 Results and discussion ... 43
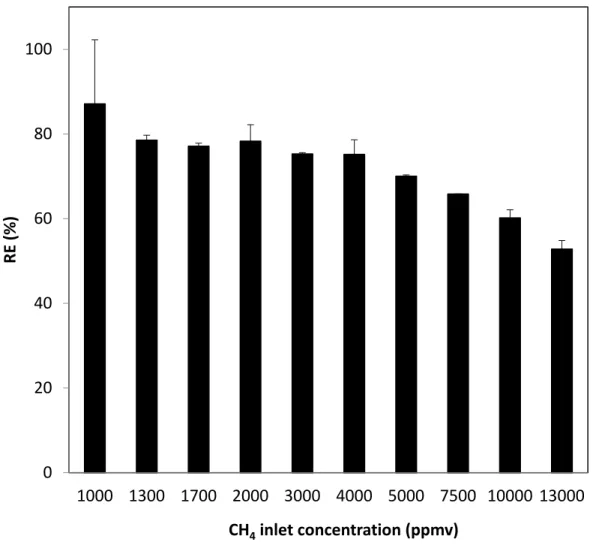
3.5.1 Performance during pseudo steady state conditions ... 43
3.5.2 Biofilter performance at unsteady state load patterns ... 46
3.5.2.1 Effect of shock load strategies ... 46
3.5.3 Starvation ... 51
3.5.4 Conclusion ... 53
3.5.5 Acknowledgments ... 54
CHAPTER 4. Steady state and dynamic behaviors of a methane biofilter under periodic addition of ethanol vapors ... 55
4.1 Résumé ... 56
4.2 Abstract ... 57
vi
4.4 Materials and methods ... 59
4.4.1 Experimental setup ... 59
4.4.2 Microbial culture ... 60
4.4.3 Analytical methods ... 60
4.4.4 Performance parameters ... 61
4.4.5 Methodology and experimental conditions ... 61
4.5 Results and discussion ... 63
4.5.1 The biofilter’s overall performance ... 63
4.5.2 Global and individual ECs ... 65
4.5.3 Total CO2 production rate ... 67
4.5.4 Methane and ethanol elimination profiles across the filter bed ... 69
4.5.5 The biofilter’s sensitivity to ethanol additions ... 70
4.5.6 The dynamic ethanol concentrations in the leachate ... 73
4.5.7 The dynamic leachate clean up after ethanol vapor termination ... 75
4.6 Conclusion ... 76
4.7 Acknowledgments ... 77
CHAPTER 5. Methane biofiltration in the presence of ethanol vapor under steady and transient state conditions: An experimental study ... 78
5.1 Résumé ... 79
5.2 Abstract ... 80
5.3 Introduction ... 80
5.4 Materials and methods ... 82
5.4.1 Experimental setup ... 82
5.4.2 Microbial culture and inoculation ... 84
5.4.3 Analytical methods ... 84
5.4.4 Performance parameters ... 84
vii
5.5 Results and discussions ... 87
5.5.1 The overall performance of the SBF and HBF under steady state conditions ... 87
5.5.2 Methane removal and Carbon dioxide production rate profiles across SBF and HBF ... 89
5.5.3 Ethanol concentration in the leachate ... 93
5.5.4 The performance of SBF and HBF under transient conditions ... 95
5.5.5 Pressure drop evolution ... 99
5.6 Conclusion ... 101
5.7 Acknowledgments ... 102
CHAPTER 6. Conclusion... 103
6.1 Conclusion in French ... 106
viii
LIST OF FIGURES
Figure 2.1: The main phenomena and limitations in biofiltration and biotrickling filtration ... 11
Figure 2.2: Three typical examples (A, B and C) of BF performances (EC vs. IL) for mass transfer and kinetic limited pollutants removal. ... 15
Figure 3.1: Experimental set up of the biofilter ... 40
Figure 3.2: The biofilter performance as a function of CH4 inlet concentration ... 44
Figure 3.3: Elimination capacity as a function of CH4 inlet load ... 45
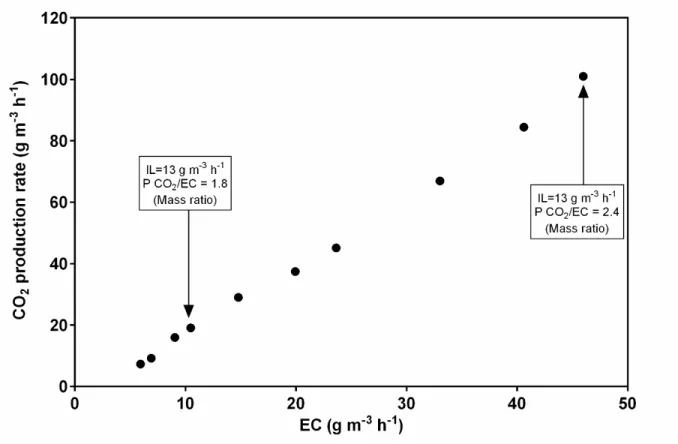
Figure 3.4: Carbon dioxide production rate as a function of CH4 elimination capacity ... 46
Figure 3.5: Shock loads by inlet concentration sudden variation: a. Conversion, elimination capacity and inlet load as a function of time, b. Carbon dioxide production rate as a function of time ... 48
Figure 3.6: Shock loads by CH4 flow rate sudden variation: a. Conversion, elimination capacity and inlet load as a function of time, b. Carbon dioxide production rate as a function of time ... 50
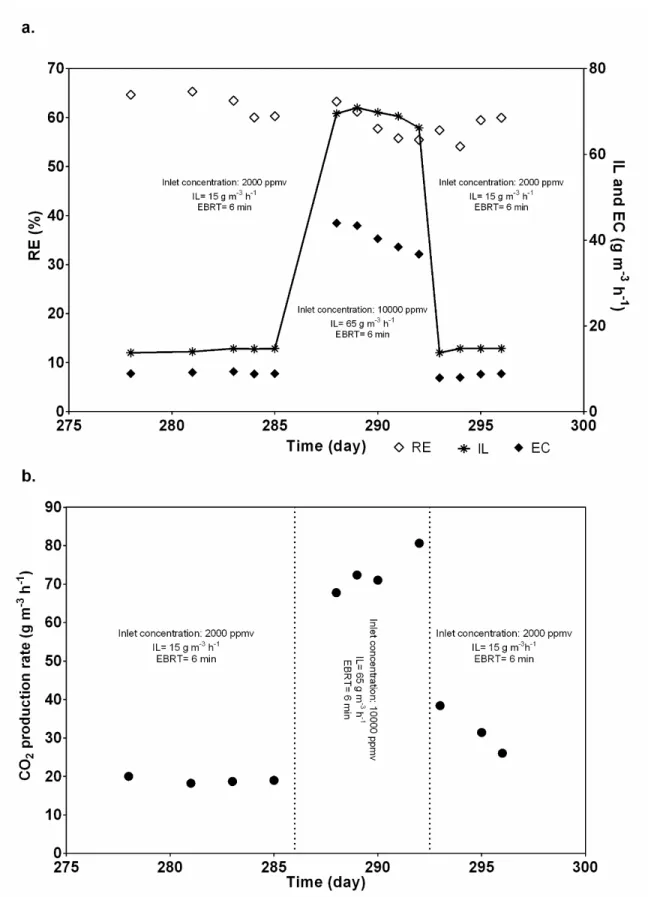
Figure 3.7: Effect of starvations on the biofilter performance for a constant IL of 13 g m-3 h-1: a. Biofilter conversion and elimination capacity as a function of time, b. Carbon dioxide production rate as a function of time ... 52
Figure 4.1: Experimental schematic of the biofilter ... 60
Figure 4.2 : The overall performance of the biofilter: a. CH4; b. Ethanol ... 64
Figure 4.3: The global and individual ECs as a function of total IL ... 66
Figure 4.4: Total CO2 production rate as a function of total EC at different cycles ... 68
Figure 4.5: Methane elimination profiles across the filter bed at different EBRTs ... 69
Figure 4.6: The biofilter sensitivity to ethanol additions: a. Cycle 1; b. Cycle 2; C. Cycle 3 ... 72
Figure 4.7: Ethanol concentration in the leachate over the time: a. Cycle 1; b. Cycle 2; c. Cycle 3 ... 74
Figure 4.8: Leachate clean up over the time after cycle 3 ... 76
Figure 5.1: The schematic of the biofilters ... 83
Figure 5.2: The overall performance of the biofilters as a function of time. a. SBF, b. HBF ... 88
Figure 5.3: Methane (CH4) removal profile across the filter bed as a function of ethanol IL a. SBF, b. SBF ... 91
ix
Figure 5.4: Carbon dioxide production rate (P CO2) profile across the filter bed as a function of ethanol IL. a. SBF, b. HBF ... 92
Figure 5.5: Ethanol concentration in the leachate as a function of time. a. SBF, b. HBF ... 94
Figure 5.6: Transient conditions for the SBF as a function of time. a. CH4 removal efficiency, b. CO2 production, c. Ethanol concentration in the liquid effluent ... 96 Figure 5.7: Transient conditions for the HBF as a function of time. a. CH4 removal efficiency,
b. CO2 production, c. Ethanol concentration in the liquid effluent ... 97 Figure 5.8: Overall pressure drop (filter bed height (H) =1 m) and bottom section pressure
x
LIST OF TABLES
Table 2.1: Physical-chemical properties of mass transfer limited and kinetic limited organic
pollutants at 25 ˚Ca ... 13
Table 2.2: Removal of mass transfer limited pollutants in BFs and BTFs ... 17
Table 2.3: Removal of kinetic limited pollutants in BFs and BTFs ... 19
Table 2.4: Mass transfer limited pollutants removal in BFs with different packing materials . 21 Table 2.5: Mass transfer and kinetic limited pollutants removal in BFs under different temperatures... 25
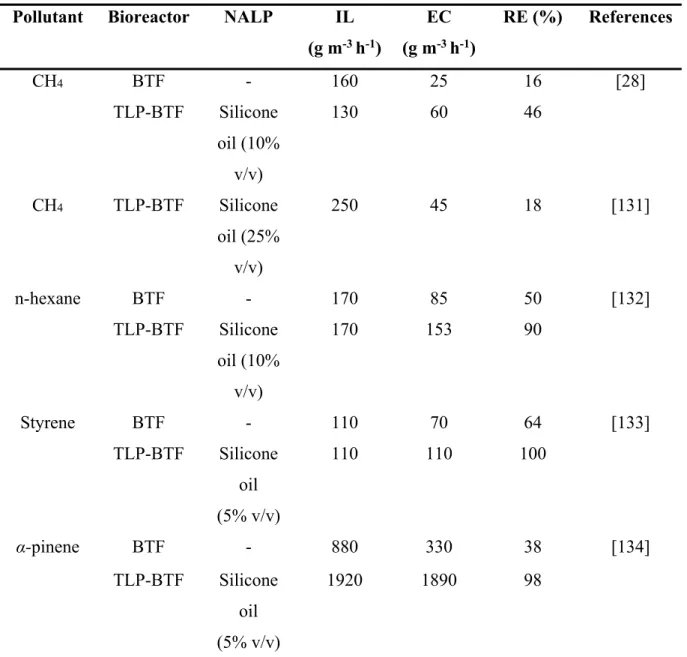
Table 2.6: Effect of NALPs on mass transfer limited pollutant’s removal in TLP-BTFs ... 31
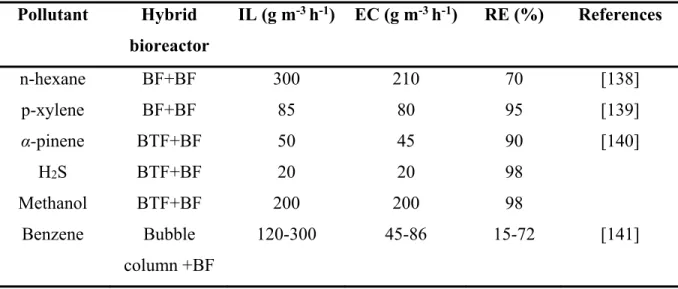
Table 2.7: Removal of mass transfer and kinetic limited pollutants in hybrid biofilters ... 33
Table 4.1: Experimental conditions ... 62
Table 4.2: Distribution of CH4 eliminations at different sections of the biofilter ... 70
Table 5.1: Characteristics of the packing materials ... 84
Table 5.2: Experimental conditions for SBF and HBF ... 86
1
CHAPTER 1.
Introduction
Greenhouse gas (GHG) emissions like methane (CH4) and carbon dioxide (CO2) are serious threats to the environment because of their impacts on climate change and global warming. Presently, there is a global consensus to reduce GHGs emissions. Recently, in Paris (2015) and in Morocco (2016) about 200 countries including Canada signed an agreement to keep the global temperature increase below 2 °C compared to pre-industrial levels [1]. Methane is the second most important GHG after CO2 with a global warming potential (GWP) of 25 in comparison with CO2 with a GWP of 1 [2]. Therefore, CH4 emissions reduction is essential in order to prevent global warming. Anthropogenic activities like landfills, live stocks, wastewater treatment plants (WWTPs), coal mines and natural gas sectors contribute approximately 60% of total CH4 emissions in the world [3]. CH4 emissions from anthropogenic activities usually have low concentrations (<3% v/v) which might not be amenable to elimination by chemical oxidation (e.g., combustion). Nevertheless, combustion may produce secondary gaseous pollutants like nitrogen oxides (NOx) or dioxines. If the CH4 concentration is low (<3% v/v), biological techniques such as biofiltration can be used as an appropriate technique for CH4 removal. Biofiltration is based on a CH4 bioxidation in a biofilter by methanotrophs, CH4 degrading bacteria, into CO2, water (H2O), biomass and salts [4]. In biofiltration, CH4 is converted to less hazardous materials and consequently, the net GWP is reduced. Biofilters are usually cost effective and easy to operate with less production of hazardous secondary pollutants. Biofilters have been investigated for different types of gaseous pollutants emissions removals. For example, the elimination of volatile organic compounds (VOCs) (e.g., benzene, toluene), volatile inorganic compounds (VICs) (e.g., NH3, H2S) and some odorous pollutants like acetic acids have been studied in biofilters. In addition, several studies focused on CH4 elimination in biofilters in order to reduce greenhouse gas emissions.
In general, pollutant mass transfer from gas into biofilm phase and kinetics of biodegradation are the two main limitations for a typical pollutant’s removal in biofilters.
Methane’s poor mass transfer from gas into the biofilm phase has been noted the most important limitation for CH4 biofiltration. The effect of some operating parameters like inlet load, temperature, nutrient solution and packing materials have been studied for CH4 biofilters in
2
order to improve the CH4 elimination. Among the operating parameters, CH4 inlet load is a key factor since it is a combination of CH4 inlet concentration and gas flow rate. Some studies discussed about the effect of CH4 inlet load in terms of gas flow rate variations. However, the effect of CH4 inlet concentration at a fixed gas flow rate has received less attention. Over a range of CH4 inlet concentration, a CH4 biofilter can encounter with mass transfer and kinetics limitations. Therefore, it is important to determine the critical CH4 concentration which may cause performance reduction in a biofilter. The CH4 critical inlet concentration reveals a switching point between mass transfer and kinetic limitations.
In industrial sectors responsible for CH4 emissions, CH4 is frequently present in a mixture with other kinds of gaseous pollutants like volatile fatty acids (e.g., acetic acid), chloromethane, toluene and alcohols. In food and beverage industries or refineries, CH4 can be in a mixture with ethanol vapors. In the mentioned industries, ethanol emission from different units might be mixed with CH4 emissions in order to be fed to the waste gas treatment unit.
Ethanol vapors are present in approximately 5% of total CH4 emissions in the world [2]. Biofilters have been used for ethanol vapors elimination in a few studies. Ethanol vapor is totally different from CH4 in terms of water solubility and mass transfer limitations from gas into the biofilm phase. Ethanol miscibility with water guarantees an enhance ethanol mass transfer from gas to biofilm phase. Because of ethanol’s low dimensionless Henry’s constant of 0.002 (at 25 ˚C, P=1 atm) [5], fewer mass transfer limitations are produced for ethanol from gas into biofilm phase. On the other hand, the CH4 mass transfer from gas into the biofilm phase is poor because of high CH4 dimensionless Henry’s constant of 28 at 25 ˚C, P=1 atm [6]. In addition, ethanol is more biodegradable than CH4. However, the excess solubility of ethanol in the biofilm phase may cause toxicity problems for microorganisms present in the biofilm phase. Therefore, the presence of ethanol vapors during CH4 biofiltration is hypothesized to produce a variety of challenges and limitations in terms of mass transfer and kinetics of biodegradation. In this regard, some operating parameters like empty bed residence time (EBRT) or filter bed packing are expected to have opposite impacts on the removal of each pollutant. For example, a suitable packing material or an appropriate EBRT range for ethanol removal in biofilters may limit the CH4 removal at the same time when both pollutants are present. Therefore, more studies on operating parameters like EBRT and filter bed should be performed in order to reduce the limitations when both pollutants are present in a biofilter.
3
Methane biofiltration has been usually carried out under steady state conditions. Nevertheless, according to the industrial application of biofilters for CH4 removal, different transient conditions can occur. The ability of CH4 biofilters to deal with transient conditions can provide valuable information for plant managers and researchers who worked with pilot or full field scale CH4 biofilters. Sudden variation of pollutants inlet concentration or gas flow rate, shutdown during weekends or maintenance periods and the periodic presence of a second pollutant are common situations for industries with CH4 emissions. For example, CH4 shock load, CH4 or nutrient starvations and the intermittent load of alcohols (in a mixture with CH4) are common transient conditions for the biofilters. The transient conditions are usually harsh situations for biofilters. In this regard, biofilters are supposed to withstand the transient conditions. Therefore, the biofilter performance over transient conditions in terms of biofilter flexibility and sensibility is important. The biofilter response to transient conditions is expected to be quick and the recovery time for restoration after the harsh condition should be short. In addition, the study of dynamic behaviors of CH4 biofilters during transient conditions will give a better understanding about the important phenomena of the process.
To the author’s best knowledge, no study discussed the effect of CH4 inlet concentration in terms of mass transfer and kinetic limitations as well as the critical inlet concentration responsible for the biofilter performance reduction. In addition, presence of an alcohol vapor like ethanol in a CH4 biofilter and the associated limitations in terms of mass transfer and kinetic limitations has never been investigated. Moreover, no study discussed the effect of different transient conditions for a CH4 biofilter in terms of transient loads, shock loads, intermittent loading of a second pollutant, shutdown periods and starvations.
The general objective of this study was to investigate the steady and transient state performance of biofilters for CH4 removal solely and in the presence of ethanol vapors. This study carried out under three specific objectives. The first specific objective was to evaluate a CH4 biofilter performance under steady and transient state conditions. The effect of CH4 inlet concentration was investigated under steady state conditions. Accordingly, different strategies of transient conditions in terms of shock loads, nutrient starvations and shutdowns were applied to the CH4 biofilter in order to evaluate the biofilter’s ability to encounter with transient conditions.
4
The second objective was to evaluate a CH4 biofilter in the presence of ethanol vapor under steady state and transient state conditions. In this regard, the effect of gas flow rate or EBRT, was evaluated in a CH4 biofilter in the periodic presence of ethanol. Accordingly, the transient conditions and the sensitivity of the biofilter under the intermittent ethanol addition at different EBRTs were discussed.
The third objective was to evaluate a stone-bed and a hybrid packed bed biofilter for CH4 elimination in the absence and presence of ethanol vapor under steady state and transient state conditions. The effect of stepwise ethanol concentration increases was studied under steady state condition in the biofilters. Accordingly, transient conditions in the forms of ethanol shock loads and shutdown periods were applied to the biofilters and the biofilters ability to tolerate the transient conditions were examined.
This thesis contains 6 chapters including 1 review article and 3 research articles.
Chapter 1 is an introduction to topic of the thesis. This chapter presents a general statement about the topic, the questions and problems related to the issue and objectives of the project. Chapter 2 presents a literature review on two groups of organic gaseous pollutants as mass transfer limited (e.g., CH4) and kinetic limited (e.g., ethanol). Each group of the pollutant is defined in this chapter. The abatement of the mention pollutants in biofilters and biotrickling filters and the effect of several important operating parameters under steady or transient state condition are discussed. In addition, the limitations and challenges when both types of pollutants are present in a mixture are evaluated. Finally, some improved bioprocesses to reduce the mass transfer and kinetic limitations are introduced.
Chapter 3 presents CH4 biofiltration under steady state and different transient state conditions. The steady state performance of the CH4 biofilter is evaluated over a range of inlet concentrations. Moreover, the biofilter dynamic behavior under different transient conditions in the forms of shock loads or starvations are discussed.
Chapter 4 and 5 are dedicated to CH4 and ethanol biofilter in a mixture. Chapter 4 presents the performance of a CH4 biofilter under periodic ethanol additions. The dynamic behavior of the biofilter are evaluated over 3 cycles of ethanol addition corresponding to 3 different EBRTs.
5
The sensitivity of the CH4 biofilter to ethanol addition as well as its recovery after ethanol completion are discussed.
Chapter 5 presents an evaluation and comparison of two different biofilters in their bottom sections for CH4 removal in the presence of ethanol under steady and transient state conditions. Under steady state condition, the biofilters are analyzed in terms of CH4 or ethanol removal, carbon dioxide production and pressure drop in different sections of the column. In addition, the ability of the biofilters to deal with harsh transient conditions such as shock loads and starvations are discussed.
Chapter 6 is the conclusion of the thesis including the general findings of the project. The research questions and problems are restated and discussed in this chapter.
1.1 Introduction in French
Les émissions de gaz à effet de serre (GES) tel que le méthane (CH4) et le dioxyde de carbone (CO2) sont de réelles menaces pour l'environnement en raison de leurs impacts sur le changement climatique et le réchauffement climatique. Le méthane est le deuxième GES le plus important après le CO2 avec un potentiel de réchauffement planétaire (PRP) 25 fois plus élevé que celui du CO2. Les activités anthropiques telles que les décharges, l’élevage, les stations d'épuration des eaux usées, les mines de charbon et l’industrie du gaz naturel contribuent pour environ 60% des émissions totales de CH4 dans le monde. Les émissions de CH4 provenant d'activités anthropogéniques ont généralement de faibles concentrations (<3% v/v) qui ne pourraient pas être éliminées par oxydation chimique (par exemple, la combustion). Dans les cas de faibles concentrations de CH4 (<3% v/v), des procédés biologiques tels que la biofiltration peuvent être utilisées pour l'élimination du CH4. La biofiltration est basée sur une bioxydation du CH4 dans un biofiltre par des méthanotrophes, bactéries transformant le CH4, en CO2, en eau (H2O), en biomasse et en sels. Dans la biofiltration, le CH4 est transformé en composés moins dangereux et par conséquent, le PRP net est réduit. Le faible transfert de masse du CH4 à l’intérieur du biofilm a été noté comme la limitation la plus importante lors de la biofiltration du CH4.
Dans les secteurs industriels responsables des émissions de CH4, ce dernier est souvent présent en mélange avec d'autres types de polluants gazeux tels que des acides gras volatils (par exemple, l'acide acétique), du chlorométhane, du toluène ou des alcools. Dans les industries
6
alimentaires ou les raffineries, le CH4 peut se trouver en mélange avec des vapeurs d'éthanol. Les vapeurs d'éthanol sont présentes dans environ 5% des émissions totales de CH4 dans le monde. La présence de vapeurs d'éthanol lors de la biofiltration du CH4 pourrait produire une variété de défis et de limites en termes de transfert de masse et de cinétique de biodégradation. La biofiltration du CH4 a été habituellement effectuée en régime permanent. Néanmoins, lors de l'application industrielle des biofiltres pour l'élimination du CH4, différentes conditions transitoires peuvent survenir. La performance des biofiltres de CH4 en conditions transitoires peut fournir des informations précieuses pour les responsables de l'usine et les chercheurs œuvrant avec des biofiltres de CH4 à l'échelle pilote ou à l'échelle industrielle. La variation soudaine de la concentration d'entrée des polluants ou du débit de gaz, l'arrêt pendant les fins de semaine ou lors de périodes de maintenance et la présence périodique d'un deuxième polluant sont des situations courantes pour les industries ayant des émissions de CH4. À la meilleure connaissance de l'auteur, aucune étude n'a préalablement discuté de la présence de vapeur d'alcool comme de l'éthanol dans un biofiltre de CH4 ainsi que des limitations associées. En outre, aucune étude n'a discuté de l'effet de différentes conditions transitoires pour un biofiltre de CH4 en termes de charges transitoires, de charges par à-coups, de chargement intermittent d'un deuxième polluant, de périodes d'arrêt. L'objectif général de cette étude était d'étudier la performance en régime permanent ou en régime transitoire des biofiltres pour l'élimination du CH4 en absence ou présence de vapeurs d'éthanol.
Cette thèse contient 6 chapitres comprenant 1 article de revue et 3 articles de recherche. Le chapitre 1 est une introduction au sujet de la thèse. Le chapitre 2 présente une revue de la littérature sur deux groupes de polluants gazeux organiques, ceux pour qui leur biodégradation est limitée par le transfert de masse (tel que le CH4) et ceux pour qui leur biodégradation est limitée par la cinétique de biodégradation (tel que l'éthanol). Le chapitre 3 présente la biofiltration du CH4 en régime permanent sous différentes conditions d'état transitoires (par exemple, variations par à-coups, conditions de carence). Les chapitres 4 et 5 sont consacrés à la biofiltration du CH4 et de l’éthanol présents dans un mélange. Le chapitre 4 présente la performance d'un biofiltre de CH4 sous des ajouts périodiques d’éthanol. Le chapitre 5 présente une évaluation et une comparaison de deux biofiltres différents dans leurs sections inférieures pour l'élimination du CH4 en présence d'éthanol en régime permanent ou en régime transitoire. Le chapitre 6 présente la conclusion de la thèse.
7
CHAPTER 2.
Literature review
Avant propos:
L’article “Elimination of mass transfer and kinetic limited organic pollutants in biofilters: a
review” a été publié dans le Journal “International Biodeterioration and Biodegradation” 119 (2017) 336-348.
TITRE: Élimination de composés organiques à limitations par transfert de masse ou par voie
cinétique
Title: Elimination of mass transfer and kinetic limited organic pollutants in biofilters: a review
Milad Ferdowsia, Antonio Avalos Ramireza,b, J. Peter Jonesa and Michèle Heitza* a: Department of Chemical and Biotechnological Engineering, Faculty of Engineering, Université de Sherbrooke, J1K 2R1, QC, Canada
b: Centre National en Électrochimie et en Technologies Environnementales 2263, Avenue du Collège, Shawinigan, G9N 6V8, QC, Canada
*Corresponding author email: [email protected]
Contribution to the document: This paper presented a literature review on the elimination of
two pollutant’s groups as mass transfer and kinetic limited in biofilters. The removal of CH4 and ethanol as a mass transfer limited and kinetic limited pollutant respectively were discussed in this thesis. Therefore, this review paper is helpful and relevant to the thesis topic. In addition, this review paper presented the removal of mass transfer and kinetic limited pollutants under transient state conditions which is relevant to the main objective of the thesis.
8
Elimination of mass transfer and kinetic limited organic
pollutants in biofilters: a review
2.1 Résumé
Les limitations par transfert de masse et par voie cinétique de composés gazeux sont deux contraintes lors du contrôle de polluants gazeux dans un biofiltre (BF) ou dans un biofiltre à percolation (BTF). C’est d’autant plus problématique si les deux limitations (transfert de masse et cinétique) sont présentes. Dans cet article, des composés organiques ayant des limitations par transfert de masse ou cinétique sont présentés et des études récentes sur ces composés sont passées en revue. Par la suite, les conditions opératoires les plus adéquates pour chaque type de limitations sont discutées. Pour terminer, de nouveaux bioprocédés, tels des biofiltres percolateurs avec deux phases liquides, des biofiltres avec une alimentation par étape et des biofiltres hybrides permettant de surmonter les limitations par transfert de masse ou cinétique de composés organiques sont présentés.
Mots clefs: Rejets gazeux, biofiltre, transfert de masse, cinétique, mélange de polluants, bioprocédés améliorés
2.2 Abstract
Mass transfer and kinetic limitations are two obstacles to the removal of a pollutant from the gas phase in a biofilter (BF) or a biotrickling filter (BTF). The issue becomes more challenging when mass transfer and kinetic limitations are present especially for treatment of pollutants in mixtures. In the present study, the most common organic pollutants which may have mass transfer or kinetic limitations in BFs and BTFs are described. Accordingly, the recent studies of mass transfer limited and kinetic limited organic pollutants elimination in BFs and BTFs are reviewed. Subsequently, the most effective operating parameters for each sort of limitations are discussed. Finally, some improved bioprocesses like two liquid phase biotrickling filters, step feeding and hybrid biofilters to overcome the limitations of mass transfer and kinetic limited organic pollutants are discussed.
9
Keywords: Waste gas, biofilter, mass transfer, kinetics, pollutants mixture, improved bioprocesses
2.3 Introduction
Gaseous emissions like volatile organic components (VOCs) (e.g., benzene, styrene) or volatile inorganic components (VICs) (e.g., hydrogen sulfide (H2S), ammonia (NH3)) from chemical, petrochemical, pulp and paper industries contribute to air pollution [7]. In addition, greenhouse gas emissions (GHGs) like methane (CH4) from landfill, livestock, coal mine and wastewater treatment plants with drastic influence on climate change and global warming are also considered as air pollutants [3, 8]. In some cases, odorous components like acetic acid or ammonia (NH3) are necessary to be removed since they have unpleasant smells [9]. Pollutant’s removal from gas phase is mainly based on two techniques: 1) physico-chemical and 2) biological techniques. Adsorption, absorption, condensation, incineration and plasma are some examples of physico-chemical techniques [7, 10, 11]. Biological techniques are based on pollutant biodegradation by a microbial transformation into carbon dioxide (CO2), water (H2O), biomass, etc. [9]. The initial interest in biological methods for waste gas treatment arose from their promising potential of contaminants mineralization with low secondary pollutions and disposals unlike what usually happens with other physico-chemical methods [9]. Biofilter (BF), biotrickling filter (BTF) and bioscrubber are the main types of bioreactors which have been used for bioxidation of VOCs, VICs, GHGs and odor components [12, 13]. Lab scale BFs and BTFs have been focused in several studies for pollutant inlet concentrations usually lower than 1% (v/v) and gas flow rates usually less than 1 m3 h-1 [14-16]. An aqueous phase (biofilm phase) and a gas phase are in contact with each other in BFs and BTFs. Therefore, the mass transfer of a target pollutant from gas to the biofilm phase as well as the pollutant’s solubility in the biofilm phase are among the concerns which may affect the BF’s performance [17]. For example, mass transfer limitations from gas to the biofilm phase in BFs and BTFs for pollutants like CH4, ethylene (C2H4), n-hexane, toluene, styrene, xylene and α-pinene could be as a result of poor pollutant solubility in the biofilm phase (<500 g m-3Liq at 25 ˚C and 1 atm), high dimensionless Henry’s law constant (>0.1 at 25 ˚C and 1 atm) or high vapor pressure (>5000 kPa at 25 ˚C) [18]. In contrast, components with less mass transfer limitations like alcohols, volatile fatty acids (VFAs) and ketones can be limited by the kinetics of biodegradation. In this regard, the high concentration of pollutants in the biofilm phase may increase the risk of toxicity for the
10
biocatalysts or cause excess biomass growth and pressure drop [9]. A number of studies including review articles discussed the performances of BFs and BTFs as well as operating parameters (filter bed, temperature, moisture content, etc) while paying less attention to the nature of the limitations in terms of mass transfer or kinetics [12, 15, 19].
In this study, two groups of organic pollutants described as mass transfer limited and kinetic limited were selected. Subsequently, a literature review was made discussing about BFs and BTFs performance implemented for each group of pollutants usually in the last 10 years. In addition, the operating parameters that could cause problems for each group of pollutants were analyzed. Finally, the applications and limitations of BFs and BTFs for a mixture of both groups of pollutants were investigated. In this regard, some improved designs and configurations of BFs for treating simultaneously both types of the pollutants were reviewed.
2.4 Biofilter (BF) and biotrickling filter (BTF)
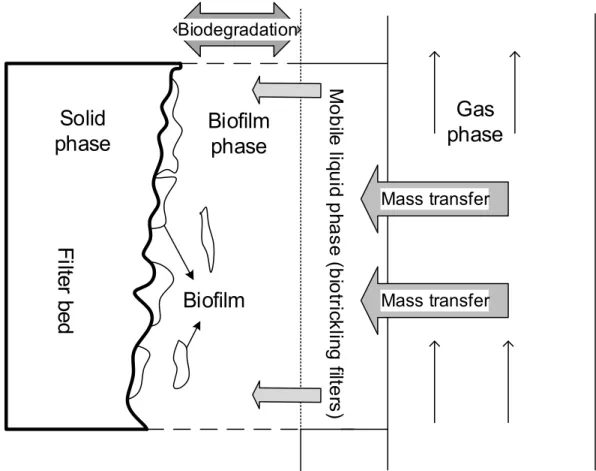
In recent years, conventional BFs have been used as the primary bioreactor configuration for waste gas biotreatment, odor removal or even as a secondary treatment stage after physical-chemical oxidation [14, 15]. In lab scale BFs, a contaminated and humidified air stream is passed through a packed bed column which has been enriched by appropriate biocatalysts [9]. In the presence of oxygen, an organic pollutant, as a substrate, is biodegraded. Thus, the pollutant is converted to less hazardous materials such as CO2, H2O and biomass [9]. The gas flow direction in a BF or BTF can be upward or downward. A solution is frequently supplied to BFs in order to provide sufficient macro and micro nutrients like nitrogen, phosphorous and potassium for the biocatalysts. Figure 2.1 shows the main phenomena which occur during biofiltration. The pollutant biodegradation happens in an aqueous phase (biofilm phase). Therefore, mass transfer of pollutants from gas to liquid phase (biofilm phase) and biodegradation of the pollutant in the biofilm phase by the biocatalysts are the two main limitations for the elimination of gaseous pollutants in biofiltration [17]. The main difference between BFs and BTFs is the presence of a recirculating liquid phase in BTFs. The thickness of the biofilm phase in BFs is small enough to enhance the mass transfer of pollutants from gas into the biofilm phase [17]. The main drawback of BFs is the accumulation of biomass due to the lack of a mobile liquid phase. The mobile aqueous phase in BTFs provides an extra layer of liquid around the biofilm and represents a barrier to contaminant’s mass transfer [17]. However, the mobile liquid phase in BTFs makes the control of operating parameters like pH, temperature, water content and nutrient
11
solution easier. For instance, for treatment of H2S with the potential of acidification, the mobile liquid phase ensures the neutral condition by the addition of buffering materials to the storage tank of recirculation liquid [12].
Mass transfer
Solid
phase
Biofilm
phase
Gas
phase
M obi le liq ui d ph ase (b io tric kl ing filter s)Biofilm
Mass transferBiodegradation
Fi
lter
bed
Figure 2.1: The main phenomena and limitations in biofiltration and biotrickling filtration
2.4.1 Performance parameters
The performance of BFs and BTFs can be illustrated by different parameters [15]: Removal efficiency RE C C
C 100 (%)
Inlet load IL Q C
V (g m-3 h-1)
Elimination capacity (EC C C Q
V (g m-3 h-1)
C and C are the inlet and outlet pollutant concentrations (g m-3) respectively. Q is the gas flow rate (m3 h-1) and (m 3) is the volume of the biofilter.
12
2.5 Classification of organic pollutants based on their mass
transfer and kinetic limitations
Different categorizations of organic pollutants have been suggested based on chemical structures of the components in order to be removed in BFs and BTFs [20]. However, classification of pollutants due to different resistances they meet in their biodegradation in a BF or BTF gives a better understanding of the limitations [20, 21]. According to Figure 2.1, pollutant’s mass transfer from gas phase to the biofilm phase and kinetics of biodegradation are the two most important sorts of limitations in a biofilter. Therefore, a typical organic pollutant in a biofilter with limitations of elimination in terms of mass transfer from gas to the liquid phase is a mass transfer limited pollutant. On the other hand, a typical organic pollutant which is a potential candidate to cause kinetic limitations (e.g., inhibition, toxicity) in a biofilter is a kinetic limited pollutant. Mass transfer and kinetic limited pollutants are defined by the pollutants bioavailability in the biofilm phase in a pseudo gas-liquid equilibrium in a biofilter [17, 22]. In this regard, mass transfer limitation results in a limited bioavailability of a typical mass transfer limited pollutant in the biofilm phase. However, excess bioavailability of a kinetic limited pollutant in the biofilm phase ends up to kinetic limitations in terms of inhibition or toxicity. The bioavailability of a typical organic pollutant can be determined by a gas-liquid equilibrium equation (Henry’s law constant), chemical structure of a pollutant (solubility and miscibility with water) and the state of the pollutant (gaseous or liquid).Table 2.1 shows a classification on the contaminants bioavailability (in the biofilm phase) basis. Physical-chemical properties of the pollutants in terms of water solubility, dimensionless Henry’s law constant and vapor pressure at 25 ˚C and 1 atm are listed.According to Table 2.1, gaseous alkanes and alkenes like CH4 and C2H4, liquid alkanes like n-hexane and n-pentane, liquid alkenes like α-pinene and some aromatics like toluene, styrene and xylene are examples for mass transfer limited pollutants. Basically, for mass transfer limited pollutants, poor solubility in water lower than 500 g m-3 results in high dimensionless Henry’s law constants (>0.1) and could decrease the availability of the pollutants in the biofilm phase. Furthermore, vapor pressures higher than 5000 kPa at 25 ˚C could also diminish the chance of pollutant remaining in the biofilm phase for gaseous pollutants like CH4 and C2H4. In this regard, bioelimination of gaseous pollutants like CH4 or C2H4 might be limited not only by their high Henry’s law constant (>0.1) but also by their high vapor pressure at ambient temperature (>5000 kPa at 25 ˚C).
13
Table 2.1: Physical-chemical properties of mass transfer limited and kinetic limited organic pollutants at 25 ˚Ca Pollutant type Pollutant group Pollutant Pollutant phase Water solubility (g m-3) Dimensionless Henry’s constant Vapor pressure (kPa) Mass transfer limited
Gaseous alkanes Methane Gas 24 28 27260
Gaseous alkenes Ethylene Gas 131 9 6070
Liquid alkanes n-pentane Liquid 39 52 68
n-hexane Liquid 10 70 20
Liquid alkenes α-pinene Liquid 470 0.272 4
Aromatics Toluene Liquid 310 0.113 0.9
Styrene Liquid 180 0.25 1
Xylene Liquid 18 6 60
Kinetic limited
Alcohols Methanol Liquid Miscible 0.0016 16
Ethanol Liquid Miscible 0.002 7
Propanol Liquid Miscible 0.00028 3
n-butanol Liquid 70000 0.000325 1 Volatile fatty acids (VFAs) Acetic acid Liquid Miscible 0.0000122 2 Butyric acid Liquid Miscible 0.00002 0.1 n-valeric acid Liquid 24000 0.00002 0.04 Ketones Methyl ethyl ketone (MEK) Liquid 256000 0.002 13
Acetone Liquid Miscible 0.00136 30 a (Carro, 2014; Dean, 1999; Mackay et al., 2006; Staudinger and Roberts, 1996) [5, 6, 23, 24]
14
Therefore, if a typical component is biodegradable enough by a specific type of microorganism, mass transfer and solubility limitations may hamper its bioavailability in the biofilm phase and could influence the conversion of the pollutant [17].
Pollutants with high ability to transfer into the biofilm phase like alcohols (e.g., methanol, ethanol, propanol and n-butanol), VFAs (e.g., acetic acid, butyric acid and n-valeric acid) and ketones (e.g., acetone, methyl ethyl ketone (MEK)) are categorized as kinetic limited pollutants. According to Table 2.1, the kinetic limited pollutants with low dimensionless Henry’s law constants (<0.1) and vapor pressures lower than 30 kPa (T=25 ˚C) are almost miscible with water. Therefore, the kinetic limitations like toxicity and inhibition for the biocatalyst could happen in the removal of the component in BFs and BTFs [21, 25]. Regardless of Henry’s law constant, the excess bioavailability of some liquid VOCs like alcohols might be as a result of their complete miscibility with water according to their chemical structures.
Therefore, mass transfer limited pollutants are generally hydrophobic or gaseous pollutants and their removal in BFs are limited by mass transfer from gas to the biofilm phase. On the other hand, kinetic limited pollutants are generally hydrophilic pollutants or miscible components with water.
2.5.1 Biofiltration and biotrickling filtration of mass transfer limited
pollutants
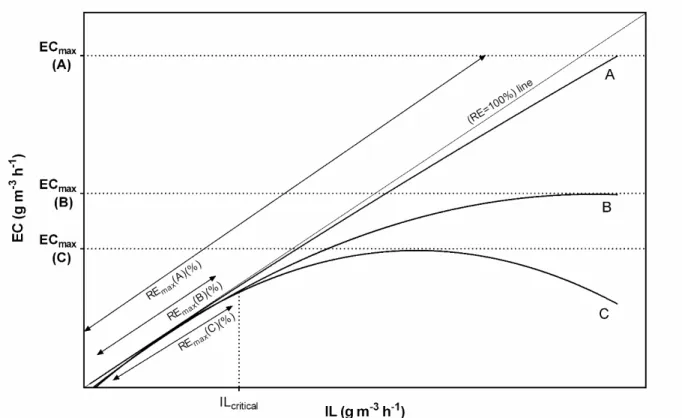
Figure 2.2 shows three typical trends of EC as a function of IL in BFs for mass transfer and kinetic limited pollutant removal. A maximum elimination capacity (ECmax) is the maximum capacity of a BF to remove a pollutant which usually occurs at a specific IL. According to Figure 2.2, the ECmaxs at graphs A and B, correspond to the maximum ILs whereas at graph C, the corresponding IL for the ECmax is lower than the maximum IL. The REmaxs are the maximum removal efficiencies and correspond to the point with least deviations from 100% RE line. It should be pointed out that REmaxs do not necessarily correspond to ECmaxs. A critical IL (ILcritical) in BFs is the maximum IL for a typical pollutant in which a complete removal (RE of 100%) can be obtained. For ILs exceeding ILcritical, the performance of BFs in terms of REs starts to decrease. Therefore, ILcritical is a threshold for BFs in order to be under a safe operating regime.
15
Figure 2.2: Three typical examples (A, B and C) of BF performances (EC vs. IL) for mass transfer and kinetic limited pollutants removal.
Table 2.2 presents the BFs performance to eliminate mass transfer limited pollutants at REmaxs as well as ECmaxs. The studies were carried out in lab scale BFs with different packing materials and no cell immobilization. The REmaxs of gaseous alkanes like CH4 were noticeably far from 100% for ILs in the range of 17 to 160 g m-3 h-1 either in BFs or BTFs. The poor performance of CH4 BFs were attributed to poor mass transfer of CH4 from gas to the biofilm phase [26]. The CH4 mass transfer could be more limited in BTFs due to the presence of the recirculating liquid phase [27]. Therefore, the CH4 REmaxs were usually lower in BTFs than BFs. According to Table 2.2, for CH4 BFs, the REmaxs were in the range of 30 to 62% for corresponding ILs from 17 to 75 g m-3 h-1 while in CH
4 BTFs the REmaxs were in the range of 16 to 40% for corresponding CH4 ILs ranging from 160 to 67 g m-3 h-1 respectively [28, 29].
According to Table 2.2, the CH4 ECmaxs were lower than 30 g m-3 h-1 for ILs up to 160 g m-3 h-1 for BFs and BTFs. For gaseous alkenes like C
2H4, the REmaxs were 80 and 90% for corresponding ILs of 3 and 1 g m-3 h-1 in a BF and a BTF respectively. The EC
maxs of C2H4 were lower than 10 g m-3 h-1 for corresponding IL of 14 g m-3 h-1.
16
According to Table 2.2, for liquid alkanes, alkenes and aromatics removals in BFs and BTFs,
REmaxs generally exceeding 95% could be reachable for corresponding ILs lower than 100 g m-3 h-1. Table 2.2 also shows EC
maxs over 50 g m-3 h-1 for ILs exceeding 100 g m-3 h-1 for liquid alkanes and aromatics eliminations in BFs and BTFs (for most of the studies). The vapor pressures of liquid alkanes, alkenes and aromatics (< 20 kPa at 25 ˚C) are lower than CH4 and C2H4 (27260 and 6070 kPa at 25 ˚C respectively). Therefore, liquid alkanes, alkenes and aromatics are more capable of remaining in the biofilm phase compared to gaseous alkanes and alkenes. Thus, the pollutant mass transfer from gas to the biofilm phase for liquid alkanes like n-pentane and n-hexane, liquid alkenes like α-pinene and aromatics like toluene, styrene and xylene could cause less limitations compared to gaseous alkanes and alkenes (CH4 and C2H4). According to Table 2.2, there was no particular difference between BFs or BTFs for most of liquid alkanes and aromatics in terms of REmaxs and ECmaxs. However, for liquid alkenes removal like α-pinene, enhanced performance parameters (REmaxs and ECmaxs) were obtained for a BF compared to a BTF. For example, Langolf and Kleinheinz (2006) [30] obtained a REmax of 100% for α-pinene ILs up to 100 g m-3 h-1 in a BF. Nevertheless, Montes et al. (2015) [31] reached a REmax of 100% in α-pinene BTF for lower ILs (ILs up to 23 g m-3 h-1). Due to the lack of recirculation liquid phase in the BF, the mass transfer of α-pinene from gas to the biofilm could be enhanced [17].
17 Table 2.2: Removal of mass transfer limited pollutants in BFs and BTFs Pollutant
group Pollutant Bioreactor Filter bed IL (g mPerformance at RE-3 h-1) RE max Performance at ECmax References
max (%) IL (g m-3 h-1) ECmax (g m-3 h-1)
Gaseous alkanes
CH4 BF Inert material 70-75 40 75 29 [32]
CH4 BF Mixture of Wood chips, perlite,
compost
18 62 18 11 [26]
CH4 BF Coal 17 30 139 27 [33]
CH4 BF Mixture of bark chips, perlite,
compost 17 26 85 21 [34] CH4 BTF Polyurethane foam 160 16 160 26 [28] CH4 BTF Stone 67 40 67 25 [29] CH4 BTF Polyethylene rings 3 50 23 6 [35] Gaseous alkenes C2H4 BF Perlite <3 80 14 7 [36] BTF Perlite <1 90 13 9 [37] Liquid alkanes n-pentane BF Perlite 33 100 300 100 [38] n-hexane BF Compost 100 100 600 400 [39] BTF Polyurethane 30-42 84 108 45 [40] Liquid alkenes
α-pinene BF Lava rock <100 100 100 100 [30]
BTF Lava rock <23 100 57 25 [31]
Aromatics Toluene BF Tree bark 80 98 80 80 [41]
BF Lava rock <19 100 150 80 [42]
BF Polyurethane foam <70 100 120 80 [43]
BTF Synthetic <70 100 290 200 [44]
Styrene BF Peat 20-45 95 173 81 [45]
BTF Polyurethane sponge 65 87 200 165 [46]
Xylene BF Sugar bagasse 4 95 100 60 [47]
18
2.5.2 Biofiltration of kinetic limited pollutants
Table 2.3 presents BFs and BTFs performance for kinetic limited pollutants like alcohols (e.g., ethanol, methanol and n-propanol), VFAs (e.g., acetic acid and butyric acid) and ketones (e.g., MEK and acetone). According to Table 3, REmaxs exceeding 95% could be obtained for ILs higher than 94 g m-3 h-1 in BFs and BTFs. For example, complete removal of methanol was reached in a BTF for an IL of 250 g m-3 h-1 [49] or in a BF with corresponding methanol IL of 290 g m-3 h-1 [50]. Sheridan et al. (2003) [51] reported complete elimination of n-butyric acid in a BF for an IL of 230 g m-3 h-1 [51].
According to Table 2.3, unlike mass transfer limited pollutants, BTFs for kinetic limited pollutants might provide an improved performance comparing with BFs. For instance, Ramirez-Lopez et al. (2010) [52] obtained a REmax of 100% in a BF for methanol ILs lower than 125 g m-3 h-1 and Avalos Ramirez et al. (2009) [49] obtained a methanol REmax of 95% in a BTF for ILs up to 250 g m-3 h-1. For complete ethanol removal, the corresponding IL of 200 g m-3 h-1 in a BTF [53] was twice as high as in a BF [54]. Table 2.3 also provides ECmaxs for kinetic limited pollutants. For alcohol BFs, the ECmaxs were in the range of 100 to 1400 g m-3 h-1 for corresponding ILs from 150 to 2000 g m-3 h-1 which was 4 times higher than for other pollutants like VFAs and ketones. According to Table 2.3, BTFs usually resulted in higher ECmaxs compared to BFs. For example, ECmaxs of 2160 and 970 g m-3 h-1 were obtained for corresponding methanol and ethanol ILs of 3700 and 1610 g m-3 h-1 [49, 53] in BTFs which were almost twice as high as in BFs. A few studies compared a BF and a BTF for a target kinetic limited pollutant. Morotti et al. (2011) [55] compared a BF and a BTF for ethanol vapor removal and obtained similar ECmaxs as 46 g m-3 h-1 for IL of 55 g m-3 h-1 for both configurations. Dissolving of kinetic limited pollutants like alcohols in biofilm phase could be toxic for biocatalysts [21]. For example in a methanol BF, the minimum IL which caused toxic impact and decreased the RE was reported as 300 g m-3 h-1 [50]. Transient conditions in the forms of shock loads or starvations are common situations in BFs according to their industrial applications [56].
19 Table 2.3: Removal of kinetic limited pollutants in BFs and BTFs
Pollutant
group Pollutant Bioreactor materials Packing IL (g mPerformance at RE-3 h-1) RE max Performance at ECmax References
max (%) IL (g m-3 h-1) ECmax (g m-3h-1)
Alcohols Methanol BF Peanut shells <125 96 2007 1438 [52]
Methanol BF Lava rock <290 100 420 310 [50]
Methanol BTF Polypropylene
spheres
<250 100 3700 2160 [49]
Ethanol BF Sugar cane
bagasse 94 100 154 107 [54] Ethanol BTF Polypropylene spheres <250 100 1610 970 [53] n-propanol BF Compost– woodchip 2-85 100 760 600 [57] Volatile fatty acids (VFAs)
Acetic acid BF Lava rock <120 100 120 120 [58]
Butyric acid BF Wood chips <230 100 230 230 [51]
Ketones MEK BF Fern chips <115 91 115 105 [59]
Acetone BF Ceramic 30-90 97 350 300 [60]
Acetone BTF Polypropylene
rings
20
Biofilters for kinetic limited pollutants removal successfully tolerated shock loads in terms of inlet concentration sudden variation. Rene et al. (2010) [62] applied a methanol shock load from 60 to 250 g m-3 h-1 (inlet concentration from 1.5 to 5 g m-3) for 8 hours and observed a methanol RE reduction from 100 to 70%. The promising tolerability of kinetic limited pollutants BFs to shock loads might be addressed to the enhanced bioavailability of kinetic limited pollutants in the biofilm phase. In this regard, the biofilm phase might play as a reservoir to absorb the kinetic limited pollutant immediately in order to degrade it gradually. The recovery of the BF in terms of methanol RE, when the methanol IL restored to the initial value (60 g m-3 h-1) was instantaneous. However, the recovery of kinetic limited pollutants BFs after a shock load can be delayed because of the excess presence of the kinetic limited pollutant in the biofilm phase. A slight reduction of RE from 100 to 94% was observed for a methanol BTF when the IL suddenly increased from 50 to 600 g m-3 h-1 for 5 hours at a constant EBRT of 26 s [63]. Nevertheless, a significant methanol RE reduction of 25% occurred after a shock load while the methanol IL brought back to 50 g m-3 h-1. This reduction was attributed to the presence of methanol with corresponding concentration of 3000 g miquid-3 in the liquid phase of the BTF.
2.6 Important parameters for mass transfer and kinetic limited
pollutants removal in BFs and BTFs
2.6.1 Support media
Packing materials should provide an adequate environment for microorganisms to grow and perform biological activities [7, 64]. Many factors like specific surface area, moisture holding, low density and tendency to compact, adsorption properties and nutrient supply determine the characteristics of a proper material to be used in a BF or BTF [65]. Biotrickling filters are filled with inert packing materials like perlite, lava rock, ceramic, granular activated carbon (GAC), polyurethane foam and polypropylene spheres [53, 66-69] while BFs are frequently filled with organic packing materials such as soil, compost, peat, leaves and wood chips [70-74] or a mixture of organic and inorganic packing [75, 76]. Table 2.4 presents the effect of bed materials on the BF and BTF performance for mass transfer limited pollutants removal.
21
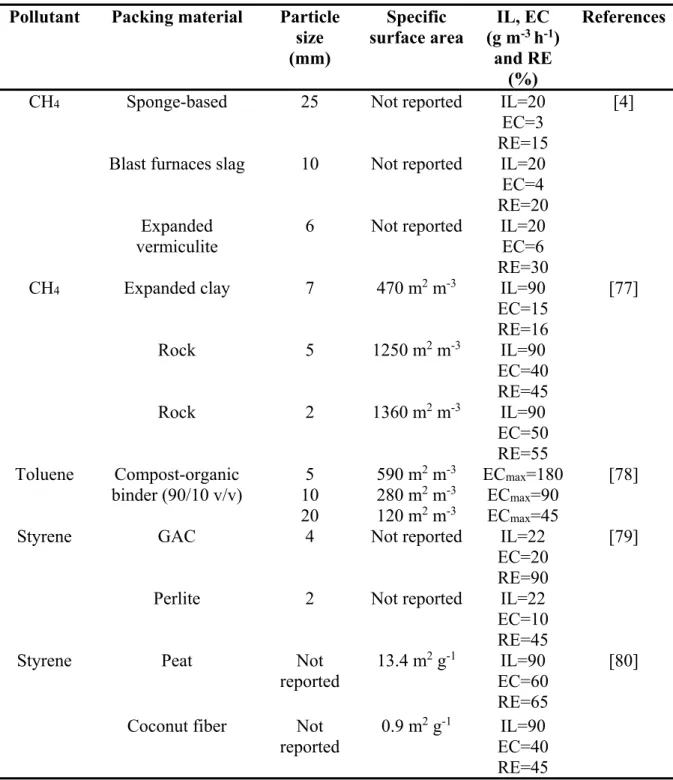
Table 2.4: Mass transfer limited pollutants removal in BFs with different packing materials
Pollutant Packing material Particle size (mm)
Specific
surface area (g mIL, EC -3 h-1)
and RE (%)
References
CH4 Sponge-based 25 Not reported IL=20
EC=3 RE=15
[4]
Blast furnaces slag 10 Not reported IL=20 EC=4 RE=20 Expanded
vermiculite 6 Not reported IL=20 EC=6 RE=30
CH4 Expanded clay 7 470 m2 m-3 IL=90
EC=15 RE=16 [77] Rock 5 1250 m2 m-3 IL=90 EC=40 RE=45 Rock 2 1360 m2 m-3 IL=90 EC=50 RE=55 Toluene Compost-organic binder (90/10 v/v) 5 590 m2 m-3 ECmax=180 [78] 10 280 m2 m-3 EC max=90 20 120 m2 m-3 ECmax=45
Styrene GAC 4 Not reported IL=22
EC=20 RE=90
[79]
Perlite 2 Not reported IL=22
EC=10 RE=45 Styrene Peat Not
reported
13.4 m2 g-1 IL=90 EC=60 RE=65
[80]
Coconut fiber Not
reported 0.9 m
2 g-1 IL=90 EC=40 RE=45
22
The target pollutant may restrict the selections for an appropriate packing material. For mass transfer limited components removal in BFs, high specific surface area as well as adsorption properties of the packing material may support the mass transfer of the pollutant [15, 64]. Nikiema and Heitz (2010) [77] compared 3 organic packing materials for CH4 biofiltration. When the specific surface area of the packing materials increased from 470 to 1360 m2 m-3, they observed an EC improvement from 15 to 50 g m-3 h-1 for a CH
4 IL of 90 g m-3 h-1. Delhoménie et al. (2002) [78] studied the characteristics of 3 different compost-organic binder packing materials for toluene BFs. They obtained ECs of 180, 90 and 45 g m-3 h-1 for pellets with specific surface area of 590, 280 and 120 m2 m-3 respectively for IL variation from 100 to 216 g m-3 h-1. Thus, the ECs were approximately improved linearly when the pellets specific surface area increased. A comparison of peat and coconut fiber as support media with corresponding specific surface area of 13.4 and 0.9 m2 g-1 for styrene biofiltration was performed by Perez et al. (2014) [80]. The peat-based biofilter showed a higher EC of 60 g m-3 h-1 compared to the coconut fiber biofilter with an EC of 45 g m-3 h-1 for a constant IL of 90 g m-3 h-1 possibly due to its higher specific surface area. Paca et al. (2009) [79] compared two BFs with GAC and perlite as filter beds respectively for styrene elimination. They obtained an EC of 20 g m-3 h-1 for the BF with GAC versus an EC of 10 g m-3 h-1 in the perlite BF for an IL of 22 g m-3 h-1 due to high adsorption properties of GAC compared to perlite.
It should be pointed out that packing materials with high density and tendency to compact with small pore size like raw materials compost may result in excess pressure drop [15, 64, 66]. Some studies on BFs of kinetic limited pollutants like ethanol and MEK [53, 81] reported excess biomass production. Excess biomass production in kinetic limited pollutants BFs might cause problems such as clogging, channeling and high pressure drop [82]. Ryu et al. (2010) [83] observed a linear pressure drop increase from 1 to 100 mmH2O mbed-1 for a benzene BF packed with polyurethane foam while the biomass concentration increased from 0.8 to 3 gbiomass gbed -1. In addition, the benzene EC decreased from 600 to 200 g m-3 h-1 (IL of 600 g m-3 h-1) as a result of the excess biomass accumulation. Inert and large particle packing materials like ceramic pellets provided a more even distribution of biomass [82, 84]. Morgan-Sagastume et al. (2001) [85] compared to inert porous pellets and wood chips for methanol biofiltration. For an IL of 150 g m-3 h-1, the wood chips bed BF exhibited 6 fold higher pressure drop comparing with an inert bed BF (260 versus 50 mmH2O m-1). Therefore, packing materials like compost which
23
enhance the pollutant mass transfer for mass transfer limited pollutant may cause excess pressure drop for kinetic limited pollutants.
2.6.2 Water content
The principal role of humidification in BFs is to guarantee an aqueous phase for microorganisms [86]. In biofilters, low water content, less than 40% w water w packing -1, contributed to more than 75% of operating problems such as bed drying and channeling, which are irreversible phenomena [86]. In contrast, high moisture content (>80% w water w packing -1) may result in the formation of anaerobic zones and excess pressure drop [85, 86]. The optimum value of water content depends upon media composition, and operating parameters like temperature and contaminants [86, 87]. The water content in BFs is frequently set at 40-60% w water w packing -1 for most of packing materials [86, 87].
For mass transfer limited pollutants, the greater amount of water available in the BFs presents a more pronounced barrier to the pollutant’s mass transfer into the biofilm phase [88]. In some BFs, beside pre-humidification of the inlet air stream, a secondary humidification is performed by irrigation. This type of humidification results in a thicker biofilm layer and provides a higher mass transfer barrier for pollutants [88, 89]. Bagherpour et al. (2005) [88] reported a 20% decrease of RE for an IL of 0.1 g m-3 h-1 in an α-pinene BF with a volume of 93*10-4 m3 when 83*10-5 m3 water was added daily. In BTFs, liquid recirculation flow rate is a key factor either in startup period or during operation [14]. High recirculation liquid flow rates may decrease the mass transfer of mass transfer limited pollutants from gas to biofilm phase. Lee et al. (2010) [37] studied the biotrickling filtration of ethylene and demonstrated that trickling liquid flow rates higher than 5.4*10-3 m3 h-1 (velocity of 0.8 m h-1) diminished the surface area of the packing and caused mass transfer limitations. However, exceeding liquid trickling velocity for kinetic limited pollutants elimination in BTF may result to an enhanced pollutant mass transfer from the liquid to the biofilm phase. In addition, increasing the trickling liquid velocity can avoid liquid channeling and ends up to a more uniform water distribution in a BTF [90]. To our best knowledge, no study discussed about the effect of water content for organic kinetic limited pollutants in BFs and BTFs.
24
2.6.3 Temperature
Temperature is a key parameter in BFs and BTFs since it has different effects either on mass transfer of contaminant from gas to biofilm phase or on kinetics of biodegradation. The optimum temperature for BFs has been reported in the range of 15 to 30 °C either for mass transfer or kinetic limited pollutants [91-93]. According to the industrial requirements, it is hardly possible to maintain the temperature in the optimum range due to unavoidable temperature gradient between the inlet air stream and the support media or between outside temperature and the BF. Therefore, BFs and BTFs should be tolerant of low temperatures (<20 °C) or high temperatures (> 35 °C). Table 2.5 presents mass transfer and kinetic limited pollutants removal in BFs under different temperatures.
Few investigations compared the performance of a BF under mesophilic and thermophilic conditions for mass transfer and kinetic limited pollutants to verify the BF stability under harsh conditions. Mohammad et al. (2007) [93] successfully removed benzene, toluene, ethyl benzene and xylene (BTEX) vapors under mesophilic (20 °C) and thermophilic (50 °C) conditions.
Depending on ILs (3-250 g m-3 h-1), under mesophilic condition, ECs varied from 3 to 188 g m-3 h-1 with an average RE of 96%. Nevertheless, under thermophilic conditions, the ECmax
and RE were 218 g m-3 h-1 and 83% respectively which showed a higher EC compared to the mesophilic conditions [93].
In general, increasing temperature results in increasing Henry’s law constant and leads to a decrease of contaminant’s solubility in the biofilm phase [18]. Thus, for mass transfer limited pollutants, rising temperature could diminish the performance of BFs and BTFs [92, 93]. Zamir et al. (2014) [94] increased the temperature of an n-hexane BF from 35 to 40 and 45 °C for an IL of 500 g m-3 h -1. The RE consequently dropped respectively from 100 to 80% due to n-hexane mass transfer limitations and from 80 to 10% because of microbial activity reduction. However, most of the studies evaluated the global effect of the temperature on a BF performance and not exclusively on mass transfer or kinetic limitations. Ménard et al. (2011) [92] investigated the bioconversion of CH4 in a BF in the range of 4 to 43 °C. They obtained an optimum temperature range of 30 to 34 °C with an EC of 30 g m-3 h-1 for an IL of 80 g m-3 h-1.
25
Table 2.5: Mass transfer and kinetic limited pollutants removal in BFs under different temperatures Pollutant Temperature (°C) IL (g m-3 h-1) EC (g m-3 h-1) RE (%) References CH4 4 80 1 2 [92] 14 80 10 13 25 80 20 25 30 80 25 31 43 80 20 25 BTEX 20 3-250 3-188 96 [93] 50 3-250 3-218 83 n-hexane 35 500 500 100 [94] 40 500 400 80 45 500 50 10 Ethanol 22 230 140 60 [95] 53 230 140 60 Ethanol 25 170 120 70 [91] 30 170 140 82 35 170 100 60 40 170 95 55 n-butanol 30 156 140 90 [96] 35 156 130 85 40 156 140 90 45 156 94 60
For kinetic limited pollutants, the temperature effects on the mass transfer can be negligible. Therefore, the biodegradation rate and the BF performance are improved by raising the temperature up to an optimum value [18]. Cox et al. (2001) [95] studied the performance of a BTF for ethanol vapors elimination at 53 °C and 22 °C. They observed a higher degree of ethanol mineralization of 60% at 53 ˚C comparing with 46% at 22 ˚C. The BF RE were the same for
![Table 2.5: Mass transfer and kinetic limited pollutants removal in BFs under different temperatures Pollutant Temperature (°C) IL (g m -3 h -1 ) EC (g m -3 h -1 ) RE (%) References CH 4 4 80 1 2 [92] 14 80 10 13 25 80 20 25 30 80 25 31 43](https://thumb-eu.123doks.com/thumbv2/123doknet/3557598.104257/38.918.129.811.163.859/transfer-kinetic-pollutants-different-temperatures-pollutant-temperature-references.webp)