Any correspondence concerning this service should be sent
to the repository administrator:
[email protected]
This is an author’s version published in:
http://oatao.univ-toulouse.fr/22012
Official URL
DOI :
http://doi.org/10.1109/ISKO-Maghreb.2013.6728198
Open Archive Toulouse Archive Ouverte
OATAO is an open access repository that collects the work of Toulouse
researchers and makes it freely available over the web where possible
To cite this version:
Barros Sampaio, Ricardo and El Haddadi,
Anass and Bahsoun, Wahiba and Dousset, Bernard Data on Social
Network Analysis on Malaria. (2014) In: 3rd International
Symposium ISKO-Maghreb, 8 November 2013 - 9 November 2013
(Marrakech, Morocco).
Data and Social Network Analysis on Malaria
Ricardo BARROS SAMPAIOAffiliation: Universidade de Brasilia – UnB; Affiliation: FIOCRUZ Brasília
Brasilia, Brazil
Anass EL HADDADI Affiliation: Université d’Agadir
Agadir, Maroc
Wahiba BAHSOUN
Affiliation: IRIT Université Paul Sabatier Toulouse, France
Bernard DOUSSET
Affiliation: IRIT Université Paul Sabatier Toulouse, France
Abstract - In order to understand the existent and in formation relationships that might surface from scientific publications it is necessary to use methods for data and network analysis, besides the concepts of information flow and knowledge creation within organizations. The aim of this work was to show the application of tools and methods for data and network analysis and how those methods can bring forward proposals to improve the understanding of a specific disease, Malaria, within the scientific publications. The study of relational data retrieved from different databases might be elucidating in an environment, health system, which happens to be quite complex due to its many elements involved. How these elements interact within each other in order to fulfill the need to serve the population needs to be understood. The study of scientific publications is just one of the areas that might help decision makers have a better grasp on how to deal and focus on the needed areas.
Keywords - Scientific and technological vision, bibliometric, graphs, social networks, geo-strategy, visualization, interactivity, neglected diseases, malaria
I. INTRODUCTION
The use of data and social analysis tools has become a very important technique in order to find and retrieve relevant information. With the use of massive storage spaces and great amounts of data new technologies for sorting, retrieving and visualizing this information is necessary. The use of data analysis on scientific publications facilitates and bring forward information that could not been found with ancient data analysis methods.
The research universe defined for this study is Malaria disease contained in the so-called neglected tropical diseases (NTD). The term NTD refers to a group of diseases that are especially endemic in low-income populations living in tropical and subtropical countries. However, up to this date, there are no clear or agreed definitions of what a neglected disease is constituted by. According to the 2010 report from the World Health Organization (WHO) “Working to Overcome the Global Impact of Neglected Tropical Diseases” the NTDs affect more than 1 billion people around the world.
The known diseases are defined by the WHO as types I, II and III where Malaria is considered a type III disease. The definition includes the wealth of a country between rich and poor, the state of its development between developed and developing and most importantly a measure of the burden of diseases by the incidence of the disease within the population (CEWG 2012). The definitions themselves are combined such that:
x Type I diseases: are incident in both rich and poor countries, with large numbers of vulnerable populations in each, example cancer.
x Type II diseases: are incident in both rich and poor countries, but with a substantial proportion of the cases in poor countries, example tuberculosis.
x Type III diseases: are those that are overwhelmingly or exclusively incident in developing countries, example malaria.
With regard to investments in the area, those diseases do not receive adequate attention for its treatment and eradication, which perpetuates the condition of people who are exposed to them [1].
It’s imperative that new tools and approaches being developed focus on facilitating public policy planning and foster the management of innovation in countries’ public health systems [2]. Recent studies on Leishmaniasis [3] and Chagas disease [4] used the Medline database and helped us with the understanding and alignment of our work. A comparison with results for co-authorship research [5] has also been made in regards to the same database analyzing the relationships within the scientific community.
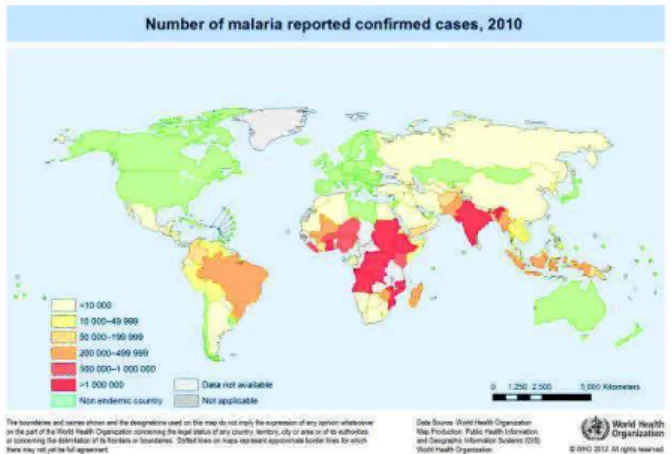
According to the World Malaria Report [6] in 2010 there were an estimated 219 million cases and 660.000 deaths. Malaria is present in over 100 countries and threatens half of the world’s population. In sub-Saharan Africa malaria is the single largest cause of death for children under five. However there is an expectation of 75% reduce in malaria cases by 2015 compared to year 2000 due to investments and collaborative work. Investments in the area have grown significantly in the
past years from less than US$ 100 million in 2000 to US$ 1.71 billion in 2010. The increased investments have their consequences on the significant growth of research on the area. Figure 1 shows a world map of malaria endemic countries such that the countries in orange and red are the most affected ones.
II. DATA ANALYSIS OF A NEGLECTED DISEASE The use of data analysis for neglected diseases through bibliometric or social network on scientific publications is a way to help managers on different positions cope with the necessity to view and take decisions on those areas based on reliable information regarding research. The use of tools and technologies on those areas has helped to find and manage information on large sets of data.
A. METHOD FOR DATA TREATMENT
For the data treatment and analyses we used the platform software Tetralogie. The software allows several and remote users to conduct strategic analysis from heterogeneous textual data through analysis of conventional and innovative methods. With statistical methods and exploratory data analysis methods, it shows strategic information such as actors identity, mobility, emergence and evolution of topics, concepts and terminology. Another feature of the software is that it allows graphical visualization for understanding human activities and their interactions as well as their evolution in a decision-making perspective. It combines static and dynamic visualization where the static aspect is based on a representation space, in which the precepts of graph theory are applied. The dynamic visualization applies features and capabilities to further understand evolution of the data and facts in respect to time. Tetralogie allowed us to identify the role of data within the structure, analyzing their neighborhood, filtering, k-core, transitivity, back to the source documents, to partition the graph or to focus on its structural features [7].
B. DATA RETRIEVED
For this study we have used the PubMed database, which accesses the Medline database. PubMed is a free database accessing references and abstracts on life sciences and biomedical topics. The access to the database occurred during the months of May and June, 2013. We have decided to take into consideration only the publications and patents from 2000 to 2012 included.
The research has been made taking into consideration authors of articles, countries where those authors were from, journals used for the scientific publications besides MeSH (Medical Subject Headings). Data files were retrieved from PubMed with the term/descriptor “Malaria” for title and abstract.
In regards to the number of publications for the years studied we have retrieved 27.880 articles containing a total of 51.720 authors from 121 different countries. The number of journals added up to 2.330, however only 412 of those had 10 or more articles in the area. The number of MeSH words filed on those articles were 8.890 from which the top 09 MeSH words were mentioned more then 10.000 times.
III. NETWORK ANALYSIS
The pattern of relationships of a system can be represented as a network where system components are the vertices and the connections between them ties. The structure of these networks and the specific pattern that might arise from its analyses has a major impact on the behavior of the system and its informational structures. Understand patterns in existing socio-technical networks and to intervene in these networks is one of the possibilities raised by this study.
The Network Analysis or Social Network Analysis (SNA) includes an extensive set of methods for assessing the structure of social groups [8], [9]. The use of SNA enables differentiated perception of a social environment. With this tools a new phenomena can be investigated and new hypotheses can be established. The SNA is derived from both the social sciences and the exact sciences, and their applications are enhanced by the ability to compute mathematical calculations and modeling as well as the expansion of communication networks and the use of digital environments.
The SNA brought interest from researchers in different fields of knowledge. In attempt to understand the impact of the relationship structure on networked environments, SNA gave rise to several analysis methods, which were based on the relationships between individuals or other type of elements, in a structured shaped network.
A social network consists of one or more finite sets of actors (vertices) and the defined relationships between them. The actors in a social network can be either individuals or companies, analyzed as individual units, as well as collective social units, for example, departments within an organization, public service agencies, nation-states of a continent or the world. The concept of actor is flexible, allowing different levels of aggregation, which allows its adaptation to different research problems [9].
A network is a simplified representation of a system that is reduced to an abstract structure consisting largely of patterns of relationships among the vertices. The vertices and lines can have extra information like names or size so that more details about the system can be captured. However, even with this extra information still much information is lost in the process of reducing an entire system on a network representation [5].
Besides these scholars, work done in the area of biotechnology and in the area of neglected diseases in NTDs endemic countries has been a reference to this scientific work. Dr. Carlos Morel Medici has published a series of articles using the methods of SNA to relate co-authorship in scientific research [1]. In France Dr. Brigitte Gay has conducted research on partnerships in the biotechnological industry and how these partnerships can define the success or failure of their companies [11], [12].
IV. RESULTS
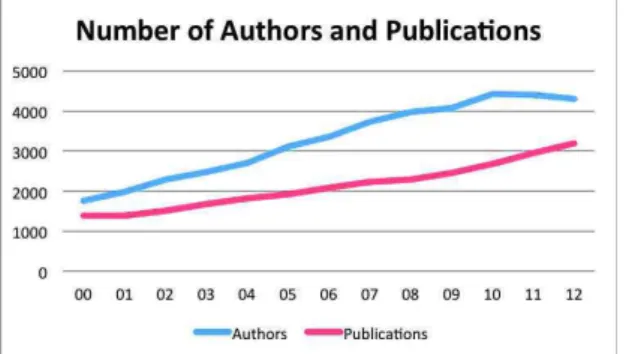
The first step on our study was to understand the growth in regards to the numbers of publications and authors per year as seen in figure 2.
As can be seen on the figure, more publications have a direct relation to increased number of authors. With more and
new researchers involved the area tend to be more dynamic and new finds could help solve issues related to the disease. The total number of publications and authors has increased steadily the past 13 years which might collaborate with the investments in the area and the reduce expectation of malaria cases. The total number of publications has almost double on those years while the number of authors in the area has increased almost 2,5 times.
A. COUNTRIES, JOURNALS AND AUTHORS PUBLICATIONS In regards to country publications we can see a growth in interest, which has more than doubled the number of publications since 2000 in most countries but more so on countries with endemic problems such as India, Thailand, Nigeria, Kenya and Brazil. Those countries are becoming more involved in research, and due to its close relation to the disease there is an urge to find solutions. However, countries such as USA, UK, France and Australia still play an important role on research and publications. The financial support received by those countries on research and technologies has helped millions of people. Figure 3 shows an overview of the world map in terms of publications on PubMed. The countries with a lighter green have more publications than countries with darker green. In the past few years countries such as India, Brazil and China, which are part of the “BRICS”, have had an important role over those researches.
Another area for our study was the Journal’ publications which is also an important feature to be analysed in scientific research. More journals interested in the area directly result in more publications and more research. Table 1 shows the journals with the highest number of publications over the past 13 years. The journals with higher degree of interest in the area, in regards to the number of publications are Malaria Journal in the top of the list with 2.110 publications over the
period followed by The American Journal of Tropical Medicine and Hygiene with 1.209 publications.
Table 1 – Top Journals by the number of publications per year
Journals Number of Publications per Year (2012 – 2001)
Sum ‘12 ‘11 ‘10 ‘09 ‘08 ‘07 ‘06 ‘05 ‘04 ‘03 ‘02 ‘01 ‘00 Malaria Journal 2110 409 361 350 308 250 161 112 59 43 41 16 0 0 American Journal of Tropical Medicine 1209 82 82 95 87 65 152 135 100 110 102 71 82 46 Plos One 841 278 219 136 91 78 37 2 0 0 0 0 0 0 Tropical Medicine International Health 550 25 32 24 31 33 48 61 54 66 56 49 34 37 Trans of the Royal
Society of Tropical Medicine and Hygiene 510 17 12 38 49 37 43 48 43 32 49 50 45 47 Journal of Infected Diseases 429 37 34 30 40 34 38 40 48 31 29 25 23 20 Infection and Immunity 433 21 22 30 24 28 32 42 50 47 34 33 26 44 Acta Tropical 413 58 25 44 44 30 20 39 43 47 23 18 11 11 Trends in Parasitology 387 22 29 31 27 49 32 26 34 29 37 32 39 0 Lancet 358 22 24 37 29 17 21 27 23 45 22 30 30 31
As for the authors we can notice on table 2 that some of them have a higher number of publications, much greater than the average researcher on the area. The top 10 authors for example have more than 150 publications (11 are shown in the table) over the period while the mean number of publications per author is 2,3. This demonstrates a high concentration or centrality in a network. One problem that we might encounter in researching over authors publications is theirs alias or different formats for ones own names such as smith t or smith .t .a which might characterize the same person. To partially resolve the problem, Tetralogie creates a synonymous table for authors and other elements as needed. For the data analysed there were a table with 7.036 author synonymous, so for those authors all their publications were added up to one name.
Table 2 – Author Publication
Journals Number of Publications per Year (2012 – 2001)
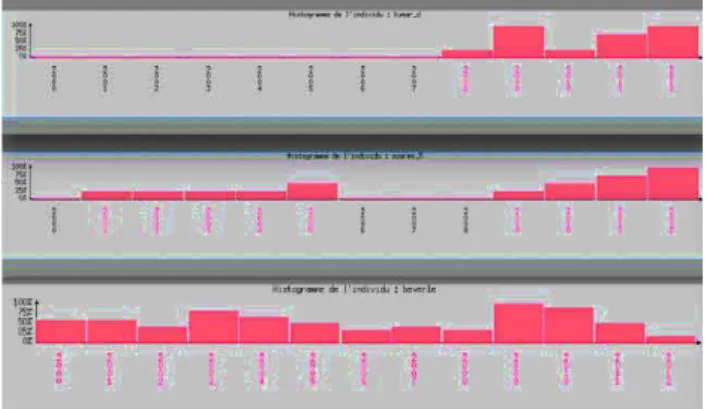
Sum ‘12 ‘11 ‘10 ‘09 ‘08 ‘07 ‘06 ‘05 ‘04 ‘03 ‘02 ‘01 ‘00 White, N 310 37 29 25 20 27 21 22 22 26 21 21 18 21 Looareesuw 221 0 1 4 3 13 16 19 18 29 30 25 37 26 Kremsner, P 208 9 15 13 19 12 18 16 22 18 20 17 14 15 Marsh, K 193 12 16 14 19 16 20 16 22 15 8 17 10 8 Snor, R 182 14 14 25 16 18 10 17 15 14 9 15 5 10 Doumbo, O 175 20 23 18 19 15 17 14 19 9 6 7 4 4 Nosten, F 172 29 20 16 9 17 14 11 10 13 8 6 11 8 Rosenthal, P 168 18 18 19 19 17 15 16 7 13 10 7 5 4 Greenwood 159 6 6 21 17 18 16 12 5 5 8 8 6 10 Alonso, P 151 26 25 10 23 16 10 8 3 7 5 7 5 6 Smith, T 138 17 10 5 9 9 14 27 8 10 8 9 7 5 The understanding of the participation of those authors during the period is also important. Figure 4 shows an analysis on individual authors called “Histogram of the Individual” over the period from 2000 to 2012, where the red bar demonstrate the number of publications for that particular year. As an example we have chosen authors with different characteristics such as author that has just come into the field in regards to publications (top graph) and only has published on the past 5 years (2008 to 2012). Authors that have not published during a period of time (middle graph) (dud not publish on 2006, 2007 Figure 3 – Country Publication
and 2008); Or authors which have been consistent and present during the entire period (published all years from 2000 to 2012).
This type of analysis can be used to verify individual behaviours on specific authors, such patterns on publications.
B. SOCIAL AND MORPHOLOGI CAL NETWORKS ANALYSIS As we have mentioned on this study new forms of analysis must take place in order to better understand the information that is available. One of those forms is the network analysis,
which consists of an analysis over the relationship amongst people or words over those publications. The most common and already in use over scientific publications is the social network analysis where authors, which have co-author a paper, demonstrate a relationship and so can be analyzed as such. One important issue related to visual analysis is the ability to understand what has been presented, which might become a problem when we are dealing with large sets of data such as the case of scientific publications. Before we can make any sense of what might appear on a network graph it is necessary to sort the data that is most important or relevant at the moment.
Figure 5 shows 3 tables for an author relationship with a lower density for the ones in the right compared to the previous one in the left. The left most table on figure 5 shows the authors with 5 or more publications, over the period study, and its relationships. An author defined on the x axis, that have co-author a paper with another co-author, on y axis, will have a red dot over its column and on the respective line for its companion. Once we were dealing with more than 50.000 authors, the size of the table, without the correct filters might become an issue. Noticed that on that figure there is a great density where most of the authors have relationships with several of its peers. The red line crossing the center is where the author relates to itself on the x and y axis and is not considered. Because the table is a symmetric matrix all the dots
on the left of the center line will appear on the right side of that line.
One of the analyses for that graph is the clustering coefficient, which were 0,496 for the Malaria co-authorship. The clustering coefficient measures network ‘‘clustering’’ or ‘‘transitivity,’’ which is the probability that two of a scientist’s coauthors have themselves coauthored a paper. In science a high clustering coefficient would suggest that people are working together quite often, while a very detached network, as in patents for example, might suggest that people very rarely contribute with people outside its group. This demonstrates that on the malaria research environment people tend to collaborate quite often with each other. This is also true for other areas of research [5].
The middle table shows the relations amongst authors that have worked together on at least two occasions (publications) and the right most table authors that have worked together on at least three occasions. From the rightmost table we focus our analysis on the area where there is a greater concentration (top left) of relationships and from there we draw figure 6.
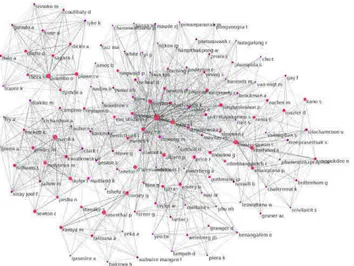
The social network analysis consistsof understanding the connections (relations) existent over the network. Each red dot on figure 6 denotes a researcher and each line a relationship with another researcher. People with more connections have worked with more people and in consequence they have a higher centrality. Some interesting connections happen also amongst clusters. On Figure 6 we have 3 clusters that are connected with each other by few people. Those researchers might not have a higher centrality degree (absolute number of connections) but are key to keep the network together and help the flux of information. For this network we are showing authors that have at least 5 publications over the period and that have worked together on publications on three different occasions. The graph is only a partial view of the third table on figure 5.
A number of conclusions could be made with a simple visualization analysis over the graph. The authors, for example, with higher centrality might have the ability to influence a greater number of people. On the other hand, those same authors are exposed to a great number of ideas. As for the researchers that make the connections between clusters we can say that they might work as gate keepers and are the ones responsible to share new ideas to their own group or close related friends. A closer study over each individual author and its own work is necessary to further understand the possibilities and implications of such a graph but for the purpose of this work we have only raised the issue without a deeper analysis. The graph helps us to pinpoint the most important players and the ones we should pursue a further study.
Figure 4 – Author Individual Publication per Year
Another network visualization can be done using morphological analysis. Figure 7 shows the network over the MeSH words. Each red dot characterizes a key word used on a paper such as “carbon monoxide”, “heme Oxygenase-1”, “electron transport”, “malaria” and so forth. The analysis consists in viewing how often that particular word comes along with related words. This might show a characteristic of research. As one example we have found that metal words very often come along together forming a cluster, such as silver, mercury and others and usually in researches done by countries in south east Asia. Words that often come along on the same papers might demonstrate a type of research or methods been used over time.
Once again our study focuses on the ability to use such graph analysis to understand and point the important nodes, words in these case, which deserves a further analysis. A diachronic analysis over the evolution of MeSH words in a scientific area might also be of great importance.
V. CONCLUSION
This study was an attempt to apply some methods to analyze data focusing on Malaria, a neglected disease. We have
used data and network analysis tools on scientific databases. This line of research have been made by different authors before and now we aimed to put together some of the techniques used.
As for the findings on the field we can say that there have been an increase interest by the scientific community over the years by the increase number of publications and a steady growth of new scientists on the area. In regard to the countries investing on the area, new players are coming forward, especially among the countries with high rate of neglected disease incidence, such as India. As for the network analysis we could see that there is a high collaboration due to its clustering coefficient, which is in accordance with the scientific communities. Within those authors we found some key players in terms of the number of publications and those players might be a point for a further study. This study however has not shown deeper studies over specific authors evolutions using network analysis or morphological evolution using a similar methods. Those studies are part of our current work and might be demonstrated on future analysis.
BIBLIOGRAPHY
[1] C. M. Morel, S. J. Serruya, G. O. Penna, e R. Guimarães, “Co-authorship Network Analysis: A Powerful Tool for Strategic Planning of Research, Development and Capacity Building Programs on Neglected Diseases”, PLoS Negl Trop Dis, vol. 3, no 8, p. e501, ago. 2009.
[2] A. G. Vasconcellos e C. M. Morel, “Enabling Policy Planning and Innovation Management through Patent Information and Co-Authorship Network Analyses: A Study of Tuberculosis in Brazil”, PLoS ONE, vol. 7, no 10, p. e45569, out. 2012.
[3] J. M. Ramos, G. Gonzalez-Alcaide, e M. Bolanos-Pizarro, “Bibliometric analysis of leishmaniasis research in Medline (1945-2010)”, Parasit. Vectors, vol. 6, p. 55, mar. 2013.
[4] G. González-Alcaide, J. Park, C. Huamaní, J. Gascón, e J. M. Ramos, “Scientific authorships and collaboration network analysis on Chagas disease: papers indexed in PubMed (1940-2009)”, Rev. Inst. Med. Trop. São Paulo, vol. 54, no 4, p. 219–228, ago. 2012.
[5] M. E. J. Newman, “Coauthorship networks and patterns of scientific collaboration”, Proc. Natl. Acad. Sci., vol. 101, no suppl_1, p. 5200– 5205, jan. 2004.
[6] World Health Organization e Global Malaria Programme, World malaria report 2012. Geneva: World Health Organization, 2012. [7] B. Gay e B. Dousset, “Cartographie de réseaux d’alliances et analyse
stratégique”, Ingénierie Systèmes Inf., vol. 11, no 2, p. 37–51, abr.
2006.
[8] W. D. Nooy, A. Mrvar, e V. Batagelj, Exploratory Social Network Analysis with Pajek, Expanded edition. Cambridge University Press, 2011.
[9] S. Wasserman e K. Faust, Social Network Analysis: Methods and Applications, 1o ed. Cambridge University Press, 1994.
[10] M. Newman, Networks: An Introduction, 1o ed. Oxford University
Press, USA, 2010.
[11] B. Gay e B. Dousset, “Innovation and network structural dynamics: Study of the alliance network of a major sector of the biotechnology industry”, Res. Policy, vol. 34, no 10, p. 1457–1475, 2005.
[12] B. Gay, “Firm dynamic governance of global innovation by means of flexible networks of connections”, J. Innov. Econ., vol. 2, no 2, p. 63,
2008.
[13] World Health Organization (WHO) Consultative Expert Working Group on Research and Development. 2012. “Defining Disease Types I, II and III”.
http://www.who.int/phi/3-background_cewg_agenda_item5_disease_types_final.pdf Figure 6 – Author relationship network