VOLUME 1
REPORT 2018
PENSION ADEQUACY
CURRENT AND FUTURE INCOME
ADEQUACY IN OLD AGE IN THE EU
European Commission
Directorate-General for Employment, Social Affairs and Inclusion
Social Protection Committee
The 2018 Pension Adequacy Report: current and
future income adequacy in old age in the EU
Volume I
Joint Report prepared by the Social Protection Committee (SPC)
and the European Commission (DG EMPL)
3
Acknowledgements
The 2018 Pension Adequacy Report (PAR) has been prepared by the Directorate General for Employment, Social Affairs and Inclusion of the European Commission (Unit C2 ‘Modernisation of social protection systems’, headed by Radek Malý (until 31 December 2016) and Ana Carla Pereira), in collaboration with the Social Protection Committee (SPC, chaired by Ulrika Hall) and its Working Group on Ageing Issues (SPC WG-AGE, chaired by Andraž Rangus) and the Indicators Sub-group (chaired by Rudi Van Dam, with Volker Schmitt chairing the discussions on the PAR). The report, consisting of two volumes (main report and country profiles), was adopted by the SPC on 25 April 2018.
The Secretariat of the SPC WG-AGE was coordinated by Audronė Balkytė-De Smedt.
The report was drafted by the EMPL C2 Pension team: Fritz von Nordheim Nielsen (Deputy Head of Unit, until 30 September 2017), Valdis Zagorskis (team leader), Ettore Marchetti and Audronė Balkytė-De Smedt.
The drafting of Volume I has integrated important contributions from the ESPN network1
(Slavina Spasova and colleagues), OECD, the SAAGE network2 and SHARE3.
The report used the underlying assumptions for the 2018 Ageing Report of the European Commission (Directorate-General for Economic and Financial Affairs) and the Economic
Policy Committee4. Other data used in the report were provided by Eurostat, the Member
States, OECD, SHARE and the ESPN.
1
ESPN – the European Social Policy Network, http://ec.europa.eu/social/main.jsp?catId=1135&langId=en 2
SAAGE – Scientific Analysis and Advice on Gender Equality in the EU (contracted by the European Commission’s Directorate-General for Justice and Consumers).
3
SHARE – The Survey of Health, Ageing and Retirement in Europe, http://www.share-project.org/ 4
https://ec.europa.eu/info/publications/economy-finance/2018-ageing-report-underlying-assumptions-and-projection-methodologies_en
4
Members of the Working Group on Ageing Issues of the Social Protection
Committee (SPC WG-AGE)
Chair / Slovenia Mr Andraž RANGUS Institute for Macroeconomic Analysis and Development
Back-up to the Chair / Spain
Mr Aurelio FERNÁNDEZ LÓPEZ
* * *
Ministry of Employment and Social Security
Belgium Mr Dirk MOENS Federal Public Service Social Security
Mr Michel ENGLERT Federal Planning Bureau Mr Gijsbrecht DEKKERS
Bulgaria Ms Gergana PEEVA National Social Security Institute Mr Mihail ILIEV Ministry of Labour and Social Policy
Czech Republic Ms Zdeňka HLÁSENSKÁ Ministry of Labour and Social Affairs Mr Jan ŠKORPÍK
Denmark Ms Charlotte Hvid OLAVSGAARD Danish Agency for Labour Market and Recruitment
Mr Vigithan SIVARAJAH
Germany Mr Volker SCHMITT Federal Ministry of Labour and Social Affairs Mr Francois PEGLOW
Estonia Mr Lauri LEPPIK Estonian Institute for Population Studies Mr Tõnu LILLELAID
Ireland Mr Darragh DOHERTY Department of Employment Affairs Social Protection
Ms Margaret MULHALL
Greece Ms Aspasia STRANTZALOU Ministry of Labour, Social Security and Social Solidarity
Spain Mr Aurelio FERNÁNDEZ LÓPEZ Ministry of Employment and Social Security Mr Antonio BLÁZQUEZ MURILLO
France Ms Maria RHOMARI Ministry of Solidarities and Health Ms Carine FERRETTI
Croatia Ms Sandra FRANKIĆ Ministry of Labour and Pension System Mr Alen BUČIĆ Croatian Institute for Pension Insurance
Italy Mr Edmondo SALINARO Italian National Institute of Social Security Ms Antonella DELLE MONACHE Ministry of Labour and Social Policies
Cyprus Ms Maria CHRYSOSTOMOU Ministry of Labour, Welfare and Social Insurance
Mrs Andri PAVLOU
Latvia Ms Daina FROMHOLDE Ministry of Welfare
5
Lithuania Ms Vidija PAŠTUKIENĖ Ministry of Social Security and Labour Ms Inga BUŠKUTĖ
Luxembourg Mr Gerard JOHANNS General Inspectorate of Social Security (IGSS) Mr Kevin EVERARD
Hungary Ms Erika Ildikó LUKÁCS Ministry of Human Capacities Mr Ádám RÉZMOVITS Hungarian State Treasury
Malta Mr Edward BUTTIGIEG Ministry of Finance
Mr Melchior VELLA Ministry of Finance
Netherlands Mr Lennart JANSSENS Ministry of Social Affairs and Employment
Austria Mr Michael TOPF Federal Ministry of Labour Social Affairs and Consumer Protection
Ms Irene FIEDLER
Poland Mr Krzysztof SZYMAŃSKI Ministry of Family, Labour and Social Policy Mr Dominik KOMOREK
Mr Ryszard MIKONOWICZ
Portugal Ms Rute GUERRA Ministry of Labour, Solidarity and Social Security
Ms Rita FIGUEIRAS
Romania Ms Mihaela KANOVITS Ministry of Labour, Family and Social Protection
Ms Olivia RUSU
Slovenia Mr Andraž RANGUS Institute for Macroeconomic Analysis and Development
Mr Davor DOMINKUŠ Ministry of Labour, Family, Social Affairs and Equal Opportunities
Slovakia Mr Marek PLAVČAN Ministry of Labour, Social Affairs and Family Mr Miroslav DANČEK
Mr Slavomír ĎURIŠKA
Finland Ms Susanna GRIMM-VIKMAN Ministry of Social Affairs and Health Ms Marjukka HIETANIEMI Finnish Centre for Pensions
Sweden Ms Elisa BARONI Ministry of Health and Social Affairs Mr Kristian ÖRNELIUS
Mr Kristoffer LUNDBERG
6
Contributors in DG EMPL Unit C2 ‘Modernisation of social protection
systems’
Ms Ana Carla PEREIRA, Head of Unit
Mr Fritz VON NORDHEIM NIELSEN, Deputy Head of Unit (until 30 September 2017) Mr Valdis ZAGORSKIS, Pension Team Leader
Ms Audronė BALKYTĖ-DE SMEDT, Secretary to the SPC WG-AGE Mr Ettore MARCHETTI, Policy Officer
7
FOREWORD
For the third time already, the European Commission and the Social Protection Committee have joined efforts to produce the Pension Adequacy Report. This report, published every three years, provides an unparalleled overview of Member States' pension policies focusing on the adequacy of old-age incomes today and in the decades to come. It poses the key questions about how pension systems serve our citizens, namely: How well protected are older Europeans against poverty today? What levels of protection will future pensioners enjoy? How does the income of men and women change when they retire? And how to strike a balance between working life and retirement years, as life expectancy continues improving? Besides the regular analysis of old-age incomes and pension policies, each edition of the Pension Adequacy Report brings new issues into focus, reflecting the dynamic EU social agenda and the profound transformations taking place in European societies and the world of work. The 2018 report highlights areas that are key to attaining the principles of the European Pillar of Social Rights. It reflects on the gender differences in old-age poverty and pension entitlements that, despite incremental improvements, remain staggeringly large. For the first time, the report explores in detail the opportunities for people in different types of employment and self-employment to acquire adequate pension rights. The report equally dwells on how supplementary savings, in particular occupational pensions, contribute to old-age incomes in different Member States.
As the 2018 Pension Adequacy Report observes, pension adequacy concerns are again high on the agenda in a number of Member States, as they strive to maintain adequate pension incomes in ageing societies. We hope that the findings of this report will prove a valuable source of reference for the policy debates at national and EU level.
Marianne THYSSEN Ulrika HALL
Commissioner for Employment, Chair, Social Protection Committee
8
TABLE OF CONTENTS
FOREWORD ... 7
KEY CONCLUSIONS OF THE PENSION ADEQUACY REPORT ... 15
1. INTRODUCTION ... 21
1.1. Purpose, scope and content ... 21
1.2. Types of pensions covered ... 21
1.3. The three aspects of pension adequacy considered in the report ... 22
1.4. Further aspects of the multi-dimensional approach ... 24
1.5. Groups meriting particular attention ... 25
1.6. Looking to the future ... 25
2. CURRENT LIVING STANDARDS OF OLDER PEOPLE ... 27
2.1. Poverty risks and severe material deprivation among older Europeans ... 27
2.1.1. Downward poverty and social exclusion trends ... 27
2.1.2. Old-age income poverty varies by a factor of eight across Member States ... 31
2.1.3. Old-age poverty and social exclusion decreasing in most but not all Member States ... 32
2.1.4. Women are at higher risk of poverty or social exclusion ... 32
2.1.5. Depth of income poverty indicates that inequality is at play ... 33
2.2. Relative incomes and inequality among older people ... 34
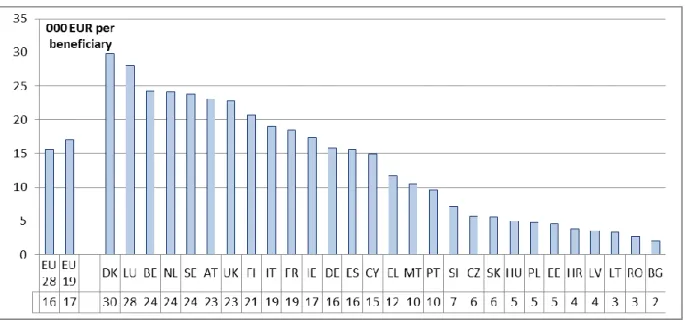
2.2.1. Pension expenditure is very diverse, even accounting for age and GDP ... 34
2.2.2. Older people’s incomes are 7 percent lower than those of people aged below 65 ... 36
2.2.3. Older people have more equal incomes than people aged below 65 ... 37
2.2.4. Is income poverty best reduced by raising total income level or reducing inequality? ... 38
2.3. Wider elements in the living standards of older people ... 41
2.3.1. Many elderly people live in their own homes ... 41
2.3.2. Some older people face housing cost overburden and overcrowding ... 42
2.3.3. Can older people’s wealth supplement pension income? ... 43
2.3.4. Health care is generally affordable, but not for everyone ... 45
2.3.5. Long-term care provision can have a large impact, which varies widely among countries... 46
3. THE ROLE OF PENSION SYSTEMS IN SECURING ADEQUATE LIVING STANDARDS IN OLD AGE ... 47
3.1. Pensions as income replacement ... 47
3.1.1. Aggregate income replacement by pension systems ... 47
3.1.2. An individual’s income replacement after a specific career ... 48
3.2. Redistributive elements of public pension schemes ... 51
9
3.2.2. Standard-career pensions are less unequal than work income ... 53
3.2.3. Minimum income provisions for older people ... 55
3.2.4. Policies favouring public pension scheme income redistribution ... 60
3.3. Retirement conditions for the self-employed and for people in non-standard employment ... 61
3.3.1. Non-standard workers ... 62
3.3.2. The self-employed ... 63
3.3.3. Impact on old-age income adequacy ... 66
3.4. Gender differences and pension entitlements ... 68
3.4.1. Women have lower pensions than men ... 69
3.4.2. Access of men and women to pensions ... 71
3.4.3. Drivers of gender differences in pension entitlements ... 73
3.4.4. Policies in reducing gender gaps in pensions ... 78
3.5. The role of supplementary pensions ... 79
3.5.1. The coverage of supplementary pensions across the EU ... 79
3.5.2. Occupational pensions ... 80
3.5.3. Personal pensions ... 83
3.5.4. Payment duration ... 84
3.6. Income from work up to and after the pensionable age ... 84
3.6.1. Developments in older people’s employment ... 85
3.6.2. Trends in late-career employment ... 85
3.6.3. Drivers behind the increased employment rates ... 91
3.6.4. Unemployment and disability limiting increases in older people’s employment ... 95
3.6.5. Combining pension with work ... 97
4. PENSION REFORMS AND THEIR LIKELY IMPACTS ... 99
4.1. Recent pension reforms: an overview ... 99
4.1.1. Refocusing the pension duration: continuation of previous reform patterns ... 101
4.1.2. Bringing adequacy back in: rebalancing pension duration with poverty reduction and income maintenance... 103
4.2. Impact of recent pension reforms on present and future adequacy ... 107
5. ADEQUATE PENSIONS IN A LONG-TERM PERSPECTIVE ... 111
5.1. Long-term adequacy prospects and challenges ... 111
5.1.1. Prospective theoretical replacement rates ... 111
5.1.2. Assessing the severity of adequacy risks ... 121
5.1.3. The challenge of rising pensionable ages... 126
5.2. Mitigating the risk of future inadequacy ... 134
5.2.1. Ensuring adequate coverage and access to pensions for all ... 135
5.2.2. Expansion of complementary retirement savings ... 137
5.2.3. Identifying ways of raising effective retirement ages ... 140
ANNEXES ... 144
10
1. General specifications of the calculations ... 144
2. Specifications of the base case ... 146
3. Specifications of variant cases ... 148
4. Data and assumptions ... 151
ANNEX 1.bis List of pension schemes used for the theoretical replacement rates ... 154
ANNEX 2. List of definition and abbreviations ... 166
ANNEX 3. View of the European Social Partners and the AGE Platform Europe, a member of the Social Platform ... 171
BusinessEurope ... 171
European Association of Craft, Small and Medium-Sized Enterprises (UEAPME) ... 174
European Trade Union Confederation (ETUC) ... 177
AGE Platform Europe ... 180
11 List of Figures
Figure 1: The triangle of pension adequacy ... 22
Figure 2: At-risk-of-poverty or social exclusion (AROPE) rate by age group and sex in the EU, 2008-2016 ... 27
Figure 3: Population aged 65 and above by household type, EU-28, 2016, millions ... 27
Figure 4: Proportion of gross income in ‘single-person aged 65+’ households, EU-28, 2015, % ... 28
Figure 5: Proportion of gross income in households consisting of a couple, with at least one member aged 65+, EU-28, 2015, % ... 28
Figure 6: At-risk-of-poverty (AROP) rate by household type, 2016, % ... 29
Figure 7: At-risk-of-poverty (AROP) and severe material deprivation (SMD) rates by age group in the EU, 2008-2016, % ... 29
Figure 8: At risk of poverty and severe material deprivation in old age (65+), 2016, % ... 30
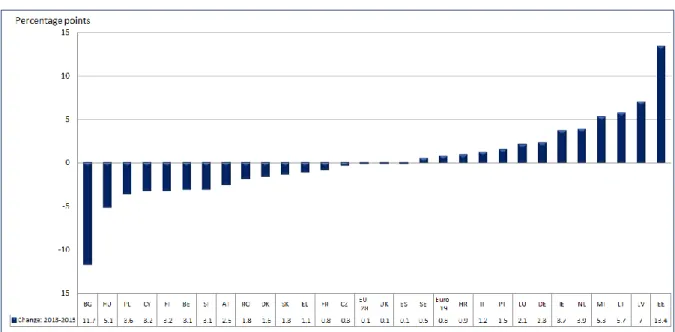
Figure 9: Changes in the AROPE rate, people aged 65 and over, 2013-2016, p.p. ... 31
Figure 10: The AROPE rate of older people (65+), by gender, 2016, % ... 31
Figure 11: The relative median at-risk-of-poverty gap for older people (65+), 2013-2016 ... 33
Figure 12: Pension expenditure per beneficiary for old-age and survivor’s pensions, in ’000 EUR, 2015 ... 34
Figure 13: Pension expenditure per person aged 65+ as a share of per-capita GDP, 2015 ... 34
Figure 14: Relative median income ratio of older people, by gender, 2016 ... 35
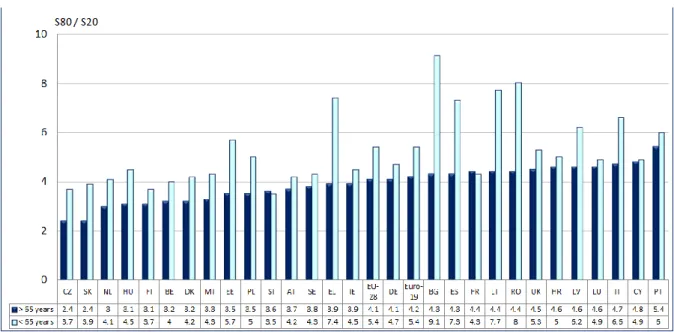
Figure 15: Inequality of income distribution – Income quintile ratio (S80/S20), by age group, 2016 ... 36
Figure 16: Income inequality – changes in the S80/S20 for the population 65+, 2013-2016 ... 37
Figure 17: Simulation: old-age at-risk-of-poverty rates under same equivalised relative median income, 2016, % ... 38
Figure 18: Simulation: old-age AROP rates under same old-age income dispersion, 2016, % ... 39
Figure 19: Owners and tenants (among older households: either single, aged 65 and above, or a couple, at least one aged 65 and above), 2016, % ... 40
Figure 20: At-risk-of-poverty rate by home ownership, 2016, % ... 41
Figure 21: Share of housing cost in disposable household income among older households, 2016, % ... 41
Figure 22: Population aged 65 and above living in overcrowded households, 2016, % ... 42
Figure 23: Average net wealth, EU-19, 2016, by age, in ’000 EUR ... 42
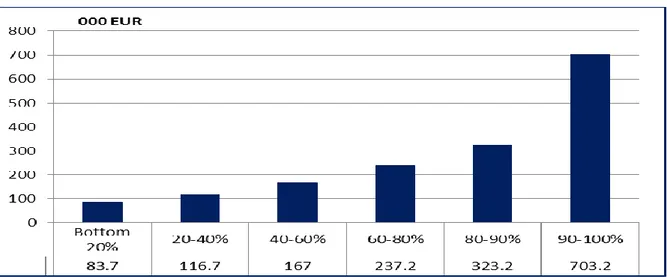
Figure 24: Average net wealth, EU-19, 2016, all ages, by income percentile, in ’000 EUR ... 43
Figure 25: Population aged 65 and above who self-reported unmet needs for medical examinations because they were too expensive, 2016, % ... 44
Figure 26: Public expenditure on long-term care, 2013, % of GDP ... 45
Figure 27: Aggregate replacement ratio by gender, 2016 ... 46
Figure 28: Aggregate replacement ratio, 2008-2016 ... 47
Figure 29: Net 2016 theoretical replacement rates, average earner, base case (40 years to SPA), p.p. difference between men and women (only where this is not zero) ... 49
Figure 30: Net 2016 theoretical replacement rate differences between the AWG case and the base case, p.p. .... 50
Figure 31: Comparison between family income from pensions and from other sources,* averages and standard errors, 2015, ... 51
Figure 32: Difference in net 2016 TRRs between different earning profiles, base case (40 years to SPA), p.p. .. 52
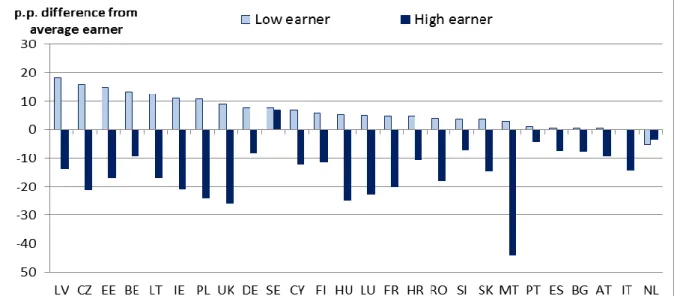
Figure 33: Difference in net and gross 2016 TRRs between low and high earners, base case (40 years to SPA), p.p. ... 53
Figure 34: Pension ratio between high and low earners, 2013-2015 ... 54
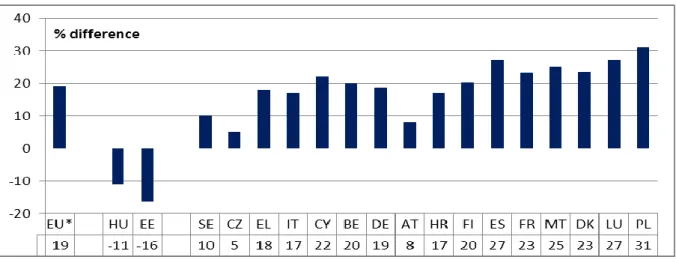
Figure 35: Relative difference in the median equivalised disposable income between retired employees and retired self-employed, 2017, % ... 66
Figure 36: At-risk-of-poverty rate by former work type, 2017, % ... 67
Figure 37: Gender gap in pensions, pensioners aged 65-79, 2009 and 2016, % ... 68
Figure 38: Gender gap in pensions, pensioners aged 65-79, 2009-2016, EU-28, % ... 69
Figure 39: Gender gap in mean pensions, persons aged 65+, total pension income, % ... 70
12
Figure 41: Gender pay gap, 2008-2015, % ... 73
Figure 42: Gender gap in duration of working life, 2016, years ... 74
Figure 43: Decomposition of the explained part of the gender gap in own-pension income, persons aged 65+, % ... 76
Figure 44: Coverage of retirees and working people (aged 50+) by occupational pensions, 2017, % ... 82
Figure 45: Average effective labour market exit age, EU-28 by gender, 1970-2016, years ... 84
Figure 46: Employment rate of people aged 55-64 in 2013 and 2016, % ... 85
Figure 47: Employment rate of older people (55-64 years), by gender, 2016, % ... 85
Figure 48: Employment rate of older people (65-74), 2016, % ... 86
Figure 49: Part-time employment rates by age group, gender and country, 2016, % ... 86
Figure 50: Duration of working life, 2016, years ... 87
Figure 51: Changes in duration of working life, 2013-2016, years ... 87
Figure 52: Average time before working, working time and retirement duration, 2017, years ... 88
Figure 53: Ratio between average retirement duration and working life, 2016, ratio ... 89
Figure 54: Employment rate increase among the 55-59 years old, 2011-2016, by driver, p.p. ... 90
Figure 55: Employment rates of 55-64-year-olds by education level and country in 2016, % ... 91
Figure 56: Workers aged 55-64 who underwent training, by country, 2005 and 2015, % ... 92
Figure 57: Employment rate by health status, people aged 50-64, 2015, % ... 93
Figure 58: 50-64-year-olds in self-reported bad health by education level, 2015, % ... 93
Figure 59: Share of 50-64-year-olds reporting bad health over time by gender and employment in 23 EU countries, % ... 94
Figure 60: Changes in 55-64-year-old employed, unemployed and inactive because of own illness or disability, 2006-2016, p.p. ... 94
Figure 61: Workers aged 55-69 who reported pressure/physical effort in their job, 2016, % ... 95
Figure 62: Net TRR, base case (40 years up to the SPA), men, average earner, p.p. change, 2016-2056 ... 111
Figure 63: Difference in gross and net TRR between low and high earners, base case (40 years up to the SPA), 2056, p.p... 112
Figure 64: Net TRR, AWG case, men, average earner, p.p. change, 2016-2056 ... 113
Figure 65: Net TRR, AWG case, differences between men and women, average earner, 2056, p.p. ... 114
Figure 66: Net TRR, differences between the cases retiring 2 years earlier, 2 years later, compared to the base case, average earner, men, 2056, p.p. ... 115
Figure 67: Net TRR, retirement at SPA, shorter (38 years) and longer (42 years) career, average earner, men, 2056, p.p. difference from base case ... 116
Figure 68: Net TRR, retirement at SPA, career starting at age 20, average earner, men, 2056, p.p. difference from base case ... 117
Figure 69: Net TRR, 20-year career, 2056, p.p. difference from base case ... 118
Figure 70: Net TRR difference from the base case, same total career duration but with breaks within the career, men/women, average earner, 2056, p.p. difference from base case ... 119
Figure 71: Net TRR, base-case man, 10 years after (2066), p.p. difference from base case ... 120
Figure 72: At-risk-of-poverty rate (net equivalent income) in Belgium ... 122
Figure 73: At-risk-of-poverty rate (net equivalent income) in Italy ... 122
Figure 74: At-risk-of-poverty rate (net equivalent income) in Sweden ... 122
Figure 75: Projected exit ages from the labour market, 2017 and 2056, years ... 127
Figure 76: Estimated change in exit age 2015-2035 due to rise in SPA/EPA and other already legislated pension parameter changes ... 129
Figure 77: Projected changes in gross theoretical replacement rates by type, 2016-2056, average earners, men, p.p. ... 137
Figure 78: Projected rates of tertiary education level among people aged 55-64, % ... 140
Figure 79: Projected employment rates on the basis of population projection by education level, ages 55-64, % ... 141
Figure 80: Projected incidences of low health rates (on the basis of population projection by education level in Figure 78), ages 50-64, % ... 142
13 List of Tables
Table 1: Countries by old-age income, relative median and standard error, 2016 (relative to EU as a whole) .... 37
Table 2: Net theoretical replacement rates, base case (40 years’ uninterrupted career ending with the standard pensionable age, men and women, 2016 ... 48
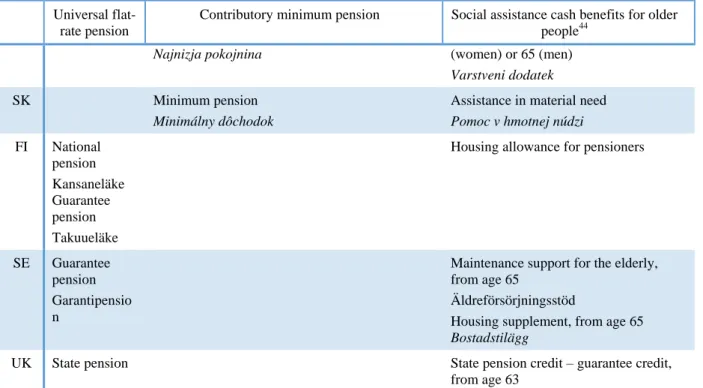
Table 3: Types of minimum income provision for older people, 2017 ... 54
Table 4: Share of recipients of minimum income benefits in the population aged 65 and over by benefit (2013 and latest available data) ... 57
Table 5: Coverage rate by gender and gender gap in coverage, by pension system, persons aged 65+, based on SHARE survey, p.p. ... 71
Table 6: Coverage of supplementary pensions by type, 2016, % of population aged 15-64 ... 78
Table 7: Combining work and pensions, 2017 ... 96
Table 8: Pension reforms adopted in Member States, 1 July 2014 to 1 July 2017 ... 99
Table 9: Gross public pension expenditure as a fraction of GDP ... 121
Table 10: Current developments in pensionable ages as effect of reforms (on 1 January of the reference year) 125 Table 11: Projected rise in SPA, exit ages and the gap between the two, base year 2016 ... 127
Table 12: Total estimated changes 2015-2035 in exit ages from pension parameter changes, rising educational attainment, ageing and (only last two columns) an extrapolated past time trend .. 132
List of Boxes Box 1: Focusing on people aged 65 and above ... 26
Box 2: Older people and their income sources ... 27
Box 3: The poverty simulation on income level and distribution ... 38
Box 4: Turning one’s house into a flow of cash ... 43
Box 5: Theoretical replacement rates ... 47
Box 6: Income equalisation vs redistribution ... 50
Box 7: Pension equality – an alternative view ... 54
Box 8: Income assessment bases and under-insurance ... 64
Box 9: Factors causing gender differences ... 76
Box 10: Occupational pension schemes in Denmark, the Netherlands and Sweden ... 80
Box 11: Reversing the rise of the pensionable age in Poland ... 108
Box 12: Projecting future labour market exit ages – calculation methods used in the Ageing Report and in the OECD modelling ... 131
15
KEY CONCLUSIONS OF THE PENSION ADEQUACY REPORT
Principle 15 of the European Pillar of Social Rights5 stresses the right of workers and the
self-employed to a pension commensurate with contributions and ensuring an adequate income, the right of women and men to equal opportunities to acquire pension rights, and the right to resources that ensure living in dignity. The EU supports Member States’ efforts to ensure a high level of social protection, including pension adequacy, through facilitating mutual learning and exchange of best practices. Sustaining adequate pensions in ageing societies is key to the economic coordination efforts and ensuring inclusive growth in the EU, as pensions are both the main source of income for older Europeans and an important component of public expenditure.
The 2018 Pension Adequacy Report prepared jointly by the Social Protection Committee and the European Commission analyses the adequacy of current and future pensions, that is: how they help maintain the income of men and women for the duration of their retirement and
prevent old-age poverty. It supports Member States in designing pension systems that are
adequate while remaining financially sustainable, being mutually complementary with the Ageing Report. The report highlights that:
- despite improvements, there is no room for complacency -
1. Some 17.3 million or 18.2 percent of older people (aged 65 and over) in the EU
remain at risk of poverty or social exclusion, even though they are 1.9 million fewer than in 2008. Old-age poverty and social exclusion have remained nearly
unchanged since 2013 in the EU on average, with improvement in 16 Member States and deterioration in 12. Women face a higher risk than men. At the EU level, older people are less often at risk of income poverty than people of working age, but significant country differences remain. In seven Member States, the older population faces higher income poverty risk than the rest of society. As the main source of
old-age income, pensions are key to preventing income poverty.
2. The average income of older people in the EU is 93 percent of the younger
population's income, with large differences by gender and among Member States. Pensions in the early years after retirement currently amount to more than half of late-career work income (58 percent in the EU). At national level, the ratio
ranges from above 80 percent to less than 40 percent, having increased in all but three Member States since 2008.
3. Although the duration of working life is increasing, the duration of retirement is
expected to grow even faster, as life expectancy continues to increase. On average
in the EU, the time spent in retirement is about half (51%) of that spent in employment. This ratio is projected to increase to 53 percent by 2060, posing the challenge of finding a new balance between working life and retirement and of sustaining adequate pensions.
5
16
- inequalities remain and some groups require specific policy attention -
4. Pensions, alongside taxation, help ensure that retirement income is distributed
more equally than income during working life. However, the depth of old-age income poverty indicates that inequality among older people persists. High
at-risk-of-poverty rates can be caused by low overall income, as well as inequality. In the EU as a whole, there was an increase in income inequality (up in 16 countries, down in 9) and in poverty depth (up in 19 countries) in old age between 2013 and 2016. Older people at risk of poverty are now poorer.
5. The risk of poverty or social exclusion in old age increases with age. More than half of all older people at risk of poverty or social exclusion in the EU are aged 75 or over (8.8 million in 2016), partly due to past labour market performance. While the
needs increase with age, the value of pensions is eroded during retirement.
Pension indexation and access to publicly provided or subsidised services can help support the quality of life throughout retirement.
6. More than 20 percent of older women (aged 65 and over) are at risk of poverty or
social exclusion in the EU, compared to 15 percent of older men. Older women are
more likely to live longer, live alone and have lower pensions. As a result, older women are exposed to a higher risk of poverty or social exclusion in all Member States. In some countries, more than 10 percent of older women cannot afford the necessary health care. As the EU population ages, the number and population share of older women (and, with them, single older women) will increase. Even though
identical careers for men and women would lead to similar pensions, the gender gap in pensions is 37.2 percent in the EU. Although lower for new retirees, the gap
has remained persistently high in many countries since 2009. Equal opportunities for women and men to acquire pension rights depend on labour market and pension policies that support equal careers and earnings.
7. People in non-standard or self-employment often face less favourable conditions
for accessing and accruing pension rights than those in open-ended, full-time job
contracts. For employees who were in non-standard employment, once retired these barriers can amplify the income gap with those who were in standard employment.
The self-employed are a highly diverse group and are more likely than employees to build their savings outside the pension system. The retired self-employed have on average lower pensions, higher assets and a higher risk of income poverty, and are more exposed to financial hardship. Member States are increasingly taking steps
to facilitate access to pension systems for people in different types of non-standard employment and self-employment.
8. Career breaks for social reasons, be they related to unemployment, childcare, care for dependent family members or own disability, result in slightly lower pensions. Pension credits are a key policy lever that limits the impact on pension adequacy of such career breaks, compared to career breaks without a social reason.
17
- pension systems and labour markets continue to evolve -
9. Measures to safeguard adequacy of pensions, in particular targeted at
low-income pensioners, are becoming more prominent in the EU. The pension reform
dynamic in Member States started to shift in 2014-2017, reflecting the sustainability gains achieved through earlier reforms and the recognition that these should be accompanied by measures to safeguard pension adequacy.
10. The recourse to minimum income provisions for older people has declined
slightly in the past 3 years, possibly thanks to better labour market outcomes. Their
role as an old-age safety net nonetheless remains vital, particularly for older women, who remain the main beneficiaries of minimum income schemes, even though they have become less dependent on them.
11. As people remain on the labour market for longer, the employment in the age
group 55–64 grew by 5.1 percentage points or 4.2 million workers (2.2 million women and 2 million men) in the years 2013-2016, following the trend of the past
10 years. Later retirement is the most important factor behind the growth in
employment; this is also an effect of pension reforms. The share of pensioners in
this age group strongly decreased, while the share of unemployed and those unable to work due to illness or disability increased slightly. Gains in older people’s labour
participation can also be attributed to new, better-educated age cohorts replacing previous ones. Depending on specific country situations, effective policies to boost
participation vary from investing in early education to improving access to lifelong learning, and from improving health conditions to promoting active ageing and age management in the workplace.
- adequacy of future pensions will require further improvements -
12. As life expectancy improves, longer working lives will be vital to enable men and
women to acquire adequate pensions. People retiring in 2056 will have lower pensions compared to their work income than a similar career would have earned them in 2016. Pension systems can promote longer working lives by adjusting
pensionable ages (e.g. by increasing the statutory retirement age to reflect life expectancy gains), pension benefits or career length requirements, rewarding later retirement and discouraging early exit. The strength of (dis-)incentives varies across countries. At the same time, flexible retirement options, including possibilities to combine pension with income from work, and tax incentives promoting later retirement are becoming increasingly widespread.
13. While gradually narrowing, the pension gap between women and men is likely to
persist. While the difference in career length is set to shrink, the cumulative effect of
the multiple career gaps affecting women (pay, career duration, childcare breaks, part-time work, care for dependent adults) is likely to have a continued impact on women’s pensions, only mildly compensated for by pension systems. Reducing the inequalities requires equal opportunity policies targeted at women and men of working age
18
(promoting the work-life balance and equal distribution of caring responsibilities, addressing labour market participation and career opportunities, work intensity and career breaks) and pension policies that adequately protect care-related breaks.
14. The ability of pension systems to cover different types of economic activity will
have a significant bearing on the future adequacy of old-age incomes. Extending
pension coverage to more people in non-standard or self-employment and adapting accrual conditions to diverse work patterns can help more people build up adequate pension rights.
15. Complementing statutory pensions with broad and well-designed supplementary schemes can help support adequate pension outcomes. While in some Member States
maturing occupational pensions are expected to contribute more to old-age incomes, in many others, including those facing some of the biggest pension adequacy
challenges, the coverage of any type of supplementary pensions remains very low. Depending on the national context, mandating, auto-enrolment, collective bargaining and tax and financial incentives, including cost-effective access for different income groups, are all avenues to develop supplementary pensions and boost their coverage, as is promoting awareness of different saving options. The potential contribution of supplementary schemes to adequacy within the different national pension systems calls for further in-depth consideration.
16. The living standards of older men and women are influenced by wealth and
access to services, in particular health and long-term care. The wealth of older
people tends to be substantially higher than that of the working-age population, though it is unevenly distributed. Some individuals at risk of poverty may have an opportunity to make up for it by using their assets. A large proportion of older people own the house where they live, while in some countries many older people are overburdened with housing costs. Quality and affordable public or subsidised services are important for the living standards of older people. These services are generally accessible in most Member States, although in some countries worryingly high proportions of older people do not have sufficient access to health care.
- joint efforts at the EU level need to be pursued –
17. Policy measures at the EU level support Member States in implementing the
principles proclaimed in the European Pillar of Social Rights, including on gender equality, social protection, pensions and old-age income. The proposed
Directive on work-life balance for parents and carers6 aims to promote equal sharing
of caring responsibilities between women and men that is crucial for equal opportunities to acquire pension rights. The proposed Recommendation on access to
social protection for workers and the self-employed7 aims to improve the social
6
Proposal for a Directive of the European Parliament and of the Council on work-life balance for parents and carers and repealing Council Directive 2010/18/EU, COM(2017) 253 final
7 Proposal for a Council Recommendation on access to social protection for workers and the self-employed, COM(2018) 132 final
19
protection of people with different economic statuses, including their right to an adequate pension. To explore the potential contribution of supplementary pensions to adequate old-age incomes, the Commission has set up a High-level group of experts
on pensions8.
18. The Social Protection Committee (SPC) stresses the need for a holistic reflection
on the adequacy of old-age incomes and the financial sustainability of pension systems. In this context, the SPC invites the Economic Policy Committee to jointly
promote the findings of the 2018 Pension Adequacy Report and the 2018 Ageing Report.
19. In view of the constantly evolving pension policies, demographic situation and labour markets as well as the diversity of policy issues that merit reflection, pension
adequacy requires continuous monitoring and analysis. In this context, the SPC intends to prepare the fourth Pension Adequacy Report for adoption in 2021 and
calls on the Commission to work together in the preparation of the report.
8
21
1. INTRODUCTION
1.1. Purpose, scope and contentThe European Pillar of Social Rights stresses the right of workers and the self-employed to a pension that ensures an adequate income, the right of women and men to equal opportunities to acquire pension rights, and the right to resources that enable to live in dignity (European Commission, 2017a).
The purpose of the 2018 Pension Adequacy Report (PAR) is to present a comparative analysis of the degree to which national pension systems in the EU enable older people to retire with an adequate income. A key aim is to illustrate how previous and recent pension reforms impact on pension adequacy for people retiring today – and also in the future, when people who are presently just entering the labour market will retire after having completed their careers.
The Pension Adequacy Report is produced every 3 years by the Social Protection Committee (SPC) and the European Commission; this report and the 2018 Ageing Report (to be published in May 2018 by the Economic Policy Committee (EPC) and the Commission) will complement one another. The complete report consists of two volumes. Volume I is devoted to a comparative analysis of pension adequacy in the EU-28, whereas Volume II (country profiles) provides a detailed discussion of developments in each of the 28 Member States. The present document, Volume I, examines the current living standards of older Europeans (Chapter 2) and the role of pension systems in securing them (Chapter 3), by analysing the consequences of recent and ongoing pension reforms (Chapter 4), by identifying risks to future pension adequacy, and by outlining what can be done to address such risks, so that adequate old-age incomes for the young people starting out in some form of employment today can be secured by the time they reach retirement, four to five decades from now (Chapter 5).
1.2. Types of pensions covered
The report focuses on the adequacy of pensions. An old-age pension is a type of benefit for which entitlement is primarily based on some form of prior record of ‘performance’ establishing the right to claim. Pension entitlement can be based on years of contributions paid or credited, or in some cases on years of residency. Some elements of minimum pension benefits may also depend on current need and be income or means tested. But an orientation towards current need is primarily a characteristic of the forms of minimum income provision that replace or complement a pension for older people with no or insufficient entitlements of their own. Entitlement can also be based on derived rights, as in the case of a pension allowance for a spouse and a survivor’s pension.
The report does not deal with disability pensions as such, and only touches on withdrawal from the labour market due to disability insofar as it affects old-age pensions.
In the report, all forms of old-age pensions will be examined and discussed for their contribution to the adequacy of pensions as an element in overall access to resources in retirement and old age. The report seeks to cover the entire national packages of income from
22
pension schemes, whether statutory9 or supplementary,10 pay-as-you-go or pre-funded.11 The
report will also briefly discuss minimum income benefits for older people, both within and outside the pension system.
Where statutory pension provision includes multiple schemes (e.g. a flat rate topped up by an earnings-related scheme, or a pay-as-you-go scheme accompanied by a statutory funded
scheme12), income from them all will be included in the analysis. The design of statutory
pension provision in the Member States will be described in more detail in Volume II; Volume I will only touch upon it in the context of reform trends or adequacy for specific groups.
The report will discuss the role that supplementary (i.e. occupational and personal) pensions play in old-age income provision. Occupational pensions are also included in the projections of theoretical replacement rates (TRRs) in those Member States where they are compulsory or have broad coverage.
The differences in pension outcomes depending on the duration of the working career/contributory record, income level and gender will be examined.
The current report does not examine the tax treatment of pensions, which has important implications for the adequacy and distribution of pension income. It is important to note that the net (i.e. after-tax) replacement rates presented in the report are affected by the taxation of salaries and pensions. Furthermore, the analysis presented in this report largely omits those parallel measures (such as housing benefits) directed at older people within the tax and benefit system that exist in some Member States and that influence the well-being of pensioners.
1.3. The three aspects of pension adequacy considered in the report
The 2015 edition of the Pension Adequacy Report13 aimed at a multi-dimensional approach to
the adequacy of pensions that will also be applied and expanded in this 2018 edition.
The current report considers three aspects of adequacy: (i) poverty protection, (ii) income maintenance, and (iii) pension duration (see Figure 1).
9
Statutory pension schemes are those, access to which is established by legislation. These may be universal for all citizens, mandatory for all employed people with a standard employment contract, limited to certain occupational groups (e.g. public-sector employees, farmers, workers in arduous or hazardous jobs, etc.). Most statutory schemes are mandatory for the population or group concerned, but some schemes may be voluntary.
10
That is, occupational and personal pensions. 11
These refer to funding. In pay-as-you-go arrangements, current workers’ contributions are used to pay for current pensions; in funded systems, contributions are set aside in a fund and used after the workers retire.
12
Statutory funded schemes are legislation-based schemes financed from a general contribution regime, but accumulated in individual, pre-funded accounts. These should be distinguished from supplementary pensions.
13
23 Figure 1: The triangle of pension adequacy
Source: European Commission. Note: "AROPE 65+": population aged 65 and over at risk of poverty or social exclusion.
This report focuses on pensions as the key form of post-retirement and old-age income for men and women. Current and future aspects of pension adequacy are primarily measured by the ability of pension income to protect pensioners – whatever their gender, income, career and forms of employment – against poverty, and to replace their former earnings to a reasonable degree.
First, the adequacy of pension income is measured by its ability to prevent and mitigate the risk of poverty (i.e. the risk and depth of income poverty and severe material deprivation)
among women and men aged 65 and over. It has to be noted that at-risk-of-poverty (AROP) is based on equivalised household disposable income, which also includes other social benefits, work and capital income, and is net of taxes. Since, by the time they reach the standard pensionable age, a number of people have failed either to qualify for a pension or to secure sufficient entitlements to live on, the report will also look at the adequacy of the Member
States’ schemes for minimum income provision for older people with insufficient resources.14
Secondly, adequacy is measured by its capacity to replace earned income before retirement. Using the TRR indicator methodology, the report assesses the adequacy of
current pensions for certain cases of career length and income, and compares the findings with similar scenarios four decades later. The calculation of theoretical replacement rates in 2056 provides a detailed estimate of the impact of current reforms on future pensions.
Thirdly, the report will also give attention to the length of retirement to which pensioners
are entitled by national pension arrangements. It also matters when and for how long pensions are made available to people. Pension duration not only has to be considered when assessing the sustainability of pension systems, but it also interacts with the income-replacement and poverty-prevention capacity of pension systems. It also represents one of the main challenges in relation to finding an adequate and sustainable balance between the duration of working life and the duration of retirement.
14
24
The standard pensionable age and life expectancy at that age differ between Member States and between the genders. The average length of retirement or pension duration may therefore vary considerably.
To allow for better comparison between Member States of how they balance these three dimensions of adequacy, the report looks to measurements of the average length of retirement and the aggregate value of benefits over the retirement period.
1.4. Further aspects of the multi-dimensional approach
The adequacy of current pensions needs to be contextualised by looking at their relative importance among other sources of old-age income, at their net value after taxes and their adequacy in view of the degree of access to free or subsidised public services that pensioners enjoy in the different Member States, and at elderly people’s needs.
Over their active years, many people manage to accumulate a certain measure of housing and financial wealth, which they can draw on in retirement. Owner-occupier dwellings are a very widespread form of housing wealth, which allows pensioners to have lower housing costs, since typically the mortgage will have been paid off or the outstanding part will be rather low. By their retirement, many people have some savings that they can draw on as financial wealth. The report examines the prevalence and distribution of both forms of wealth and discusses the relative importance of these income sources in assessing the adequacy of pensions.
As supplements to pensions, most Member States also offer a variety of allowances, services or reimbursements to help cover the cost of such needs as housing, heating, pharmaceuticals, transport, etc.; these are typically awarded on a need/resource-tested basis. Such social protection benefits are particularly important for low-income pensioners, but they may also function as a pension supplement going to all pensioners. Discounts on publicly provided (or supported) amenities – such as water, transport, public service radio and TV and cultural institutions – are often available to people above the pensionable age. These help augment the relative buying power of the pension.
Access to free public services, or in-kind benefits – notably health care, social services and long-term care – also helps increase pension adequacy.
Furthermore, the report will focus particularly on the extent to which labour markets across the EU will be able to absorb the extra late-career labour supply resulting from the increase in pensionable age and the closing of early-exit routes brought about by pension reforms. Barriers to, and opportunities for, delivering on higher effective retirement ages will be analysed from the demand as well as the supply side, and will be used to set out the policies needed to underpin the rise in pensionable age envisaged in the pension reforms.
Another aspect of alignment with the opportunities in the labour market is whether pension take-up can be postponed if people work longer, and if postponement will be reasonably rewarded through pension increments. This is tested in a variant of the TRR cases. The analysis also includes the extent to which the lower pension that follows from early retirement and the ‘bonus’ for deferred retirement are well balanced, i.e. are proportional or actuarially
25
neutral. In addition, it is important to consider the conditions under which income from work can be combined with partial and full pension receipt.
1.5. Groups meriting particular attention
Women on average live longer than men and make up the majority of pensioners. At the same time, women still face many challenges during their working life – such as a disproportionate share of caring responsibilities – that undermine the equality of opportunity to build adequate pension rights proclaimed in the European Pillar of Social Rights. The report will explore gender differences in the risk of old-age poverty and social exclusion and in pension entitlements, the factors behind them and the potential policy solutions.
The fact that pension coverage and subsequent outcomes vary by form of employment also merits attention, as non-standard employment relationships and dependent self-employment are becoming more widespread on the labour markets. The European Pillar of Social Rights stipulates the right of workers and the self-employed to adequate social protection and, more specifically, to a pension that ensures an adequate income. The report will therefore also consider the pension coverage and accrual conditions of people in non-standard forms of employment and self-employment and, insofar as is possible, the pension adequacy risks.
The analysis presented in the report complements the initiatives on the work-life balance15
and on access to social protection16 that accompany the European Pillar of Social Rights.
1.6. Looking to the future
The impact of recent pension reforms will become fully apparent in the next few decades. This is due largely to the necessary transitional measures, but also to the fact that some aspects play out over time, such as ‘linking’ rules that adapt pensionable ages or benefit levels to life expectancy. Thus, assessing reforms requires making certain assumptions and looking at different scenarios. These need to cover employment, financial and economic long-term perspectives, as well as how today’s young workers will adapt to reformed pension systems. This report adopts a series of complementary approaches that, taken together, provide an assessment that is as complete as possible.
The first approach uses TRRs and delves into the intricacies of pension rules to assess how pensions will differ after different careers. TRRs indicate how the pension system responds to career choices and events, for instance, predicting if and how a period of unemployment will reduce pension benefits.
The second approach involves microsimulation. This is more comprehensive and allows an assessment of the overall impact on the older population in terms of employment, poverty, inequality and more. Most – possibly all – countries carry out some form of microsimulation on pensions; however, here a comparable approach is required, and unfortunately so far only a few countries have models that yield comparable results.
15
Communication from the Commission to the European Parliament, the Council, the European Economic and Social Committee and the Committee of the Regions, An Initiative to Support Work-Life Balance for Working Parents and Carers, COM/2017/0252 final.
16
26
The third and last approach involves modelling. This report shows the results from the labour market model used in the Ageing Report and a model by the Organisation for Economic Co-operation and Development (OECD). Both models cover each country in the EU. However, to keep complexity within manageable bounds, modelling focuses on specific aspects of pension adequacy and assumes other economic variables.
Chapter 5 attempts to bring the results of these approaches together into a future adequacy assessment and, also building on an observation of policies and practices in Member States, seeks to identify the most promising policy tools to tackle the challenges ahead.
27
2. CURRENT LIVING STANDARDS OF OLDER PEOPLE
This chapter examines the current material situation of older people aged 65 or over (see Box 1) relative to the rest of the population, with a focus on relative incomes, poverty risks and severe material deprivation. The analysis of income poverty trends (i.e. the EU ‘at-risk-of-poverty’ indicator) across age groups, between men and women and over time helps to identify the inequalities and main characteristics of people most at risk of poverty or social exclusion. This investigation is further elaborated by looking at wider elements in the living standards of older people, such as housing and financial wealth, and the extent to which this wealth can be used to sustain living standards in old age.
Box 1: Focusing on people aged 65 and above
This chapter (and much of this publication) focuses on people aged 65 and above. This group does not cover all pensioners; currently in the EU many people younger than 65 receive pensions, and a 2012 survey revealed that at that time people started receiving a pension at the age of 59 on average.17 However, by the age of 65 a very large majority of Europeans cease to rely on work income, and pensions become the essential source of sustenance. In addition, as this publication has a 2016-2056 outlook, and since people are working for longer and longer, the group aged 65 and above allows better comparison grounds for assessing how pension systems can continue to provide adequate old-age incomes.
In addition, only people living in households are covered in this chapter; older people living in institutions are not covered by the surveys used here.
2.1. Poverty risks and severe material deprivation among older Europeans
Pension systems help provide adequate incomes for older people and are key to achieving the Europe 2020 target of lifting at least 20 million Europeans out of poverty and social exclusion between 2010 and 2020.
2.1.1. Downward poverty and social exclusion trends
About 18.2 percent (17.3 million) of those aged 65 and over were at risk of poverty or social exclusion (AROPE)18 in the EU-28 in 2016: 20.6 percent of women (11 million) and 15 percent of men (6.3 million). These rates have been steadily decreasing over several years (Figure 2).
The pension systems play an important role in redistributing income.19 From 2008 to 2016,
the number of people aged 65 and over at risk of poverty or social exclusion in the EU decreased by around 1.9 million – this is about 9.5 percent of the Europe 2020 target of reducing poverty and social exclusion by 20 million by 2020. For contextual illustration, Figure 2 also provides the AROPE rate for younger people during the same time period. It is important to note that the AROPE rates of older people and of working-age people are not directly comparable, as the latter rate includes a third component: joblessness.
17
Eurostat, Labour Force Survey 2012 ad-hoc module. 18
The old-age poverty and social exclusion indicator (AROPE) combines measures of at-risk-of-poverty and severe material deprivation.
19
Pensions are almost as redistributive as income taxes and are the most important of the social benefits in reducing income inequalities across all countries (Eurofound, 2017, p. 41).
28
Figure 2: At-risk-of-poverty or social exclusion (AROPE) rate by age group and sex in the EU, 2008-2016
Source: Eurostat. Notes: AROPE rates of older people and working-age people are not directly comparable, as the latter rate includes a third component: joblessness. Cut-off point: 60% of median equivalised income after social transfers. *2008-2009: EU-27; 2010-2016: EU-28.
While this report focuses on old-age pensions, the main source of income that older people rely on to support their living standards in old age, it is important to underline that other types of income can alleviate old-age income poverty (see Box 2).
Box 2: Older people and their income sources
Figure 3: Population aged 65 and above by household type, EU-28, 2016, millions
Source: Eurostat, LFS. Note: ‘living in a couple’ and ‘living alone’ exclude the presence of children; people living in institutions are not included.
The pie-chart in Figure 3 indicates that there are many more single older women than single older men. In the EU-28 as a whole, of the 53.6 million women aged 65 and above, 21.4 million live alone,20 as many as live in a couple (21.5 million); by contrast, of the 41.3 million older men, only 8.1 million live alone and 25.8 million live as part of a couple (there are other types of households, less frequent). A larger proportion of women than of men are old. Thus, many women are on survivor’s pensions, which are generally low. The factors behind such gender differences are the longer life expectancy of women (a difference of about 5 years) and the average age difference within couples, 2-3 years on average in the EU.
People aged 65 and above draw income from several sources, the main source being their pension. As incomes are generally shared within a household, a household’s composition determines the sources of
29
income. Figure 4 presents a distribution of household compositions. Chapter 3 presents a more detailed analysis of income sources.
Single people rely mainly on pensions. Some 40 percent of older people live alone. Public old-age pensions (including survivor’s pension) represent 85 percent of their income. In this group, single older women are heavily overrepresented, which explains the relatively large share of survivor’s pensions – 13.3 percent (Figure 4). The remainder of the income of older single people is dominated by income from
investment (rental and
dividends/interests/profits) and work (as employees or self-employed). Private pensions are a very low share of income; however, this may be increasing, as enrolment into private pensions has been rising.
Couples without children, including one member aged 65 or above, rely on more diverse income sources (Figure 5). While old-age benefits still represent over 70 percent of their income, survivor’s benefits are very low, whereas income from work is over 15 percent (this could also come from one of the couple who is under 65 years of age). Other social benefits (not shown) account for about 2 percent of income. About 60 percent of older people live in such households.
Households of older couples or single people that include children are fewer in number (less than 1%) and include a more substantial share of income from work.
Figure 4: Proportion of gross income in ‘single-person aged 65+’ households, EU-28, 2015, %
Source: Eurostat, EU-SILC (ad-hoc table), May 2017.
Figure 5: Proportion of gross income in households consisting of a couple, with at least one member aged 65+, EU-28, 2015, %
Source: Eurostat, EU-SILC (ad-hoc table), May 2017.
The at-risk-of-poverty rate is closely linked to the household type. Single older people have generally much higher poverty rates than older couples. Only in Spain and Malta is income poverty higher among couples, and it is about the same level in the Netherlands. The difference is particularly large in Estonia and Latvia, where the poverty risk rates for single
older people reach almost 80 percent. Figure 3 indicates that these single people are
predominantly women; in addition, they tend to be older. In summary, the taller, darker bars in Figure 6 are an underestimate of poverty risk rates among single older women.
30
Figure 6: At-risk-of-poverty (AROP) rate by household type, 2016, %
Source: Eurostat. Note: in ES and MT, single older people have lower poverty rates than couples.
The AROPE indicator for older people combines relative income poverty and severe material deprivation. Of these two components, income poverty (AROP) was higher for older
people than for the population aged 18-64 before the crisis, but now it is lower (Figure 7).
This is partially explained by the fact that the crisis reduced average household disposable real income levels, especially among the working-age population, across almost all European countries (Eurofound, 2017), while pensions remained more resilient to the impact of the crisis. However, severe material deprivation also decreased among older people (from 7.4% in 2008 to 5.8% in 2016), indicating that the decrease in poverty and social exclusion was not just a relative effect.
Figure 7: At-risk-of-poverty (AROP) and severe material deprivation (SMD) rates by age group in the EU, 2008-2016, %
Source: Eurostat. Notes: *2007-2009: EU-27; 2010-2016: EU-28. Label ‘Mat-Depr’ in figure refers to severe material deprivation.
In the post-crisis period, the incomes of those aged up to 64 have been increasing, causing the relative incomes of older people to decrease and their relative poverty (AROP) to stagnate – or even to increase slightly during 2013-2016. At the same time, severe material deprivation among older people has continued to fall, contributing to the further reduction in poverty and
31
social exclusion among older people in the EU. There was a slight upturn of both indicators among those aged 65 and above in 2017.
2.1.2. Old-age income poverty varies by a factor of eight across Member States
The risks of poverty and social exclusion among older people are very diverse across the Member States. In 2016, AROPE averaged 18.2 percent across the EU, but ranged from
around 9 percent in Luxembourg and Denmark to almost 46 percent in Bulgaria. Almost every second older person in Bulgaria, and more than 30 percent in Latvia, Estonia, Lithuania, Romania and Croatia, is affected by poverty or social exclusion in old age (Figure 8).
Figure 8: At risk of poverty and severe material deprivation in old age (65+), 2016, %
Source: Eurostat. Notes: cut-off point: 60% of median equivalised income after social transfers. Sorted by the AROPE rate. AROP refers to the income year 2015; severe material deprivation refers to the survey year 2016.
In 2016, the at-risk-of-poverty rate of older people (aged 65 or over) averaged 14.6 percent in the EU-28, which is more than 14 million people. However, in Estonia and Latvia, more than one person in three aged 65 or over was at risk of poverty, and in Croatia and Lithuania the figure was one person in four.
Around 5.8 percent of the population aged 65 and above was suffering from severe material deprivation in the EU-28 in 2016. Severe material deprivation among older people was below 1 percent in three Member States (Denmark, Luxembourg and Sweden), while in Bulgaria and Romania it was over 37 percent and 22 percent, respectively.
Figure 8 also lends insights into the interplay between at-risk-of-poverty (which is relative and depends much on the country’s overall median income) and material deprivation, which is an appraisal of the material living standards of older households. Generally, at-risk-of-poverty correlates with material deprivation: countries where income at-risk-of-poverty rates are lower tend to have lower material deprivation, too. In countries where the AROPE rate is low, such as Luxembourg on the left of the figure, rates are dominated by at-risk-of-poverty; very few old people lack essentials, but many (relatively speaking) have a low income relative to the national standard. In countries where AROPE is high (such as countries on the right of the figure), rates are dominated by severe material deprivation: the older individuals in AROPE