HAL Id: hal-00757773
https://hal.archives-ouvertes.fr/hal-00757773
Submitted on 28 Nov 2012
HAL is a multi-disciplinary open access
archive for the deposit and dissemination of sci-entific research documents, whether they are pub-lished or not. The documents may come from teaching and research institutions in France or abroad, or from public or private research centers.
L’archive ouverte pluridisciplinaire HAL, est destinée au dépôt et à la diffusion de documents scientifiques de niveau recherche, publiés ou non, émanant des établissements d’enseignement et de recherche français ou étrangers, des laboratoires publics ou privés.
Internalization pathways into cancer cells of
gadolinium-based radiosensitizing nanoparticles
Wael Rima, Lucie Sancey, Marie-Thérèse Aloy, Emma Armandy, B. Alcantara
Gustavo, Thierry Epicier, Annie Malchere, Lucile Joly-Pottuz, Pierre Mowat,
François Lux, et al.
To cite this version:
Wael Rima, Lucie Sancey, Marie-Thérèse Aloy, Emma Armandy, B. Alcantara Gustavo, et al.. Inter-nalization pathways into cancer cells of gadolinium-based radiosensitizing nanoparticles. Biomaterials, Elsevier, 2013, 34, pp.181-195. �10.1016/j.biomaterials.2012.09.029�. �hal-00757773�
1 2 3 4 5 6 7 8 9 10 11 12 13 14 15 16 17 18 19 20 21 22 23 24 25 26 27 28 29 30 31 32 33 34 35 36 37 38 39 40 41 42 43 44 45 46 47 48 49 50 51 52 53 54 55 56 57 58 59 60 61
Internalization pathways into cancer cells of gadolinium-based radiosensitizing nanoparticles Wael Rima a, Lucie Sancey b, Marie-Thérèse Aloy c, Emma Armandy c, Gustavo B. Alcantara a, Thierry Epicier a, Annie Malchère a, Lucile Joly-Pottuz a, Pierre Mowat b, François Lux b, Olivier Tillement b, Béatrice Burdin d, Annie Rivoire d, Christelle Boulé d, Isabelle Anselme-Bertrand e, Jérémie Pourchez f, Michèle Cottier g, Stéphane Roux h, Claire Rodriguez-Lafrasse c, Pascal Perriat a, *
a
INSA-Lyon, MATEIS CNRS UMR5510, 69621 Villeurbanne Cedex, France
b
Laboratoire de Physico-Chimie des Matériaux Luminescents, UMR 5620 CNRS, Université de Lyon 1, 69622 Villeurbanne, France
c
EMR 3738, Laboratoire de Radiobiologie Cellulaire et Moléculaire, Faculté de Médecine Lyon-Sud, Université de Lyon 1, 699921 Oullins Cedex, France
d
Centre Technologique des Microstructures (CTµ), Université de Lyon 1, 69622 Villeurbanne Cedex,France
e
CMES - Faculté de Médecine Saint Etienne, 42023 Saint-Étienne Cedex 2, France
f
Ecole Nationale Supérieure des Mines de Saint-Etienne, CIS-EMSE, LINA EA 4624, F-42023 Saint-Etienne, France
g
LINA, EA 4624, F-42023, Saint-Etienne, France
h
Institut UTINAM, UMR 6213 CNRS–UFC, Université de Franche-Comté, 25030 Besançon Cedex, France
*
Corresponding author. Tel.: +33 4 72438253 E-mail address: pascal.perriat@insa-lyon.fr
*Title Page
1 2 3 4 5 6 7 8 9 10 11 12 13 14 15 16 17 18 19 20 21 22 23 24 25 26 27 28 29 30 31 32 33 34 35 36 37 38 39 40 41 42 43 44 45 46 47 48 49 50 51 52 53 54 55 56 57 58 59 60 61 Abstract
Over the last few decades, nanoparticles have been studied in theranostic field with the objective of exhibiting a long circulation time through the body coupled to major accumulation in tumor tissues, rapid elimination, therapeutic potential and contrast properties. In this context, we developed sub-5 nm gadolinium-based nanoparticles that possess in vitro efficient radiosensitizing effects at moderate concentration when incubated with head and neck squamous cell carcinoma cells (SQ20B). Two main cellular internalization mechanisms were evidenced and quantified: passive diffusion and macropinocytosis. Whereas the amount of particles internalized by passive diffusion is not sufficient to induce in vitro a significant radiosensitizing effect, the cellular uptake by macropinocytosis leads to a successful radiotherapy in a limited range of particles incubation concentration. Macropinocytosis processes in two steps: formation of agglomerates at vicinity of the cell followed by their collect via the lamellipodia (i.e. the "arms") of the cell. The first step is strongly dependent on the physicochemical characteristics of the particles, especially their zeta potential that determines the size of the agglomerates and their distance from the cell. These results should permit to control the quantity of particles internalized in the cell cytoplasm, promising ambitious opportunities towards a particle-assisted radiotherapy using lower radiation doses.
Keywords: gadolinium; internalization; radiosensitizing nanoparticles; intracellular localization; radiotherapy, fluorescence correlation spectroscopy; electron microscopy; confocal microscopy
*Abstract
1 2 3 4 5 6 7 8 9 10 11 12 13 14 15 16 17 18 19 20 21 22 23 24 25 26 27 28 29 30 31 32 33 34 35 36 37 38 39 40 41 42 43 44 45 46 47 48 49 50 51 52 53 54 55 56 57 58 59 60 61 1. Introduction
Nanoparticles for diagnosis and therapy applications have been suggested over the past few decades because they can present the following advantages: (i) colloidal stability in the blood system to avoid macrophage uptake, (ii) multimodality (the possibility to gather in the same object different properties), and (iii) the capacity to be concentrated in tumors or diseased zones either by Enhanced Permeability and Retention (EPR) effect or by the use of targeting biomolecules [1-7]. The particles suitable for enhancing the radiotherapy should contain elements with high atomic number Z capable to intensify the production of secondary and Auger electrons or reactive oxygen species (ROS) [8]. Among them, two types of nanoconstructs are presently emerging. Besides gold-based particles that were first and widely studied in particular by Hainfeld et al. [9-11], gadolinium-based nanoparticles (GBNs) offer an innovative approach due to their high Z (Z = 64) and their capacity to act, in vivo and in
vitro, as powerful contrast agents in Magnetic Resonance Imaging (MRI) [12-16]. These multifunctional particles are composed of a gadolinium oxide core and a polysiloxane shell encapsulating fluorophores (Cy5.5) and are functionalized via negatively charged diethylenetriamine-pentaacetic acid (DTPA) [17,18]. Although photoelectric effect is maximal in the [50-100] keV range, these particles were demonstrated by means of 3-(4,5-dimethylthiazol-2-yl)-2,5-diphenyl tetrazolium bromide (MTT) assays to possess efficient in
vitro radiosensitizing properties regarding glioblastoma U87 cell line for energies comprised
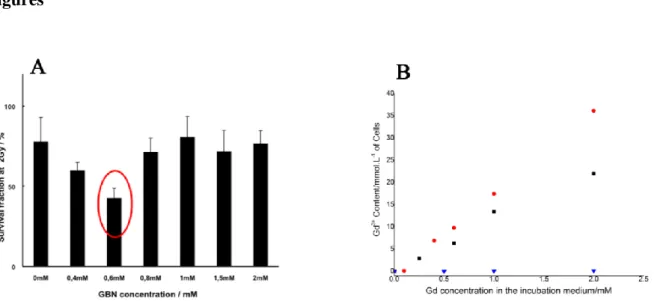
between 660 keV and 6 MeV (Suppl. Figure I in Supporting Information) [14]. Similarly, these nanoparticles also revealed exceptional radiosensitizing properties using clonogenic assays regarding radioresistant SQ20B human head and neck squamous cells carcinoma cell line (Fig. 1A). In both cases (U87 and SQ20B cells), the most efficient radiosensitizing content of GBNs was obtained in vitro for moderate incubation concentrations comprised between 0.4 and 0.7 mM in gadolinium (Gd) (i.e. 40 to 70 µM of nanoparticles). In a previous paper [14], we explained this fact by, beyond this threshold, the formation of agglomerates sufficiently large to absorb the killing species and impede them to attain DNA. Therefore, for a better comprehension of this concentration dependence, it is now essential to identify the uptake mechanism of particles into cancer cells with the aim to better control their cellular internalization, provide a feedback for their design and enhance their radiosensitizing effect. Because of their similar size, nanoparticles (NPs) uptake can follow the same endocytic routes than biological entities such as proteins, viruses or DNA. As a general rule, cellular transport of macromolecules undergoes endocytosis pathways that include phagocytosis, macropinocytosis, clathrin-dependent endocytosis, caveolin-dependent endocytosis and
*Manuscript
1 2 3 4 5 6 7 8 9 10 11 12 13 14 15 16 17 18 19 20 21 22 23 24 25 26 27 28 29 30 31 32 33 34 35 36 37 38 39 40 41 42 43 44 45 46 47 48 49 50 51 52 53 54 55 56 57 58 59 60 61
clathrin/caveolin-independent endocytosis [19,20].Besides these main pathways, isolated NPs can be internalized through the cell membrane by passive diffusion. This latter consists in a non-metabolic energy phenomenon, related to a chemical concentration gradient between intra and extracellular medium [21]. The different mechanisms of internalization differ regarding to the size of the endocytic vesicle, the nature of the entering species and eventual the need of specific receptors [22]. Numerous investigations have showed that slight modifications of physicochemical features have great consequences on the cellular entry and biological processes [23-26]. For example, mesoporous silica particles with a diameter of 110 nm were taken up, in presence of human cervical (HeLa) and lung epithelial (A549) cancer cells, via a macropinocytosis pathway, evidenced by the presence of membrane ruffling and large cytoplasmic vesicles (macropinosomes) [27]. For 60 nm biodegradable polymeric micelles, the entry pathway in liver hepatocellular (HepG2) cells occurs via an unspecified endocytic pathway and a small dose of passive diffusion [28].Concerning the particles with a size inferior to 30 nm, the uptake mechanisms varies even more with their size, morphology, electrical charge as well as the cell type investigated; in many cases, more than one mechanism can be observed (competitiveness of mechanisms). For instance, in the case of internalization of sub-20 nm titanium dioxide nanoparticles into prostate PC-3M cancer cells, no endocytic pathway was privileged so that particles were found to enter either by clathrin-mediated endocytosis, caveolin-clathrin-mediated endocytosis or macropinocytosis [25].
The objective of this paper is thus to understand why the maximum of the radiosensitizing efficiency of sub-5 nm GBNs is observed for different cell lines relies on an incubation concentration of about 0.6 mM Gd. This will be made by carefully studying the cellular uptake of particles in head and neck squamous cell carcinoma (SQ20B) cells via different techniques. SQ20B cell line was chosen for its radioresistance (Survival Fraction at 2 Gy = 0.72) and the high incidence of this tumor type [29,30]. In this study, the particles chosen correspond exactly to those used in our more recent works upon radiotherapy [14]. They possess a reduced thickness of polysiloxane shell to limit the presence of inactive matter for radio enhancement. In this paper, we will determine the main mechanisms responsible for the entry of non-targeting sub-5nm GBNs into SQ20B cells. We will also try to relate these entry mechanisms to the efficiency of particles as radiosensitizers.
1 2 3 4 5 6 7 8 9 10 11 12 13 14 15 16 17 18 19 20 21 22 23 24 25 26 27 28 29 30 31 32 33 34 35 36 37 38 39 40 41 42 43 44 45 46 47 48 49 50 51 52 53 54 55 56 57 58 59 60 61
2. Materials and Methods
2.1. Nanoparticles characterization
2.1.1. Size measurement and structural characterization
Direct measurement of the size distribution of the Nanoparticles was performed with the size analyzer NanoS PCS from Malvern Instruments. Measurements were directly taken on the colloid after surface modification of the nanoparticles. Confirmation of sizes was obtained from high-resolution transmission electron microscopy (HRTEM) performed at CLYM (Centre Lyonnais de Microscopie) with a JEOL 2010F microscope equipped with a Gatan Digi-PEELS energy filter in order to analyze the Si-L2,3 and Gd-N4,5 ionization edges with
electron energy-loss spectroscopy (EELS). Drops of colloidal solutions were deposited on dedicated TEM carbon grids and observed after natural drying.
2.1.2. Fluorescence correlation spectroscopy (FCS)
Fluorescence correlation spectroscopy and laser scanning microscopy (LSM) were carried out on a commercial system consisting of a LSM510 and a ConfoCor2 (Zeiss, Jena, Germany). The 633 nm line of a He-Ne laser was directed via a 633 dichroic mirror onto the back aperture of a Zeiss C-Apochromat 40×, N.A. = 1.2, water immersion objective. The measurements were carried out at room temperature in 8-well Lab-Tek I chambered cover glass (Nalge Nunc International, Illkirch, France). The 633 nm He-Ne laser beam was focused into 50 µL solutions at 150 µm over the cover glass.
The fluorescence emission was collected through a 90-µm pinhole. To remove any residual laser light, a 650 nm-long pass emission filter was employed. Photon counts were detected by an Avalanche PhotoDiode at 20 MHz for 30 seconds. For each sample, FCS measurements were repeated 10 times. The fluorescence signals were software-correlated and evaluated with the Zeiss FCS Fit software (Zeiss, Jena, Germany). Most of the intensity autocorrelation curves were fitted using a free diffusion model with two components: the NP coupled to the fluorochrome alone (mono-NP) and the fluorescent aggregates (the average of the aggregates). Structural parameter and triplet fraction were fixed. Moreover, a calibration step with 1-4 nmol/L (dye) made it possible to evaluate the size of the confocal volume (≈1 µm3
).
2.1.3. Zeta potential
Direct determination of the zeta potential of the nanoparticles was performed with the Zetasizer 3000HSa (laset He-Ne (633 nm)) from Malvern Instruments. Prior to the experiment,
1 2 3 4 5 6 7 8 9 10 11 12 13 14 15 16 17 18 19 20 21 22 23 24 25 26 27 28 29 30 31 32 33 34 35 36 37 38 39 40 41 42 43 44 45 46 47 48 49 50 51 52 53 54 55 56 57 58 59 60 61
the solution was diluted in an aqueous solution containing 0.01 M NaCl and adjusted to the desired pH.
2.1.4. Relaxivity
Relaxivities were determined with MQ60 NMR analyzer (Bruker Instruments, Marne la Vallée, France) at 60 MHz after heating 5 min at 37°C.
2.1.5. Absorbance
Absorbance was determined on 50 Scan UV-visible spectrophotometer (Varian, Toulouse, France).
2.2. Cell lines and culture conditions
The SQ20B cell line was established from a patient with recurrence of a squamous cell carcinoma of the larynx after radiation. The cells were grown in Dulbecco’s Modified Eagle Medium (DMEM) enriched with 4.5 g/L glucose and supplemented with 1% L-glutamine, 10% fetal bovine calf serum, 100 units/ml penicillin, 100 μg/ml streptomycin, 0.1% fungizone and 0.4mg/mL hydrocortisone. U87MG (Human radioresistant gliosarcoma) cells were grown in DMEM supplemented with 10 % fetal bovine serum. LTH (Jurkat, immortalized Human T lymphocytes) were grown in RPMI supplemented with 10% fetal bovine serum. All the cell lines were cultured at 37 °C in a humidified 95% air / 5% CO2 atmosphere.
2.3. Particles internalization in SQ20B cells
Exponentially growing cells (10 x 106 cells / sample) were incubated for 30 minutes, 1 hour and 2 hours in presence of particles (4Si-DTPA) at varying concentrations: 0.1 mM, 0.6 mM and 2 mM of Gd in HBSS medium. For the blocking internalization studies, the conditions are similar as those in the confocal microscopy section.
2.4. Determination of uptake by Inductively Coupled Plasma (ICP)
The gadolinium concentration of labeled cells was measured using Inductively Coupled Plasma Optical Emission Spectroscopy. For this, 1:200 µL of 65% (vol/vol) nitric acid was added during 2 hours to a known number of pelleted cells (comprised between 3 and 4.105). The solution obtained was diluted in 5 % (vol/vol) nitric acid to reach a gadolinium concentration in the measurable range [1-100 ppb]. The exact gadolinium concentration
1 2 3 4 5 6 7 8 9 10 11 12 13 14 15 16 17 18 19 20 21 22 23 24 25 26 27 28 29 30 31 32 33 34 35 36 37 38 39 40 41 42 43 44 45 46 47 48 49 50 51 52 53 54 55 56 57 58 59 60 61
(µg/mL) was then measured at 336.22 nm in a sample with a volume comprised between 3 and 4 mL using a Varian 710-ES ICP-OES apparatus (Varian, Les Ullis, France).
2.5. Clonogenic survival assay at 2 Gy
Cell survival assay was assessed by a standard colony formation assay with minor modifications [31]. One million of cells were incubated for 1 hour with GBNs at different concentrations (0.4 to 2mM) and after two washes with PBS, irradiated in fresh medium at 2Gy. Immediately after exposure, cells were trypsinized and re-seeded at different concentrations into 25 cm2 flasks to yield 10-120 colonies after six cellular divisions. Colonies containing more than 64 cells were scored and the percentage of surviving cells was calculated. The surviving fraction after each treatment was normalized to the surviving fraction for the corresponding control (plating efficiency). Mann-Whitney U test was used to assess the significant level between independent variables. The level of significance was set to p < 0.05.
2.6. Transmission electron microscopy
Samples of fresh cells were fixed for at least 1 hour at room temperature with 2% glutaraldehyde in 0.1 M sodium cacodylate buffer at a pH of 7.4. Samples were then rinsed three times of 10 minutes each in 0.1 M sodium cacodylate buffer and postfixed with 1% osmium tetroxide in 0.1 M sodium cacodylate buffer for 1 hour. After washing steps, the samples were dehydrated in a graded series of ethanol ending with propylene oxide. Samples were then embedded in EPON. About 70 nm thin sections were prepared with a Reichert Ultracut E ultramicrotome. The sections were observed using a Philips CM120 electron microscope operating at 120 kV. To map the distribution of gadolinium Nanoparticles in the sample, a LEO 912 microscope operating at 120 kV equipped with an omega filter was used. The images were acquired at the Gd - N45 ionization edge.
2.7. Scanning electron microscopy
Samples of fresh adherent cells were fixed for at least 1 hour at room temperature with 2% glutaraldehyde in 0.1 M sodium cacodylate buffer at a pH of 7.4. Samples were then rinsed three times of 10 minutes each in 0.1 M sodium cacodylate buffer and postfixed with 1% osmium tetroxide in 0.1 M sodium cacodylate buffer for 1 hour. After washing steps, the samples were dehydrated in a graded series of ethanol ending with HMDS and finally metalized with Au-Pa. Scanning Electron Microscopy (SEM) images of particles were
1 2 3 4 5 6 7 8 9 10 11 12 13 14 15 16 17 18 19 20 21 22 23 24 25 26 27 28 29 30 31 32 33 34 35 36 37 38 39 40 41 42 43 44 45 46 47 48 49 50 51 52 53 54 55 56 57 58 59 60 61
performed using the ESEM XL30-FEI microscope equipped with a thermal Field Emission Gun (FEG).
2.8. Confocal laser scanning microscopy
SQ20B cells were grown for 24 hours on 16-mm round cover glasses placed in the wells of a 24-well plate (seeding density of 50 000 cells per well). Immediately before running the experiment, cells were starved 1 hour and then incubated with Hank's buffered salt solution (HBSS) alone or containing macropinocytosis inhibitor amiloride at 3 mmol/L for another 1 hour at 37 °C, 5% CO2. Then, 0.6 mmol/L of GBN (4Si-DTPA coupled to Cy5.5, batch
74-4Si) were added to the culture medium for 1 hour. Cells were rinsed and fixed with PFA 4% for 10 minutes RT before incubating with Hoechst 5 µmol/L for 10 minutes. Cells were rinsed again and cover glasses were removed, mounted on slide with Fluoroprep. Confocal microscopy was performed on the Axiovert 200 LSM510 Meta microscope (Carl Zeiss, Jena, Germany) using a 40x oil immersion objective of 1.2 Numeric Aperture (N.A.). The 633 nm laser intensity was set up at 10 % of it maximum intensity and the emission was collected at 650-705 nm.
In a preliminary study, dextran (10 kDa, 0.5 mg/ml) compound specific of macropinocytosis was used to determine the inhibitors efficiency concentration. Dextran was labeled by Alexa-543 and excited at Alexa-543 nm and its fluorescence was collected at 560-615 nm (see suppl. Fig. 2).
1 2 3 4 5 6 7 8 9 10 11 12 13 14 15 16 17 18 19 20 21 22 23 24 25 26 27 28 29 30 31 32 33 34 35 36 37 38 39 40 41 42 43 44 45 46 47 48 49 50 51 52 53 54 55 56 57 58 59 60 61
3. Results and Discussion
3.1. Need of a microscopic study to understand the correlation between internalization and radiotherapy results
Extracellular and intracellular gadolinium contents in different cell lines (SQ20B, U87 and Human T Lymphocytes LTH) were first estimated using the macroscopic Inductively Coupled Plasma (ICP) technique. The quantities of gadolinium attached to the cell were shown to differ according to the cell line used. Gd content in U87 and SQ20B is found to increase almost linearly with nanoparticles concentration and is significantly higher than that measured in healthy T lymphocytes, which are able to internalize only a very weak amount of GBNs (Figure 1B). This indicates that, unlike the latter, SQ20B and U87 cells display a large permeability that favors internalization in large proportion and are then relevant cell lines models. Gd uptake is not expressed in pg/cell (the unit directly given by ICP measurements) but in mmol per liter of cells (mmol/L or mM), which is feasible knowing the size of the cell. It is then possible to use the same unit (mmol/L) for incubation medium (per volume of solution) and for cells (per volume of cell). Concerning SQ20B cells, Gd concentration is found 17 times greater in the cells than in the solution so that the almost linear law between the gadolinium content in the solution and in the cell is not affected by the change in cells viability that occurs for concentrations higher than 1mM (Supporting Information). Thus, this accumulation of Gd particles reveals that the cells, more efficiently than for fibroblast cells, SQ20B cells should act as gadolinium pumps from the incubation medium towards the cell. This is beneficial for further association with radiotherapy since it implies that a significant amount of radiosensitizers can accumulate in tumor cells. In particular, particles appear as better candidates than molecules for clinical applications since, in comparable conditions, complexes of gadolinium Gd-DTPA (Magnevist®) accumulate less (around only 6 times) within the cells.
Surprisingly, the efficient concentration of nanoparticles for radiosensitizing effect (≈ 0.6 mM, as stated in Fig. 1A does not match with the maximum concentration of internalization (Fig. 1B), which, in the case of SQ20B, is found by ICP to be equal to 2 mM (after 2 mM, the quantity of particles internalized decreases). Such a phenomenon was already observed in the case of the other type of tumor cell line studied, U87 (Suppl. Fig. I in Supporting Information). To explain this discrepancy, we first eliminate the effect of gadolinium on redox status, in particular the modification of intracellular ROS levels. Indeed, in absence of irradiation, the fraction of surviving cells is 100% (control: cell without nanoparticle) in the Gd range investigated. Moreover it has been shown that for functionalization ensuring similar colloidal
1 2 3 4 5 6 7 8 9 10 11 12 13 14 15 16 17 18 19 20 21 22 23 24 25 26 27 28 29 30 31 32 33 34 35 36 37 38 39 40 41 42 43 44 45 46 47 48 49 50 51 52 53 54 55 56 57 58 59 60 61
stability (PEG instead of DTPA), ROS levels were not modified by the presence of gadolinium in neutrophil granulocytes [32]. We now hypothesize that the discrepancy could be assigned to a difference in the GBNs location within the cell related to the incubation concentration. Indeed, the particles that are quantified by ICP can lie within the cell at close proximity of DNA or, on the contrary, at cell surface far from the cell nucleus. Since the killing species resulting from X-ray/particles interactions (Auger electrons, ROS…) have a mean free path in the cell of only a few hundreds of nm (to be compared with the SQ20B size of around 15 µm), the location of the particles within the cell seems very important. The macroscopic concentration given by global chemical analysis is then no sufficient to appreciate the radiosensitizing efficiency of the particles and a GBNs classification according to their location in the cell requires observations at a smaller scale. This was achieved using confocal microscopy whose resolution is submicron (a few hundreds of nm). However, (i) to make the distinction between particles agglomerates and single particles (size < 5 nm), (ii) to establish histograms of agglomerates size distribution or (iii) to precise the particles location among the different compartments of the cell, electron microscopy is needed. In fact, even if single particles can be easily imaged when they are isolated (i.e. simply deposed on a carbon grid), they become indiscernible when they are internalized in cells. This complication is due to the absence of particles contrast when these latter (with a size < 5 nm) are observed within a cell sample with a thickness of 70-80 nm. Electron microscopy will be then principally used for agglomerate observation and determination of agglomerates size distribution within the cytoplasm. On the contrary, confocal microscopy will be applied to determine quantitatively the concentration of single particles in samples.
3.2. Particle and cell characterization
Before studying the interactions between particles and cells, these entities were separately characterized.
3.2.1. Particle characterization
For synthesizing the GBNs, a two-step process, described in details elsewhere [33], was carried out. In a first step, a core of Gd2O3 was precipitated by the polyol route [34]. In a
second step, a polysiloxane shell was deposited on the lanthanide oxide cores by hydrolysis of a mixture of APTES ((3-aminopropyl)triethoxysilane : H2N(CH2)3-Si-(OC2H5)3) and TEOS
(tetraethylorthosilicate : Si(OC2H5)4). During the polysiloxane reticulation, a quasi-ideal
encapsulation of each core is achieved with a thickness that can be adjusted by varying the amount of precursors. GBNs consist then of core (gadolinium oxide)-shell (polysiloxane)
1 2 3 4 5 6 7 8 9 10 11 12 13 14 15 16 17 18 19 20 21 22 23 24 25 26 27 28 29 30 31 32 33 34 35 36 37 38 39 40 41 42 43 44 45 46 47 48 49 50 51 52 53 54 55 56 57 58 59 60 61
particles. Due to the presence of amine groups within polysiloxane, different dyes such as Cy.5.5 can be covalently encapsulated in the shell and the particles can be further functionalized via diethylenetriamine-pentaacetic acid (DTPA) ligands to ensure their colloidal stability. The GBNs morphology was first studied by different techniques such as Photon Correlation Spectroscopy (PCS), Fluorescence Correlation Spectroscopy (FCS) and transmission electron microscopy (TEM). The hydrodynamic size distribution of the gadolinium oxide cores was measured in DEG after their synthesis for a concentration of 15 mM. The distribution is characterized by an average diameter of 1.1 ± 0.1 nm and a mean standard deviation of 0.4 ± 0.1 nm (Fig. 2A). After polysiloxane encapsulation and functionalization, the ready-to-use GBNs possess an average diameter of 2.9 ± 0.2 nm and a mean standard deviation of 1.3 ± 0.1 nm (Fig. 2B). Particles sizes were also measured by FCS thanks to some Cy5.5 molecules that are covalently encapsulated within the polysiloxane shell. FCC measurements were performed in different solutions: water, cell culture media (DMEM) and incubation media (HBSS) for GBNs concentrations ranging between 0.1 and 100 mM, immediately or 90 min after particle dilution in solution. FCS, which is commonly used to characterize the dynamics of fluorescent molecules in solution, deduces particles size from the fluctuations of the fluorescence intensity related to particle diffusion in the solution. Fig. 2C summarizes the results obtained: it shows that the FCS size is, regardless of the conditions used, close to 2.4 nm and does not depend on particle concentration nor on the nature of the solution. The size determined by FCS (2.4 nm) is in good agreement with that obtained by PCS (2.9 nm). This means that agglomerates formation is never observed in absence of cells and that the colloidal solutions possess an exceptional stability in water and DMEM culture media. This stability is also confirmed by the FCS measurements performed 90 min after dilution since they show again a complete absence of particle agglomeration. Finally, particles were observed by TEM to confirm the information given by PCS and FCS (insets in Fig. 2A and 2B). High Resolution TEM (x600000) performed on cores alone confirms their size (1.2 nm), which is in excellent agreement with the average diameter found by PCS (1.1 nm). It shows also that the cores are well crystallized since parallel planes with an inter-reticular distance of 0.311 nm are clearly visible in the inset of Fig. 2A. This distance corresponds to the inter-reticular (222) distance of the Ia3 gadolinium oxide structure (cell parameter: 1.082 nm). Concerning core/shell particles, conventional TEM at lower magnification (x100000) confirm the architecture of the particle since the image in the inset of Figure 2B shows effectively a core (inner dark zone) surrounded by a shell (outer grey zone). All these results confirm that the particles studied possess a size below the 5 nm range
1 2 3 4 5 6 7 8 9 10 11 12 13 14 15 16 17 18 19 20 21 22 23 24 25 26 27 28 29 30 31 32 33 34 35 36 37 38 39 40 41 42 43 44 45 46 47 48 49 50 51 52 53 54 55 56 57 58 59 60 61
which renders them particularly attractive for further in vivo studies, such small particles being excreted by the renal route [35].
Electron Energy Loss Spectroscopy (EELS) analysis (Fig. 2D) performed on the GBNs confirm the presence of Si and Gd in the nano-construct thanks to the spectrum that displays two peaks located at 102 and 149 eV and corresponding to the Si-L23 and Gd-N45 transitions.
Additional chemical analyses showed that each particle contains 20 % mass of Gd so that the Gd concentration of the particles is equal to: cGd particle/ = 2.8 10-12 mmol/µm3 (2.8 10-12 mmol of Gd per µm3 of particles). Moreover, the particles are paramagnetic at room temperature as inferred from the Curie plot (Fig. 2E) that shows that the Néel temperature related to the antiferro/paramagnetic transition is equal to 0.1 K. This relatively low value for TN, compared
to 18 K in macroscopic samples is entirely explained by the small size of the particles [36]. Particles relaxivities (Fig. 2F and Fig. 2G), measured at 60 MHz after dispersion in aqueous solutions containing NaCl (0.9%), are equal for r1 to 9.15 mM-1.s-1 (a value similar to that of
DOTA (Gd), one of the most frequently used MRI contrast agent (Dotarem®) and for r2 to
10.6 mM-1.s-1. Particles are also luminescent as shows Fig. 2H that displays their emission spectrum for an excitation at 633 nm. The spectrum presents a peak at 695 nm, the same value than does a solution of pure Cy5.5, which indicates that the fluorophore encapsulation in polysiloxane does not alter the main characteristics of the luminescent ligand. The magnetic and optical properties so evidenced confirm that the particles studied are effectively attractive for further in vivo studied, the following of the particles in the blood stream and their accumulation in tumors being possible by both optical and Magnetic Resonance Imaging. Finally, one of the most important parameter characterizing the particles is the value of their zeta potential at pH 7.4: pH7.4 = - 8 mV. This value is negative as expected from the presence on particles surface of DTPA ligands characterized by low pKAs. In addition to the entropic
repulsion, the colloidal stability of the solution is then also ensured at pH 7.4 by an electrostatic repulsion between the particles. Also the isoelectric point, corresponding to the pH for which the zeta potential is equal to 0 mV is equal to: pHe = 6.6 (pH6.5 = 1 mV;
6.6 pH
= - 1 mV) (data not shown).
3.2.2. Cell Characterization
The objective to quantify precisely the particle quantities that have been internalized within the cells requires the knowledge of the cell size distribution. The determination of this distribution has been performed using electron microscopy observations of resin samples (70
1 2 3 4 5 6 7 8 9 10 11 12 13 14 15 16 17 18 19 20 21 22 23 24 25 26 27 28 29 30 31 32 33 34 35 36 37 38 39 40 41 42 43 44 45 46 47 48 49 50 51 52 53 54 55 56 57 58 59 60 61
nm thin sections prepared by ultramicrotomy) containing some slices of cells. Due to the nature of the objects examined, the diameter of a so-cut cell slice is not equal to the cell diameter (the value of interest) but inferior or, at best, equal to it. Therefore, when measuring a size distribution from several images of the cells, one obtains the size distribution of the cell sections and not that of the cells, which is the distribution searched (for instance, in the case of a homogeneous size distribution of cells with a diameter Dcell , sec
4
cell cell tion
D D
with
sec cell tion
D the average diameter of the cell section i.e. the diameter experimentally obtained). It is then necessary to establish a mathematical formulation that permits to obtain the size distribution of the cells knowing that of the cell slices (Supporting Information). In the case of SQ20B cell line, the cells are shared between two distinct populations and are described by two Gaussian distributions, a first distribution concerning P1=66% of the cells with an average
diameter of D = 12.5 µm and a mean standard deviation of 1 1 = 2 µm and a second distribution concerning the other P2=33% of the cells with an average diameter of D = 16 2 µm and a mean standard deviation of 2 = 2 µm. The ratio between both populations P P1 2 is in excellent agreement with that obtained from confocal observations (P P1 2 68 32). Very striking also is that the ratio of the average volumes of the two populations (V and 1 V ) is 2 equal to: 2
1 2
V
V . This ratio is perfectly consistent with the 24 h cycle followed by each cell
(with a volume V ). Indeed, the cycle contains a mitosis phase corresponding to a division 2 into two daughter cells with half volume (V ). The facts that the mean standard deviations 1 relative to both populations (the cells before and after mitosis) are small and that the volume ratio is exactly 2 indicates that, during the cycle, both division and growth processes should occur rapidly (the proportion of cells with intermediate volumes comprised between V and 1
2
V being almost negligible). Even if the duration of the growth process (G1) is of about 9 h,
this is perfectly true for the division process (M) that lasts only 30min (Supporting Information for additional data upon the cell cycle) [37].
3.3. TEM observations of nanoparticle cellular uptake as a function of concentration and incubation time
1 2 3 4 5 6 7 8 9 10 11 12 13 14 15 16 17 18 19 20 21 22 23 24 25 26 27 28 29 30 31 32 33 34 35 36 37 38 39 40 41 42 43 44 45 46 47 48 49 50 51 52 53 54 55 56 57 58 59 60 61
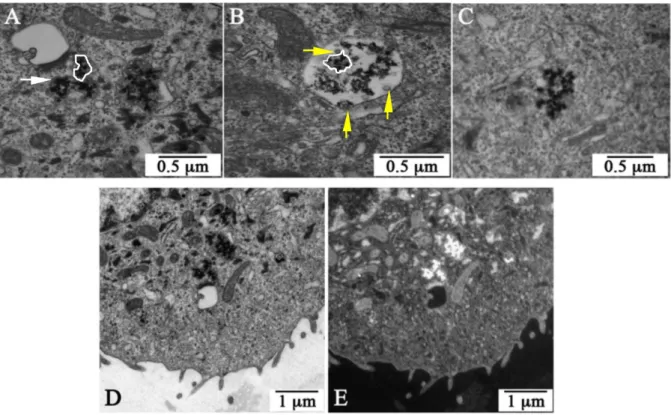
After particles incubation with cells, samples were prepared for TEM analysis. A careful examination of more than 300 images confirms that, as already mentioned in paragraph 2.1, the sub-5 nm single particles are not visible regardless of the magnification used (from 120000 to 1000000). As illustrated in Fig. 3A, Fig. 3B and Fig. 3C that display diverse cell zones, only agglomerates with a size comprised between 150 and 900 nm can be imaged. Since the cells have been stained by different heavy metals, it is crucial to verify that the agglomerates observed correspond to the internalized particles (osmium tetroxide for instance leads very often to 5 nm clusters that can gather in certain cell compartments). This has been made by performing additional electron imaging using Energy Filtered Transmission Electron Microscopy (EFTEM), a technique particularly suitable for lanthanide identification. Selecting the only electrons that have lost 150 eV in the thin sample observed (150 eV corresponds to the Gd-N4,5 transition), it is possible to specifically image the zones rich in
gadolinium, i.e. the GBNs. Fig. 3D and Fig. 3E display the images of the same cell, one taken with a conventional electron microscope in bright field conditions and the other obtained in filtered conditions i.e. by electrons that have lost 150 eV. Due to a sufficient contrast, this latter image has not been corrected from the contributions of the pre and post N45-edges.
Whereas the agglomerates appear in black in the image of Fig. 3D (revealing that these latter certainly contain heavy elements), they are clearly brighter in Fig. 3E. This means that, as expected, the agglomerates contain a high content of gadolinium and have been formed by the gathering of several GBNs. This result has been reinforced by Energy Dispersive X-ray spectroscopy analyses. Indeed, these latter have systematically evidenced that, when the electron beam is focused on the agglomerates, some of the X-rays emitted are characteristic of the electron transitions of Gd (L 6.056 keV, M 1.185 keV) (data note shown).
Very frequently the agglomerates are trapped in vacuoles clearly delineated by a membrane. This latter, that separates the agglomerates from the cytoplasm by a double barrier (see white arrow in Fig. 3A), has been underlined for clarity in certain zones of the Fig. 3A and Fig. 3B (white outline). Two types of vacuoles containing agglomerates can be observed: vesicles (V) with a size comprised between 100 and 600 nm and, in a less proportion, multivesicular bodies (MVB) ranging between 500 and 900 nm. The Vs that contain agglomerates consist in early (or sorting) endosomes. The MVBs are always surrounded by a limiting membrane and consist in organelles that result from the gathering of several Vs, sometimes of different types. Since MVBs are themselves endocytic intermediates, they can internalize via endocytic pathways smaller vesicles (40 – 90 nm) such as the vesicles visible in Fig. 3B (see yellow arrow). A small proportion of the agglomerates do not possess the above-mentioned double
1 2 3 4 5 6 7 8 9 10 11 12 13 14 15 16 17 18 19 20 21 22 23 24 25 26 27 28 29 30 31 32 33 34 35 36 37 38 39 40 41 42 43 44 45 46 47 48 49 50 51 52 53 54 55 56 57 58 59 60 61
barrier that separates them from the cytoplasm (Fig. 3C). Since the few single particles that enter in the cell by passive diffusion cannot agglomerate within the cell (Supporting Information), the absence of the membrane should probably result from a vesicle bursting [38]. Also, a care examination of the agglomerates shows that these latter do not consist directly in the agglomeration of sub-5 nm GBNs but rather of entities (the aggregates) with a size comprised between 15 and 40 nm. Since these latter appear almost completely dense in the electron images, they should result from the aggregation of the GBNs. Moreover, whereas the agglomerates lie isolated in the large MVBs (each MVB containing between 1 and 10 agglomerates), the membranes of the vesicle almost exactly conform to the shape of the agglomerate. Under these conditions, the filling ratio of the particles within the vesicles can be estimated: after observation of more than 50 vesicles corresponding to different incubation conditions and taking into account different assumptions (such as the GBNs form a compact stacking within the aggregates), the filling ratio, fr, does not depend significantly on the
incubation conditions such as the concentration or the time and is equal to 0.15.
3.3.2. Effect of concentration
With the objective to understand the mechanisms of particle internalization, the two main parameters controlling the incubation conditions, particle concentration and incubation time were successively changed. To study the effect concentration, we chose an incubation time of 1 h and a range of concentration comprised between 0.1 and 2 mM in order to retrieve the conditions for which the radiosensitizing effect of particles is maximal (clonogenic assays showed that the best radiosensitizing effect corresponds to an incubation for 1 h at a concentration of 0.6 mM). In a first step, the whole cells were characterized by Scanning Electron Microscopy. This technique that permits to observe the morphology of the cells shows that the quantity of particles attached on cell surface increases with the concentration (Fig. 4). Indeed, whereas the cell surface is almost exempt of GBNs for an incubation concentration of 0.1 mM, large portions of the cell surface are completely coated by several shells of agglomerates for a concentration of 0.6 mM. The cells were carefully rinsed several times before observation; the images indicate then that at the vicinity of cells, particles tend to strongly agglomerate and adhere to their surface. Since it has been shown (paragraph 2.2.a) that, in absence of cells, the GBNs remain colloidally stable in different media (water, HBSS, DMEM) for a very large range of incubation concentration, the agglomeration observed here must be undoubtedly attributed to the presence of cells. This suggests that the particle internalization should take place in two steps, an agglomeration of particles followed by an
1 2 3 4 5 6 7 8 9 10 11 12 13 14 15 16 17 18 19 20 21 22 23 24 25 26 27 28 29 30 31 32 33 34 35 36 37 38 39 40 41 42 43 44 45 46 47 48 49 50 51 52 53 54 55 56 57 58 59 60 61
agglomerate uptake. To further characterize the agglomerates that have been internalized within the cell, TEM clichés were taken to visualize different cell sections for the same three concentrations already used. The presence of external agglomerates at close vicinity of the cells and the increase of their number with concentration permitted to confirm the information already given by the SEM technique. However, the agglomerates are not strongly bounded to the surface but are found to lie at a certain distance of the cell (inferior to a few micrometers). This suggests that the forces responsible for the presence of agglomerates near cells are not of a chemical nature but originates from physical interactions (probably electrostatic).
To establish the size distribution of the vacuoles sections (vacuoles being either V or MVB), these latter were counted on a large number of thin cell sections (70 nm) comprised between 50 and 70. The size distributions presented in Fig. 4 were normalized by the number of cells investigated. To avoid counting two times the same vacuole, the cells slices cut by ultramicrotomy were observed only in twenty (the distance between two slices studied being then superior to the size of a vacuole). For an incubation time of only 1h, the MVBs generally contain only one agglomerate even for high concentration (as in Fig. 4; TEM MVBs, 2 mM). The presence of several agglomerates in the MVBs constitute a very unusual situation that can be observed for all concentrations including the lowest (as in Fig. 4; TEM MVBs, 0.1 and 0.6 mM). Therefore, in the case of an incubation time of 1 h, the size distribution of the vacuoles coincides almost exactly to that of the agglomerates.
For concentration varying from 0.1 to 0.6 mM, the number of vacuoles per cell increases before decreasing for the concentration of 2 mM (see graphics in Fig. 4). Surprisingly, the number of agglomerates per cell (i.e. per vacuole) does not still increase with concentration but reaches a plateau for concentrations around 0.6 mM. Moreover, the average size of both vesicles and MVBs sections are found to increase with concentration. Taking into account that the average size of the vacuoles sections, Dvac. section, is lower than that of the vacuoles,
. vac
D (the exact relation between these two entities being: Dvac.4 Dvac. section (see Supporting Information)), one can conclude that the average size of the vacuoles (V+MVBs) quantitatively increases from 0.1 mM (271 nm), up to 0.6 mM (406 nm) and 2 mM (612 nm). The increase of the vesicle size with concentration indicates that the agglomerates formed at vicinity of the cell are larger for high concentration, which is consistent with the general laws of the agglomeration processes. Concerning MVBs, the same increase can be simply explained by the fact that greater agglomerates-containing vesicles fuse with other types of vesicles to form larger MVBs.
1 2 3 4 5 6 7 8 9 10 11 12 13 14 15 16 17 18 19 20 21 22 23 24 25 26 27 28 29 30 31 32 33 34 35 36 37 38 39 40 41 42 43 44 45 46 47 48 49 50 51 52 53 54 55 56 57 58 59 60 61
All these results are very important, relatively to the objective of the paper that consists in understanding why the maximum of therapy efficiency is observed for an incubation concentration of 0.6 mM. Indeed, this concentration of 0.6 mM seems to simply correspond to the more efficient internalization of GBNs as agglomerates in the cell cytoplasm.
3.3.3. Effect of incubation time
Studying the kinetics of internalization into the cells should permit to precise the mechanisms of particles entry. First, kinetics has been macroscopically evaluated by means of ICP using cells that have been incubated for different times (30 min, 1 h and 2 h) and carefully rinsed before analysis. Since 0.6 mM is the most effective dose for radiosensitizing (Fig. 1A), this concentration has been chosen for all the experiments. According to Fig. 5A, internalization seems to follow approximately the classical Fick’s law of diffusion characterized by a high rate at the beginning of the process followed by a strong deceleration. Here, the deceleration occurs after 1h, the increase in the quantity of particles internalized or attached on cells surface between 1 and 2 h being smaller than 15 %. More precisely, Fig. 5B, Fig. 5C and Fig. 5D show that the vesicles seems lying in a stationary state since their size distribution does not undergo significant modifications with time: for instance the average vesicles size are equal to 359 nm at 1 h and 350 nm at 2 h. This means that the quantity of agglomerates internalized into vesicles is almost exactly compensated by that of vesicles fusing into MVBs. In the same time one can remark both an increase in the quantity of particles internalized in MVBs and in the average size of MVBs, this latter varying from 682 to 801nm between 1 and 2 h of incubation. This last result is consistent with the fact that the new vesicles formed by agglomerate entry can themselves fuse to the MVBs already present in the cytoplasm. Under these conditions (2 h of incubation), the MVBs can contain more than one agglomerate, which is effectively observed by electron transmission. Indeed, contrary to low time incubation (<1h) for which each MVB generally encapsulate only one agglomerate, more than 1/3 of the MVBs contain 2 or more agglomerates for an incubation of 2 h (data not shown).
All these results show that the kinetics of particle internalization process is very similar to that followed by molecules or proteins [39], which indicates that the entry of agglomerates of a few hundreds of nanometers is quite similar to that of the smaller species usually involved in the cell metabolism. Generally, the cells used the trafficking from early endosomes (the vesicles) to late endosomes (MVBs) and lysosomes to degrade different types of molecular species. During the endocytic pathways (of species to vesicles), the species are rapidly (< 2 min) exposed to a drop in pH from neutral to pH 5.9-6.0 in the lumen of early recycling
1 2 3 4 5 6 7 8 9 10 11 12 13 14 15 16 17 18 19 20 21 22 23 24 25 26 27 28 29 30 31 32 33 34 35 36 37 38 39 40 41 42 43 44 45 46 47 48 49 50 51 52 53 54 55 56 57 58 59 60 61
vesicles, with further decrease from pH 6.0 to 5.0 during progression from late endosomes to lysosomes [40,41].It seems then that the particles are taken in charge by the cell to provoke their destruction under acidic conditions before their eventual rejection out of the cell (not observed here for the duration of incubation used).
3.4. Macropinocytosis as the first entry mechanism of GBN at a moderate dose
3.4.1. First indication of a macropinocytosis process
After having specified the internalization process as a function of the incubation conditions (concentration and time), we now focus on the early stage of particles entry that seems characteristic of a macropinocytosis process. Indeed, according to the micrographs of Fig. 6 that details the particles motion through the membrane, it can be seen that, in presence of GBN agglomerates at vicinity of cell surface, there is some extension of the plasma membrane towards the extracellular medium. Precisely, the membrane tends an « arm » (lamellipodium) to pick up the particles agglomerates before curving the arm and locking the agglomerate in the so formed vesicle that has a size comprised between 100 nm and 600 nm.
Macropinocytosis is the only entry process that possesses these characteristics especially considering the deformation undergone by the membrane and the size of the entity internalized. Indeed, it is characterized by some membrane ruffling induced on cell surface and/or formation of membrane protrusions. These protrusions do not zipper up along the particle but collapse onto and fuse with the membrane to generate large endocytic vesicles, called macropinosomes (200 nm to 2 µm in diameter) [22]. These characteristics that can be retrieved in Fig. 6 are absent in the other mechanisms of internalization. For instance, in the clathrin-mediated endocytosis, the coated vesicle has a size of approximately 120 nm and is formed after membrane invagination (not seen here), scission and release into the cell. Similarly, caveolin-mediated endocytosis first processes by flask-shaped 50-60 nm invaginations at cell surface that further pinch off to form vesicles. Also clathrin and caveolin-independent cholesterol microdomains (also called rafts) have a size of 40-50 nm that can diffuse freely on the cell membrane. Since the size of the vesicles observed here is generally comprised between 150 and 600 nm (Fig. 3 and Fig. 4) and that no invagination containing GBNs was observed on SQ20B cells membrane, the different types of endocytosis can not be responsible for internalization of particles agglomerates. Also the phagocytosis, a highly regulated process involving specific cell-surface receptors, can be eliminated since these receptors are only present on the membrane of specialized cells such as macrophages and monocytes. The phagocytosis is recognized by the formation of cell-membrane extensions
1 2 3 4 5 6 7 8 9 10 11 12 13 14 15 16 17 18 19 20 21 22 23 24 25 26 27 28 29 30 31 32 33 34 35 36 37 38 39 40 41 42 43 44 45 46 47 48 49 50 51 52 53 54 55 56 57 58 59 60 61
that zipper up around the particle to engulf it [42]. Macropinocytosis seems then to be the major possible pathway for agglomerate internalization into SQ20B cells.
3.4.2. General description of the complete entry mechanism involving two successive steps: NP agglomeration at the vicinity of the cell and internalization via lamellipodia (macropinocytosis)
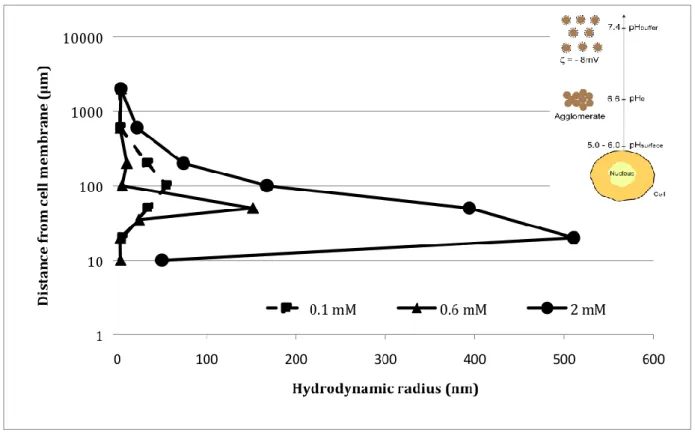
To check if the formation of agglomerates is really favored by the presence of cells, FCS measurements were performed in order to estimate the size of the particles as a function of their distance from the cell. Measures were made directly after dilution of the GBNs in the medium (HBSS or water) as well as 90 min later, as a function of particles concentration. By moving the laser excitation perpendicularly to the surface supporting the cell, it was possible to obtain FCS signal at a distance of 5 µm from the cell until some hundreds of µm using a step of 10 µm. As indicated in Fig. 7, the particles gather effectively in agglomerates in the solution at a distance from the cell that depends on the concentration and whose order of magnitude is of some tenths of micrometers (Table VI.1. in Supplementary Information). Since no agglomeration is observed in absence of cells regardless of the medium and the particles concentration, this latter is necessarily related to the presence of cells. Indeed, it is well known that cells modify at their vicinity some parameters of the solution such as the ionic force, the osmolarity or the pH. In our opinion, it is this latter parameter, in conjunction with the fact that the isoelectric point of the particles is equal to pHe 6.6 that influences the
possibility of agglomeration. As already mentioned, cells are negatively charged with, at vicinity of the membrane, a pH inferior to that found in normal tissues, typically pHsurf. 5-6.
Now when the distance from the cell increases, pH should vary simultaneously from the value near the cell, pHsurface 5-6, to that of the buffer, pHbuffer 7.4 (see inset in Fig. 7). Since the
particles are negatively charged at pH 7.4 (= - 8 mV) and are characterized by an isoelectric point at pHe6.6, this latter pH is attained at a certain distance from the cell. At this distance the electrostatic stabilization of the solution completely vanishes so that the particles could lose their colloidal character. This loss of electric repulsion is probably accentuated by the different species such as metal cations that are permanently rejected by the cell and can participate to a strong screening of the repulsion forces. In conclusion, the condition necessary to obtain some particles agglomeration should be that the isoelectric point of the particles (pH ) is simply comprised between the pH at close vicinity of the cell (e pHsurface) and that of the buffer (pHbuffer), condition that is effectively fulfilled here:
1 2 3 4 5 6 7 8 9 10 11 12 13 14 15 16 17 18 19 20 21 22 23 24 25 26 27 28 29 30 31 32 33 34 35 36 37 38 39 40 41 42 43 44 45 46 47 48 49 50 51 52 53 54 55 56 57 58 59 60 61 surface e buffer pH pH pH
By examining precisely the results of Fig. 7, the size of the agglomerates increases, as expected, with the particles concentration (150 nm for a Gd incubation concentration of 0.1 mM, 800 nm for 2 mM) while the distance to the cell at which some agglomeration occurs significantly decreases with concentration. For instance, particles agglomerate at 100 µm for a concentration of 0.1 mM, 60 µm for 0.6 mM and 20-30 µm for 2 mM. At vicinity of the cell where more acidic conditions are encountered, the species that lie at the particles surface (such as DTPA or amine groups…) are subjected to a H+
consumption that locally increases the pH. This leads to a pH increase near the cell that induces some particles agglomeration at a distance that is smaller when the particles concentration is high. This explanation (which is in complete qualitative agreement with the results of Fig. 7) indicates the optimal incubation concentration range that favors the mechanism of macropinocytosis. Indeed, when the agglomerates are too large (which happens for too high incubation concentrations), they are more hardly entrapped by the lamellipodia that lie at an average distance of 500-800 nm one from each other. Similarly, when the agglomerates are too far from the cells (which happens for too small incubation concentrations), they cannot be efficiently recuperated by the lamellipodia. Therefore, the technique of FCS that permits a direct determination of both the location and the size of the agglomerates explains entirely the results of Fig. 4 in which it appears that macropinocytosis is efficient only in a limited range located around an incubation concentration of 0.6 mM. In particular, these results might in part explain the reduction of internalization at 2 mM into SQ20B cells due to an excessive agglomeration.
All the results are confirmed by the SEM data of Fig. 4. Indeed GBNs seem to agglomerate at vicinity of the cell before entering into cells via clearly visible lamellipodia.
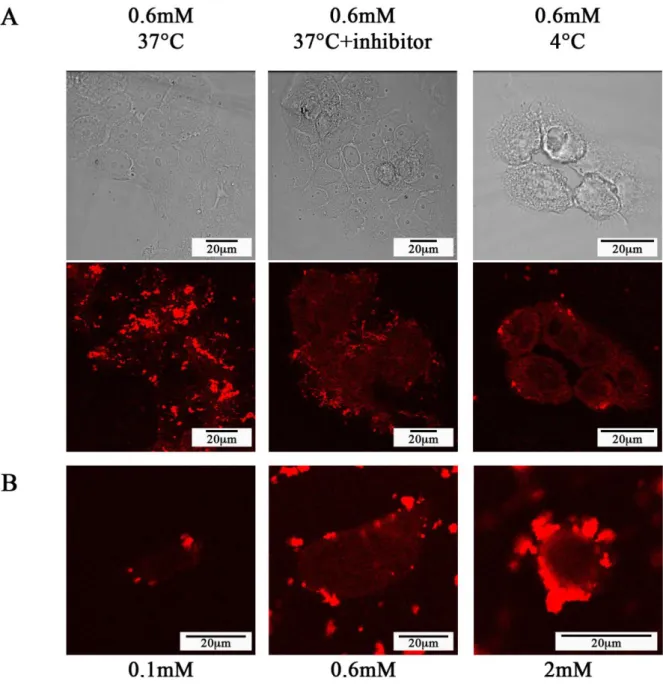
3.4.3. Confirmation of macropinocytosis pathway by confocal microscopy using inhibitors The two previous paragraphs have shown that: (i) some agglomerates are formed at vicinity of the cells that (ii) can cross the membrane with help of cells lamellipodia. Since the size of the agglomerates and the observed membrane strains are consistent with a macropinocytosis route, we used an inhibitor of this process to identify it definitely. Confocal microscopy observations were then performed on fixed cells incubated for 1 hour at 37°C and GBNs concentration of 0.1, 0.6 and 2 mM in the medium alone or containing, amiloride, the macropinocytosis inhibitor chosen (Supporting Information). In absence of inhibitor, some of the agglomerates are clearly internalized (see the small red dots due to the Cy5.5 encapsulated
1 2 3 4 5 6 7 8 9 10 11 12 13 14 15 16 17 18 19 20 21 22 23 24 25 26 27 28 29 30 31 32 33 34 35 36 37 38 39 40 41 42 43 44 45 46 47 48 49 50 51 52 53 54 55 56 57 58 59 60 61
in GBNs in Fig. 8 for the concentration of 0.6mM). On the contrary, in presence of amiloride, all the agglomerates stay at the cell surface, none of them penetrating in the cytoplasm regardless of the GBN concentration, 0.1, 0.6 or 2 mM. This is the definitive proof that the internalization pathway of the agglomerates consists effectively in macropinocytosis.
Finally, this result was confirmed by two different kinds of experiments. (i) First, macropinocytosis is a temperature-dependent process that is also inhibited at low temperature. As expected, a similar inhibition of the agglomerates entry is also observed at 4°C even in absence of amiloride. (ii) Second, it was also proven that the inhibitors of the two more probable alternative pathways for agglomerates internalization (amantadine as the inhibitor of the clathrin-dependent endocytosis and nystatine as the inhibitor of the caveolae-dependent endocytosis inhibitor) are not able to inhibit the agglomerate entry into SQ20B cells (Supporting Information).
3.5. Passive diffusion as a second mechanism of GBN entry
An attentive examination of the micrographs of Fig. 8A shows that in absence of macropinocytosis, some particles can nevertheless enter into the cell cytoplasm since this latter appears in a red and uniform color that contrasts with the less red coloration of the nucleus. Since the entry processes of endocytosis and phagocytosis have been already eliminated, this particles entry should be related to some passive diffusion of particles within the cytoplasm. This internalization pathway that is purely mechanistic and for this reason temperature-independent is confirmed by the fact that for an incubation at 4°C, a temperature that slacken the biological activity of the membrane, the particle entry is quite similar to that observed for internalization at 37°C (see Fig. 8B which shows particles entry into the cytoplasm for incubation concentrations of 0.1, 0.6 and 2 mM at 4°C and so evidences that passive diffusion is more efficient for high incubation concentration).
In conclusion, two different pathways participate to particles entry during cell incubation in the presence of GBNs: macropinocytosis and passive diffusion.
3.6. Relative quantification of the different internalization mechanisms and explanation of radiotherapy efficiency at moderate dose
From all the results obtained, it is now possible to discriminate, among the quantity of gadolinium attached to the cells (i.e. measured by ICP and expressed in mmol of Gd per liter of cell), the relative proportions of (i) the gadolinium entered by macropinocytosis, (ii) that entered by passive diffusion and (iii) that remaining at the surface. This will be done for the
1 2 3 4 5 6 7 8 9 10 11 12 13 14 15 16 17 18 19 20 21 22 23 24 25 26 27 28 29 30 31 32 33 34 35 36 37 38 39 40 41 42 43 44 45 46 47 48 49 50 51 52 53 54 55 56 57 58 59 60 61
three incubations performed at different incubation concentrations, 0.1, 0.6 and 2 mM for an incubation time of 1 hour.
3.6.1. Determination of the quantity of particle entered by macropinocytosis
To determine the quantity of particles entered by macropinocytosis, we used the histograms of Fig. 4 resulting from systematic observations of agglomerates by electron microscopy. They give the normalized size distribution of the vesicle sections for the incubation concentrations, 0.1, 0.6 and 2 mM. For each concentration, N cells have been studied and n vesicles have been counted. Agglomerate (or vacuoles under the justified assumption that each vacuole, V or MVB, contain only one agglomerate) distributions have been normalized by a division by the total number of vacuoles, n. The histograms give then also the density of probability,
vac. section
p D , to find a vacuole section of a given size, Dvac. section. From the average size of the vacuole sections, Dvac. section, one can derive a satisfying approximation of the average size of the vacuoles, Dvac. using the formula: Dvac.4 Dvac. section. This relation is valid for spherical vacuoles and narrow size distributions (see Supporting Information) and, as already stated in the case of cells; it indicates that the diameter of a vacuole section is smaller than the diameter of the vacuole. The average volume of the vacuoles can then be approximated by the relation, 3 . . 4 3 2 vac vac D V
, that is again valid for narrow size distributions. If one denote z
the thickness of the sections observed (z70 nm), the total volume of the cells investigated is then Vcelltotal N D cell2 sectionz while that of the vesicles is equal to:
2 . sec total vac tion ves V n D z. In the last formulas, Dcell2 sectionP D1 12cellsectionP D2 22cellsection where D1cellsection and D2cellsection are the average values relative to the two populations of the cells and P and 1 P their relative 2
proportions. The volume of vacuoles per cell is then equal to:
2 2
sec ./
. ec .
cell tion cell
cell cell
vac cell
vac s tion vac
n D n D
V V V
N D N D
and the number of vacuoles per cell
./
./ . vac cell vac cell vac V n V . Remembering finally that the filling coefficient of the vacuoles by the particles is equal to fr = 0.15 (when neglecting the low proportion of MVBs in front of that of
Vs) and that the Gd concentration is equal to: cGd particle/ = 2.8 10
-12
mmol of Gd per µm3 of particles, the concentration of Gd per liter of cell brought by macropinocytosis is equal to:
1 2 3 4 5 6 7 8 9 10 11 12 13 14 15 16 17 18 19 20 21 22 23 24 25 26 27 28 29 30 31 32 33 34 35 36 37 38 39 40 41 42 43 44 45 46 47 48 49 50 51 52 53 54 55 56 57 58 59 60 61 . ./ /
macropin vac cell r Gd particle Gd
cell
n f c
c
V
. All these data, completed by the quantity and concentration of Gd per vacuole (qGd vacmacropin/ . . and cGd vacmacropin/ . .) are given in Table 1 for the concentrations 0.1, 0.6 and 2 mM taking into account that: Vcell 1583m3.
3.6.2. Determination of the quantity of particles entered by passive diffusion
To determine now the concentration of particles entered by passive diffusion, results obtained in confocal microscopy were used. Precisely, the particle concentration related to passive diffusion has been determined from the comparison of the optical signals of, on one hand, the vacuoles filled by macropinocytosis and, on the other hand, those of the cytoplasm filled by passive diffusion during incubations at 4°C (Supporting Information). We took into account that the agglomerates entered by macropinocytosis were visualized using an excitation power of 4% whereas the isolated particles internalized by passive diffusion were visualized using a higher power of 60%. Denoting Iagglomeratemacropin. the pixel intensity of the agglomerates entered by macropinocytosis and Iparticlepassive diff. that of the particles entered by passive diffusion, we find that
the ratio . . macropin agglomerate passive diff particle I I
obeys the formula:
. . / . . . / macropin macropin agglomerate Gd vac
passive diff passive diff particle Gd cytoplasm
I c
I c
in which cGd vacmacropin/ . . and cGd cytoplasmpassive diff/ . are respectively the concentration of Gd in the vacuoles entered by macropinocytosis (mmol of Gd per L of vacuole) and that of Gd in the cytoplasm internalized via passive diffusion (mmol of Gd per L of cytoplasm). Again, all the steps needed for calculating the particles concentration related to the passive diffusion pathway
(cpassive diffusion) are given in Table 2. In this table, we give in particular the ratio as well as
the concentration of Gd entered by passive diffusion, cGdpassive diff., that we derive according to the relation: passive diff. passive diff/ . cytoplasm
Gd Gd cytoplasm
cell
V
c c
V
. Vcell 1583m3 , Vcytoplasm 1005m3 and 3
578 nucleus
V m .
3.6.3. Recapitulation of the quantities of Gd internalized by the different entry pathways (macropinocytosis and passive diffusion) and attached on cell surface