Prediction of Allogeneic Hematopoietic Stem-Cell
Transplantation Mortality 100 Days After Transplantation
Using a Machine Learning Algorithm: A European Group
for Blood and Marrow Transplantation Acute Leukemia
Working Party Retrospective Data Mining Study
Roni Shouval, Myriam Labopin, Ori Bondi, Hila Mishan-Shamay, Avichai Shimoni, Fabio Ciceri, Jordi Esteve, Sebastian Giebel, Norbert C. Gorin, Christoph Schmid, Emmanuelle Polge, Mahmoud Aljurf, Nicolaus Kroger, Charles Craddock, Andrea Bacigalupo, Jan J. Cornelissen, Frederic Baron, Ron Unger, Arnon Nagler, and Mohamad Mohty
Author affiliations appear at the end of this article.
Published online ahead of print at www.jco.org on August 3, 2015. Both A.N. and M.M. contributed equally to this work.
Supported by Israel Cancer Association Research Grant No. 20130180 and the 2013 Pinchas Borenstein Talpiot Medi-cal Leadership Program, The Chaim Sheba Medical Center, Tel-Hashomer, Ramat-Gan, Israel (R.S.).
Presented at the 55th American Society of Hematology Annual Meeting and Exposition, New Orleans, LA, Decem-ber 7-10, 2013.
Authors’ disclosures of potential conflicts of interest are found in the article online atwww.jco.org. Author contributions are found at the end of this article.
Corresponding author: Roni Shouval, MD, Division of Hematology and Bone Marrow Transplantation, Chaim Sheba Medical Center, 52621 Hashomer, Ramat-Gan, Israel; e-mail: shouval@ gmail.com.
© 2015 by American Society of Clinical Oncology
0732-183X/15/3328w-3144w/$20.00 DOI: 10.1200/JCO.2014.59.1339
A B S T R A C T
Purpose
Allogeneic hematopoietic stem-cell transplantation (HSCT) is potentially curative for acute leuke-mia (AL), but carries considerable risk. Machine learning algorithms, which are part of the data mining (DM) approach, may serve for transplantation-related mortality risk prediction.
Patients and Methods
This work is a retrospective DM study on a cohort of 28,236 adult HSCT recipients from the AL registry of the European Group for Blood and Marrow Transplantation. The primary objective was prediction of overall mortality (OM) at 100 days after HSCT. Secondary objectives were estimation of nonrelapse mortality, leukemia-free survival, and overall survival at 2 years. Donor, recipient, and procedural characteristics were analyzed. The alternating decision tree machine learning algorithm was applied for model development on 70% of the data set and validated on the remaining data.
Results
OM prevalence at day 100 was 13.9% (n 5 3,936). Of the 20 variables considered, 10 were selected by the model for OM prediction, and several interactions were discovered. By using a logistic transformation function, the crude score was transformed into individual probabilities for 100-day OM (range, 3% to 68%). The model’s discrimination for the primary objective performed better than the European Group for Blood and Marrow Transplantation score (area under the receiver operating characteristics curve, 0.701 v 0.646; P , .001). Calibration was excellent. Scores assigned were also predictive of secondary objectives.
Conclusion
The alternating decision tree model provides a robust tool for risk evaluation of patients with AL
before HSCT, and is available online (http://bioinfo.lnx.biu.ac.il/;bondi/web1.html). It is presented
as a continuous probabilistic score for the prediction of day 100 OM, extending prediction to 2 years. The DM method has proved useful for clinical prediction in HSCT.
J Clin Oncol 33:3144-3151. © 2015 by American Society of Clinical Oncology
INTRODUCTION
Allogeneic (allo) hematopoietic stem-cell transplan-tation (HSCT) is a potentially curative procedure for selected patients with hematologic disease. Despite a reduction in transplantation risk in recent years,1 morbidity and mortality remain substantial, making the decision of whom, how, and when to perform transplantation of great importance.
Numerous parameters affect transplantation-related risk. When indicated, clinical judgment
of-ten plays a key role in patient selection.2Risk scores for mortality prediction, such as the European Group for Blood and Marrow Transplantation (EBMT) risk score and the Hematopoietic Cell Transplant-Comorbidity Index (HCT-CI),3-5may aid decisions. These scoring systems were developed using a standard statistical approach and have been validated; however, their predictive accuracy is still suboptimal.6-9
The development of large and complex regis-tries,10incorporating biologic and clinical data, and
the need for improved prediction models generate the drive to apply machine learning (ML) algorithms for clinical predictions.11ML is a field in artificial intelligence stemming from computer sciences. The underlying paradigm does not start with a predefined model; rather, it lets the data create the model by detecting underlying patterns.11Thus, this approach avoids preassumptions about model types and variable interactions, and may complement standard statistical methods.12,13 Different algorithms are used to produce a function, a model, which will fit the data and not the other way around. In such procedures, many variables and combinations thereof can be used, and models are developed on a training set and validated on a test (ie, validation) set.11 ML algorithms are part of a wider approach, called data mining (DM), for analyzing large and complex data sets. Such algorithms have been used in various financial and technologic applications and are gradually entering clinical use.11DM is a multidisciplinary field seek-ing to discover knowledge in databases in a systematic and automatic process.14A primer on the DM method in HSCT has been published by Shouval et al.11
The need for improved risk assessment of allo-HSCT and the potential benefits of the DM approach served as the rationale for undertaking the current study. We have applied such an approach on a large cohort of patients with acute leukemia (AL) to develop an ML-based prediction model of overall mortality (OM) 100 days after allo-HSCT. We then assessed the model’s ability to predict outcomes at 2 years.
PATIENTS AND METHODS Study Design and Outcomes
This was a retrospective, DM, supervised learning study, on the basis of data reported to the Acute Leukemia Working Party registry of the EBMT. The EBMT is a voluntary working group of more than 500 transplantation centers, required to report all consecutive HSCT and follow-ups annually in a stan-dardized manner. The registry is routinely audited. The study was approved by Acute Leukemia Working Party.
The primary objective was prediction of OM 100 days after allo-HSCT. Secondary objectives were the estimation of overall survival (OS), nonrelapse mortality (NRM), leukemia-free survival (LFS), and relapse incidence at 2 years, according to the score predicted for day100 OM.
All outcomes were measured from the time of allo-HSCT. Day 100 OM was defined as death from any cause before day 100; NRM was defined as death without previous relapse/progression; LFS was defined as survival without leukemia progression or relapse; and relapse was defined as leukemia recur-rence at any site. Cumulative incidence functions were used to estimate 2-year NRM and relapse after transplantation, taking into account the competition between these two events.15Probabilities of OS and LFS at 2 years were calculated using the Kaplan-Meier estimate.16Patients were censored at time of the last follow-up.
Population and Variables
Per protocol, inclusion criteria encompassed first allogeneic transplan-tations, performed from 2000 to 2011, using peripheral blood stem cells or bone marrow as the cell source, in adults age $ 18 years diagnosed with de novo AL. Haploidentical transplantations were excluded.
A total of 29,685 patients from 404 European centers were initially analyzed. Patients lost from follow-up before day 100 after HSCT were discarded from analysis (n 5 1,449, 5%; Data Supplement). Twenty vari-ables describing recipient, donor, and procedural characteristics were con-sidered. Variables were defined according to EBMT criteria17 and are detailed inTable 1and the Data Supplement.
Alternating Decision Tree
The alternating decision tree (ADT) is an ML algorithm designed for prediction. It generates alternating levels of prediction and decision nodes, denoted as ellipses and rectangles, respectively. Each prediction node is asso-ciated with a weight, representing its contribution to the final prediction score, whereas each decision node contains a splitting attribute (ie, variable). The tree is formed through an iterative process. The iteration number, in which the decision node was introduced to the tree, is an arbitrary measure of its tance as a decision rule (ie, lower iterations correspond to higher impor-tance).18The first level of decision nodes represents independent variables, whereas daughter decision nodes are dependent on previous decisions.
Prediction with ADT involves pursuing multiple paths, corresponding with the instance features, with the same variable possibly playing multiple roles in different places along the tree. To calculate the score, one starts at the root and proceeds along multiple paths down the tree, according to the follow-ing rules: If the node is a prediction node, proceed along all of the dotted edges emanating from it; if the node is a decision node, proceed along the edge corresponding to the instance characteristics (Fig 1). The cumulative score gathered by an instance (ie, patient) is the sum of the prediction values along all paths that the patient traverses in the decision tree. A positive score implies membership of one class, and a negative score, membership of the other class. Higher absolute scores are associated with higher probability of a certain binary outcome (ie, day 100 OM). In the current study, we did not choose a threshold for classification, but used the cumulative score as a continuous probabilistic measure for classification. The good performance of ADT, which is achieved while maintaining interpretability, makes it an excellent choice in clinical settings.19-21For a detailed description of the algorithm, see Freund and Mason18and the Data Supplement.
Model Development and Validation
The ADT algorithm was applied for prediction model development. The study cohort was randomly divided into training (n 5 19,765; 70%) and validation (n 5 8,471; 30%) data sets. The algorithm was trained and tested using 10-fold cross validation on the training data set and validated on the validation set (Data Supplement). In addition, a separate Cox regression model, including the variables selected by the ADT model, was simultaneously developed on the training set for prediction of day 100 OM and then validated using the validation set. Software packages used were WEKA (version 3 to 7-9;
http://www.cs.waikato.ac.nz/ml/weka/), SPSS 19 (http://www-01.ibm.com/ software/analytics/spss/), and R version 3.0.1 (http://www.r-project.org/). For personalized score calculation, an online interface was constructed (http:// bioinfo.lnx.biu.ac.il/;bondi/web1.html).
Predictive Performance and Comparison With the EBMT Score
To transform the crude score into individual probabilities of day 100 OM, the training set was calibrated by entering the crude score as a covariate in a logistic regression model, with the dependent variable being day 100 OM. The quality of the score after calibration was evaluated through a reliability diagram, which verified that in each score interval, defined according to the deciles, the mean score was consistent with the observed proportions of events.22,23The prediction model’s discrimina-tion was assessed using the area under the receiver operating characteristics curve (AUC). AUCs were computed as time-dependent receiver operating characteristic curves, and comparisons were performed by the time re-ceiver operating characteristic software.24
RESULTS Patient Characteristics
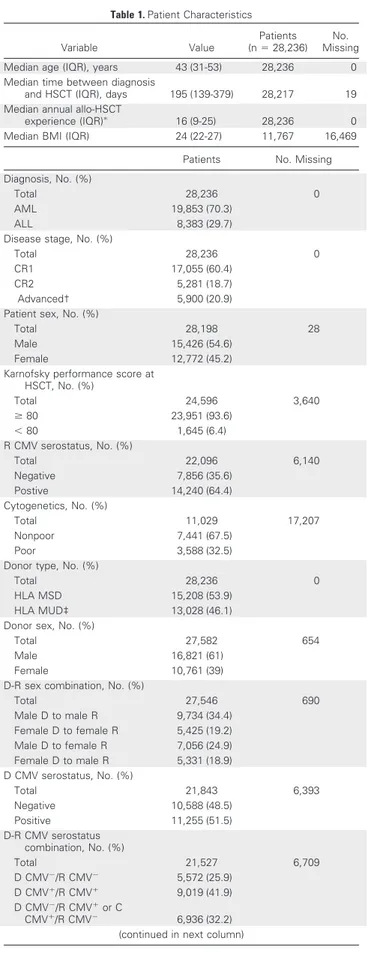
The characteristics of 28,236 analyzed patients are listed in
Table 1. The median follow-up time was 45 months. Most patients had acute myeloid leukemia (70%), were in first complete remission (CR1; 60%), and received myeloablative conditioning (MAC; 71.5%).
Grafts from matched sibling donors were used in 53.9% of patients. The graft source was mainly peripheral blood (78%). OM and NRM prevalence at day 100 were 13.9% (n 5 3,936) and 10.4% (n 5 2,928), respectively. Relapse incidence before 100 days was 9.6% (n 5 2,714). Infection and graft-versus-host disease were the leading causes of day 100 NRM (Data Supplement). The training and validation data sets were similar in terms of baseline variables, except for donor’s sex and recipient-donor sex combination (Data Supplement).
ADT Model Output
On the basis of the training set, a prediction model for day 100 OM was developed. We applied the ADT algorithm on the training set and optimized parameters (Data Supplement) through 10-fold cross validation.Figure 1depicts the graphical output of the ADT predic-tion model. The ADT algorithm selected 10 of 20 variables (Fig 1and
Table 1. Patient Characteristics
Variable Value
Patients (n 5 28,236)
No. Missing
Median age (IQR), years 43 (31-53) 28,236 0
Median time between diagnosis
and HSCT (IQR), days 195 (139-379) 28,217 19
Median annual allo-HSCT
experience (IQR)p 16 (9-25) 28,236 0
Median BMI (IQR) 24 (22-27) 11,767 16,469
Patients No. Missing
Diagnosis, No. (%)
Total 28,236 0
AML 19,853 (70.3)
ALL 8,383 (29.7)
Disease stage, No. (%)
Total 28,236 0
CR1 17,055 (60.4)
CR2 5,281 (18.7)
Advanced† 5,900 (20.9)
Patient sex, No. (%)
Total 28,198 28
Male 15,426 (54.6)
Female 12,772 (45.2)
Karnofsky performance score at HSCT, No. (%) Total 24,596 3,640 $ 80 23,951 (93.6) , 80 1,645 (6.4) R CMV serostatus, No. (%) Total 22,096 6,140 Negative 7,856 (35.6) Postive 14,240 (64.4) Cytogenetics, No. (%) Total 11,029 17,207 Nonpoor 7,441 (67.5) Poor 3,588 (32.5)
Donor type, No. (%)
Total 28,236 0
HLA MSD 15,208 (53.9)
HLA MUD‡ 13,028 (46.1)
Donor sex, No. (%)
Total 27,582 654
Male 16,821 (61)
Female 10,761 (39)
D-R sex combination, No. (%)
Total 27,546 690 Male D to male R 9,734 (34.4) Female D to female R 5,425 (19.2) Male D to female R 7,056 (24.9) Female D to male R 5,331 (18.9) D CMV serostatus, No. (%) Total 21,843 6,393 Negative 10,588 (48.5) Positive 11,255 (51.5) D-R CMV serostatus combination, No. (%) Total 21,527 6,709 D CMV2/R CMV2 5,572 (25.9) D CMV1/R CMV1 9,019 (41.9) D CMV2/R CMV1or C CMV1/R CMV2 6,936 (32.2)
(continued in next column)
Table 1. Patient Characteristics (continued)
Patients No. Missing
Year of HSCT, No. (%) Total 28,236 0 2000-2003 6,607 (23.4) 2004-2007 9,815 (34.8) 2008-2011 11,814 (41.8) Conditioning, No. (%) Total 27,238 998
MAC with TBI 10,815 (39.7)
MAC without TBI 8,670 (31.8)
RIC 7,753 (28.5)
Previous autograft, No. (%)
Total 28,236 0 Negative 27,264 (96.6) Positive 972 (3.4) GVHD prevention, No. (%) Total 22,980 5,256 Other 13,993 (60.9) ATG 7,558 (32.9)
Ex vivo T-cell depletion 1,429 (6.2) Source of stem cells, No. (%)
Total 28,236 0
PB or BM 1 PB 22,113 (78.3)
BM 6,123 (21.7)
Overall mortality at day 100, No. (%) Total 28,236 0 Negative 24,300 (86.1) Positive 3,936 (13.9) NRM at day 100, No. (%) Total 28,236 0 Negative 25,308 (89.6) Positive 2,928 (10.4)
Abbreviations: ALL, acute lymphoblastic leukemia; AML, acute myeloid leukemia; ATG, antithymocyte globulin; BM, bone marrow; BMI, body mass index; CMV, cytomegalovirus; CR1, first complete remission; CR2, second complete remission; D, donor; GVHD, graft-versus-host disease; HSCT, he-matopoietic stem-cell transplantation; IQR, interquartile range; MAC, myelo-ablative conditioning; MSD, matched sibling donor; MUD, matched unrelated donor; NRM, nonrelapse mortality; PB, peripheral blood; R, recipient; RIC, reduced-intensity conditioning; TBI, total body irradiation.
pAnnual allogeneic transplantations done in the individual center, and re-ported to the European Group for Blood and Marrow Transplantation, in the year the transplantation was performed.
†All other stages.
‡HLA allelic level compatibility: 10 of 10 (n 5 4,619), 9 of 10 (n 5 2,099), , 9 of 10 (n 5 1,363), and missing (n 5 4,947).
Table 2). Independent variables for the primary objective were disease stage, Karnofsky performance score, donor type, recipient-donor cytomegalovirus (CMV) serostatus, and HSCT year, whereas age, diagnosis, days from diagnosis to transplantation, conditioning
regimen, and annual number of transplantations were dependent variables.
Selected interactions discovered by the tree include the following: patients with acute myeloid leukemia who received transplantation in CR2 had a lower risk of OM when compared with patients with acute lymphoblastic leukemia who received transplantation in the same stage (prediction node weight, 20.074 and 0.152, respectively); a shorter duration (, 142 days) between diagnosis and transplantation in CR1 or advanced-stage patients was associated with lower OM (node weight, 20.144). However, this effect was abrogated in patients age 46 years or older (node weight, 0.148). In the same disease stage categories (CR1 and advanced), older patients (age $ 37 years) receiv-ing reduced-intensity conditionreceiv-ing had lower OM risk (node weight, 20.144) when compared with MAC. In transplantations from matched unrelated donors, center experience ($ 20 transplantations/ year) positively affected outcomes.
The year range of transplantation was incorporated in the predic-tion model, because HSCTs performed after 2003 were associated with lower day 100 OM rates. Nevertheless, it was not entered in the online user interface, because the model’s aim is prospective outcome prediction. Thus, the year range is predefined in the Web site as 2004 and on.
0.065
0.442 -0.178 -0.057 0.493 0.236 -0.053 0.064 -0.065 0.102 -0.035 -0.12 -0.001
1: Disease st. = Advanced
12: Dx = AML 4: Age < 37 years
-0.144 3 1 1 . 0 -3 8 0 . 0 6 5 0 . 0 4 4 1 . 0 -3 1 . 0 -2 5 1 . 0 4 7 0 . 0 - 0.06 0.077 -0.095 0.148 5: Days from dx < 142
6: Conditioning = RIC 10: Age < 46 years
8: No. of annual HSCTs < 20
2: Karnofsky PS ≥ 80 3: Disease st. = CR2 7: D-type = MUD 9: HSCT year = 2000-2003 11: D-R CMV = both neg o N o N o N o N o N o N Yes s e Y s e Y s e Y s e Y No No No No Yes No Yes No s e Y s e Y s e Y s e Y s e Y
Fig 1. Alternating decision tree (ADT) prediction model for overall mortality (OM) at day 100. The ADT consists of alternating levels of prediction (ellipses) and decision nodes (rectangle). Each prediction node is associated with a weight, representing its contribution to the cumulative prediction score, whereas each decision node contains a splitting attribute. The iteration number in which the decision node was introduced is described by the number on the left side of the decision node and is inversely correlated with predictive influence. Variables are not mutually exclusive. Patients traverse the tree according to their features (ie, variable values), and the cumulative score is calculated. For example, the cumulative prediction score for a patient with the following features (plotted as black arrows on the tree): received transplantation in CR2, a Karnofsky performance score of 90, diagnosed with acute myeloid leukemia, received transplantation from a matched unrelated donor (MUD) in 2011, and both recipient and donor are cytomegalovirus (CMV) sero-negative, is 20.099 (0.065 2 0.178 2 0.057 1 0.236 2 0.074 1 0.064 2 0.035 2 0.12) . The score is transformed into an individualized probability of day 100 OM (10.7% for the above example) and provides the output for the online user interface. Only 6 of the 10 variables included in the model were necessary for score calculation in this patient. No. of annual hematopoietic stem-cell transplantations (HSCTs) represents the No. of annual allogeneic HSCTs performed in the individual center in the year the transplantation was performed. AML, acute myeloid leukemia; CR, complete remission; D, donor; Disease st., disease stage; dx, diagnosis; neg, negative; PS, performance score; R, recipient; RIC, reduced-intensity conditioning.
Table 2. Variables Selected by the ADT Prediction Model for Day 100 OM
Variable
Boosting Iteration (predictive
influence) Independent Dependent
Disease stage 1 and 3 1 —
Karnofsky at HSCT 2 1 —
Age 4 and 10 — 1
Days between diagnosis and HSCT 5 — 1
Conditioning regimen 6 — 1
Donor type 7 1 —
Annual allo-HSCT experience 8 — 1
Year of HSCT 9 1 —
D-R CMV serostatus combination 11 1 —
Diagnosis 12 — 1
Abbreviations: ADT, alternating decision tree; CMV, cytomegalovirus; D, donor; HSCT, hematopoietic stem-cell transplantation; OM, overall mortality; R, recipient.
Prediction of Day 100 OM
Before calibration, individual patient scores ranged from 20.812 to 1.389. After calibrating the validation set, day 100 OM probabilities ranged from 3% to 68%. Consistency between predicted and observed probabilities for primary objectives was excellent (Fig 2).
The ADT model’s discrimination for the primary objective out-performed the EBMT score (AUC, 0.702 v 0.646; P 5 3 · 10218). Predictive performance of the Cox model (Data Supplement), when compared with a subset of patients with available information on all 10 variables included, did not differ from the ADT model (AUC, 0.693 v 0.697; P 5 .38; Data Supplement).
Prediction of Long-Term Outcomes
Probabilities of 2-year outcomes in each score interval for secondary objectives are summarized in Table 3and Figure 3. Cumulative incidence of 2-year NRM was 38.2% (95% CI, 34.7% to 41.7%) for patients included in the highest score interval, with a corresponding Kaplan-Meier estimate of OS and LFS of 19.9% (95% CI, 17% to 22.9%) and 17.5% (95% CI, 14.7% to 20.3%), respectively. Probabilities of 2-year NRM, OS, and LFS, for patients in the lowest score interval, were 9.8% (95% CI, 7.9% to 12%), 72% (95% CI, 68.8% to 75.1%), and 64.9% (95% CI, 61.6% to 68.2%), respectively. Relapse incidence was not predicted by the score. Discrimination of the ADT model for 2-year OS outper-formed the EBMT score and did not differ when compared with the Cox model (Data Supplement).
DISCUSSION
Eligibility of patients with AL for allo-HSCT is based on a risk-benefit assessment of the relapse risk versus transplantation risk.25 By applying the ADT algorithm, we have developed a novel
predic-tion model on the basis of 10 variables for day 100 OM. Scores correlated with objectives, enabling an individual continuous probabilistic evaluation of the primary objective (ie, OM at day 100) and a discretized risk assessment of secondary objectives at 2 years (OS, NRM, and LFS).
Insights can be derived from the tree-like structure of the model and variable weights (Fig 1andTable 2). Disease stage and perfor-mance status were strong outcome determinants, corroborating pre-vious studies.26,27Earlier years (2000 to 2003) were associated with a worse outcome, reflecting advances in the field.1An advantage of the ADT is its ability to detect interactions. For instance, the effect of the interval between diagnosis and transplantation, with a cutoff of 142 days, had impact only for certain disease stages (ie, CR1 and ad-vanced). Thus, specific characteristics of unique subpopulations were captured, and the cutoff set by the EBMT score of 1 year for all disease stages was refined.3A threshold of 20 transplantations or more per year in matched unrelated donors was associated with better outcomes, again stressing the importance of center experi-ence and accreditation.28-30 Not surprisingly, reduced-intensity conditioning was a favorable prognostic factor when compared with MAC in older patients (age $ 37 years), corroborating inter-actions between age and conditioning. Interestingly, age was not an independent risk variable. It seems that transplantation practice and patient selection have downgraded age importance with re-spect to outcome.31
The ADT algorithm was able to detect variables associated with the primary outcome, assign weights, and ignore redundancies (eg, the recipient-donor CMV serostatus combination was selected, whereas individual CMV status, donor or recipient, was excluded). Body mass index and cytogenetics may play a role as prognostic factors,5,32but were not selected, possibly because of many missing values. Transplantation from a female donor to a male recipient has also been associated with mortality in previous studies,3but was not selected in the current study, because it mainly affects late mortality. Differences in variable selection compared with previ-ous allo-HSCT prognostic studies probably reflect different mea-sures of predictive importance assessment. Models augment, rather than contradict, one another. Their integration may lead to improved predictive accuracy.
The EBMT score is a well-recognized tool for adjusting trans-plantation analysis. The ADT model showed improved discrimina-tion, although relatively small, in comparison to the EBMT score (AUC, 0.701 v 0.646; P , .001). Nevertheless, one must keep in mind that the EBMT score was designed for prediction of long-term sur-vival; thus, comparison with our score is not trivial, because primary end points differ. In addition, the ADT score allows a continuous and personalized risk assessment for day 100 OM, as opposed to other contemporary scores, which focus on identification of prognostic groups.3-5,7Moreover, when contemplating a transplantation, one must take into account specific patient history (eg, the interval from diagnosis to transplantation does not have the same impact in CR1 or CR2).33Such interactions are not necessarily captured by standard statistical models.
Stratifying OM risk at 100 days by collapsing score intervals into different risk groups would lead to loss of important clin-ical information. By providing a continuous measure for patient risk, we transformed the prediction problem from a classifica-tion task to a regression task, and we enhanced physician and 0 100-Day Mortality (%) Score 40 30 20 10 5 10 15 20 25 30 35 40 R = 0.996
Fig 2. The alternating decision tree score calibration plot. Mean predicted probability of overall mortality at day 100 for each categorized score interval was plotted against observed proportions of events. R, correlation coefficient.
Table 3. Score Intervals and Associated Outcomes on the Validation Set Calibrated Score (OM) Intervals
Interval Serial No.
Patients, No. CId of 100-Day NRM KM est of 100-Day OS CId of 2-Year NRM KM est of 2-Year LFS KM est of 2-Year OS CId of 2-Year RI KM est of 5-Year OS 2.95-5.54 1 856 2.8 (1.9 to 4.1) 96.4 (95.1 to 97.6) 9.8 (7.9 to 12) 64.9 (61.6 to 68.2) 72 (68.8 to 75.1) 25.3 (22.3 to 28.4) 61.5 (57.8 to 65.2) 5.55-6.51 2 873 5.7 (4.3 to 7.4) 92.7 (90.9 to 94.4) 15.7 (13.3 to 18.3) 60.6 (57.2 to 64) 67.3 (64 to 70.6) 23.7 (20.8 to 26.8) 57.8 (54 to 61.6) 6.52-8.09 3 819 5.8 (4.3 to 7.5) 91.9 (90.1 to 93.8) 18.6 (16 to 21.4) 54.6 (51.1 to 58.1) 62.3 (58.9 to 65.8) 26.8 (23.7 to 29.9) 53.2 (49.4 to 56.9) 8.10-9.28 4 866 7.4 (5.8 to 9.3) 91.8 (90 to 93.6) 19.3 (16.7 to 22.1) 56.8 (53.4 to 60.2) 63.8 (60.5 to 67.2) 23.9 (21 to 26.9) 56.4 (52.8 to 60.1) 9.29-10.44 5 840 8.1 (6.4 to 10.1) 90.6 (88.6 to 92.6) 22.8 (19.9 to 25.8) 54.2 (50.6 to 57.7) 58.8 (55.3 to 62.4) 23 (20.1 to 26) 50.1 (46.2 to 54) 10.45-12.37 6 866 9.5 (7.7 to 11.6) 88.8 (86.7 to 90.9) 21.9 (19.1 to 24.8) 52.4 (48.9 to 55.9) 60.2 (56.8 to 63.7) 25.7 (22.7 to 28.8) 50.8 (47 to 54.5) 12.40-15.08 7 876 11.2 (9.2 to 13.4) 86.1 (83.8 to 88.4) 22.6 (19.9 to 25.5) 51.2 (47.8 to 54.7) 55.6 (52.2 to 59) 26.2 (23.1 to 29.2) 48.4 (44.8 to 52) 15.10-19.20 8 787 14.3 (12 to 16.9) 81.1 (78.3 to 83.9) 24.3 (21.3 to 27.5) 35.9 (32.3 to 39.4) 42.8 (39.1 to 46.5) 39.8 (36.6 to 43) 34.2 (30.5 to 38) 19.23-27.22 9 929 16.1 (13.8 to 18.5) 76.2 (73.5 to 78.9) 28.3 (25.4 to 31.3) 26.7 (23.7 to 29.7) 32.1 (29 to 35.2) 45 (41.9 to 48.1) 23.9 (20.9 to 26.9) 27.25-67.99 10 779 24 (21.1 to 27.1) 61.8 (58.4 to 65.2) 38.2 (34.7 to 41.7) 17.5 (14.7 to 20.3) 19.9 (17 to 22.9) 44.3 (41.2 to 47.4) 15.3 (12.5 to 18) NOTE. Data are given as percentage (95% CI). Abbreviations: CId, cumulative incidence; KM est, Kaplan-Meier estimates; LFS, leukemia-free survival; NRM, nonrelapse mortality; OM, overall m ortality; OS, overall survival; RI, relapse incidence.
patient understanding regarding expected transplantation haz-ard. Two-year outcomes, which have previously been shown to predict long-term survival,34were estimated according to the score (by deciles) established for day 100 OM. Thus, potential use was extended, and factors predicting day 100 OM may be surrogates for long-term survival.
The ADT is a classification algorithm designed for handling bi-nary end points, but not censored or continuous end points. There-fore, we focused on a short-term outcome, in a population in which loss to follow-up was lower than 5% and center effect is unlikely, because transplantation volume was not linked to patient loss (Data Supplement). Patients lost had some differing characteristics (Data Supplement); however, given their relatively small number, they are not likely to affect model performance. An important aspect of the current study is the introduction of an alternative approach for prediction model development, rather than comparison with the conventional approach. A DM method has been applied in fields such as communication and finance, and one can think of potential uses in HSCT, because it allows prediction of the outcome of interest without strong assumptions regarding the distribution of the variables and the regression model used.11,12It is reassuring that the Cox and ADT models achieved similar discrimination, stressing the validity of the DM method with short-term transplan-tation data. Nevertheless, alternative methods should be explored for modeling long-term outcomes.35,36
This study has several limitations. First, it is a retrospective analysis susceptible to data selection and measurement biases.37 However, the registry analyzed reflects real world data, conveying contemporary practice.10Second, validation was done on an inter-nal data set, and exterinter-nal validation is warranted. Nonetheless, the many patients in the analysis, the use of 10-fold cross validation for training in addition to a separate validation set, and the model’s excellent calibration, all greatly enhance validity and robustness. Moreover, despite lack of prediction model development
guide-lines, we adhered to strict methodologic principals.23Third, in contrast to the EBMT and HCT-CI scores, which are not disease specific, our score applies only to ALs, which are a leading indica-tion for allo-HSCT transplantaindica-tion1; thus, targeting this patient population is reasonable. Still, the diagnosis variable had low pre-dictive influence, suggesting that the score may be applicable to other diseases. Fourth, given the ADT model complexity, calcula-tion of patient score is nontrivial, as opposed to the EBMT score.3 Therefore, we provided an online interface (http://bioinfo.lnx.biu.ac.il/ ;bondi/web1.html) to enable easy calculation. Finally, the primary objective focused on short-term survival. Nevertheless, our model showed competence in predicting NRM, OM, and LFS at 2 years. In addition, the high rate of day 100 OM (13.9%) highlights its impor-tance as a valid objective.
In conclusion, we present a machine learning– based predic-tion model for mortality after allo-HSCT. The model was devel-oped using a DM approach and internally validated on a large data set with excellent calibration. It can be readily used online and provides a personalized estimation of day 100 OM risk and a discretized estimation of long-term outcomes, and at the same time reveals variables’ interactions. The model’s potential applica-tions include pretransplantation risk assessment and stratification, patient counseling during informed consent sessions, and tailoring transplantation regimens or referring to alternative treatments according to transplantation risk. Predictive accuracy is still not optimal. Integration with the HCT-CI score, detailed data on mod-ifiable therapeutic factors, and data on somatic mutations (eg, Fms-like tyrosine kinase 3 and Nucleophosmin 1) may further enhance predictive power and aid treatment personalization. Hav-ing demonstratHav-ing that the DM approach can be applied to the EBMT registry data, future studies must aim to make more precise predictions for long-term outcomes using the recent methods developed to manage censored data.35,36
AUTHORS’ DISCLOSURES OF POTENTIAL CONFLICTS OF INTEREST
Disclosures provided by the authors are available with this article at
www.jco.org.
AUTHOR CONTRIBUTIONS
Conception and design: Roni Shouval, Ron Unger, Arnon Nagler,
Mohamad Mohty
Financial support: Mohamad Mohty Administrative support: Mohamad Mohty
Collection and assembly of data: Roni Shouval, Myriam Labopin, Fabio
Ciceri, Jordi Esteve, Norbert C. Gorin, Christoph Schmid, Emmanuelle Polge, Nicolaus Kroger, Charles Craddock, Andrea Bacigalupo, Jan J. Cornelissen, Frederic Baron, Arnon Nagler
Data analysis and interpretation: Roni Shouval, Myriam Labopin, Ori
Bondi, Hila Mishan-Shamay, Avichai Shimoni, Fabio Ciceri, Jordi Esteve, Sebastian Giebel, Norbert C. Gorin, Christoph Schmid, Mahmoud Aljurf, Nicolaus Kroger, Charles Craddock, Andrea Bacigalupo, Jan J. Cornelissen, Frederic Baron, Ron Unger, Arnon Nagler, Mohamad Mohty
Manuscript writing: All authors Final approval of manuscript: All authors
0
Overall Survival (probability)
Time (years) 1.0 0.8 0.6 0.4 0.2 1 2 3 4 5 2.95−5.54 5.55−6.51 6.52−8.09 8.10−9.28 9.29−10.44 10.45−12.37 12.40−15.08 15.10−19.20 19.23−27.22 27.25−67.99
Fig 3. Kaplan-Meier curves of overall survival stratified by the categorized alternating decision tree score. Higher scores (ie, higher score interval number) resulted in lower probability of survival. Calibrated score intervals are described (seeTable 3).
REFERENCES
1. Gooley TA, Chien JW, Pergam SA, et al: Reduced mortality after allogeneic hematopoietic-cell transplantation. N Engl J Med 363:2091-2101, 2010
2. Hamadani M, Craig M, Awan FT, et al: How we approach patient evaluation for hematopoietic stem-cell transplantation. Bone Marrow Transplan-tation 45:1259-1268, 2010
3. Gratwohl A, Stern M, Brand R, et al: Risk score for outcome after allogeneic hematopoietic stem-cell transplantation: A retrospective analysis. Cancer 115:4715-4726, 2009
4. Parimon T, Au DH, Martin PJ, et al: A risk score for mortality after allogeneic hematopoietic cell transplantation. Ann Intern Med 144:407-414, 2006
5. Sorror ML, Maris MB, Storb R, et al: Hema-topoietic cell transplantation (HCT)-specific comor-bidity index: A new tool for risk assessment before allogeneic HCT. Blood 106:2912-2919, 2005
6. Raimondi R, Tosetto A, Oneto R, et al: Validation of the hematopoietic cell transplantation-specific comor-bidity index: A prospective, multicenter GITMO study. Blood 120:1327-1333, 2012
7. Versluis J, Labopin M, Niederwieser D, et al: Prediction of non-relapse mortality in recipients of reduced intensity conditioning allogeneic stem-cell transplantation with AML in first complete remis-sion. Leukemia 29:51-57, 2015
8. Nakaya A, Mori T, Tanaka M, et al: Does the hematopoietic cell transplantation specific comor-bidity index (HCT-CI) predict transplantation out-comes? A prospective multicenter validation study of the Kanto study group for cell therapy. Biol Blood Marrow Transplantation 20:1553-1559, 2014
9. Barba P, Martino R, Perez-Simon JA, et al: Combination of the hematopoietic cell transplanta-tion comorbidity index and the European Group for Blood and Marrow Transplantation score allows a better stratification of high-risk patients undergoing reduced-toxicity allogeneic hematopoietic cell trans-plantation. Biol Blood Marrow Transplantation 20: 66-72, 2014
10. Lauer MS, D’Agostino RB Sr: The randomized registry trial: The next disruptive technology in clin-ical research? N Engl J Med 369:1579-1581, 2013
11. Shouval R, Bondi O, Mishan H, et al: Applica-tion of machine learning algorithms for clinical pre-dictive modeling: A data-mining approach in SCT. Bone Marrow Transplantation 49:332-337, 2014
12. Breiman L: Statistical modeling: The two cul-tures (with comments and a rejoinder by the author). Stat Sci 16:199-231, 2001
13. Maroco J, Silva D, Rodrigues A, et al: Data mining methods in the prediction of dementia: A real-data comparison of the accuracy, sensitivity and specificity of linear discriminant analysis, logistic regression, neural networks, support vector ma-chines, classification trees and random forests. BMC Res Notes 4:299, 2011
14. Witten IH, Frank E, Hall MA: Data Mining: Practical Machine Learning Tools and Techniques (ed 3). Burlington, MA, Morgan Kaufmann, 2011
15. Gooley TA, Leisenring W, Crowley J, et al: Estimation of failure probabilities in the presence of competing risks: New representations of old estima-tors. Stat Med 18:695-706, 1999
16. Kaplan EL, Meier P: Nonparametric estima-tion from incomplete observaestima-tions. J Am Stat Assoc 53:457-481, 1958
17. MED-AB Forms Manual. http://www.ebmt.org/ Contents/Data-Management/Registrystructure/MED-ABdatacollectionforms/Documents/MED-ABForms Manual.pdf
18. Freund Y, Mason L: The alternating decision tree learning algorithm. ICML 99:124-133, 1999
19. Rao VS, Kumar MN: A new intelligence-based approach for computer-aided diagnosis of Dengue fever. IEEE Trans Inf Technol Biomed 16:112-118, 2012
20. Takada M, Sugimoto M, Naito Y, et al: Predic-tion of axillary lymph node metastasis in primary breast cancer patients using a decision tree-based model. BMC Med Inform Decis Mak 12:54, 2012
21. Takada M, Sugimoto M, Ohno S, et al: Predic-tions of the pathological response to neoadjuvant chemotherapy in patients with primary breast can-cer using a data mining technique. Breast Cancan-cer Res Treat 134:661-670, 2012
22. DeGroot MH, Fienberg SE: The comparison and evaluation of forecasters. Statistician 32:12-22, 1983
23. Royston P, Moons KG, Altman DG, et al: Prognosis and prognostic research: Developing a prognostic model. BMJ 338:b604, 2009
24. Blanche P, Dartigues JF, Jacqmin-Gadda H: Estimating and comparing time-dependent areas under receiver operating characteristic curves for censored event times with competing risks. Stat Med 32:5381-5397, 2013
25. Cornelissen JJ, Gratwohl A, Schlenk RF, et al: The European LeukemiaNet AML Working Party consensus statement on allogeneic HSCT for patients with AML in remission: An integrated-risk adapted approach. Nat Rev Clin Oncol 9:579-590, 2012
26. Shimoni A, Hardan I, Shem-Tov N, et al: Allogeneic hematopoietic stem-cell transplantation in AML and MDS using myeloablative versus reduced-intensity conditioning: The role of dose intensity. Leukemia 20:322-328, 2006
27. Sorror M, Storer B, Sandmaier BM, et al: Hematopoietic cell transplantation-comorbidity in-dex and Karnofsky performance status are indepen-dent predictors of morbidity and mortality after allogeneic nonmyeloablative hematopoietic cell transplantation. Cancer 112:1992-2001, 2008
28. Frassoni F, Labopin M, Powles R, et al: Acute Leukaemia Working Party of the European Group for Blood and Marrow Transplantation: Effect of centre on outcome of bone-marrow transplantation for acute myeloid leukaemia. Lancet 355:1393-1398, 2000
29. Giebel S, Labopin M, Mohty M, et al: The impact of center experience on results of reduced intensity: Allogeneic hematopoietic SCT for AML—An analysis from the Acute Leukemia Working Party of the EBMT. Bone Marrow Transplantation 48:238-242, 2012
30. Gratwohl A, Brand R, Niederwieser D, et al: Introduction of a quality management system and outcome after hematopoietic stem-cell transplanta-tion. J Clin Oncol 29:1980-1986, 2011
31. Corradini P, Zallio F, Mariotti J, et al: Effect of age and previous autologous transplantation on non-relapse mortality and survival in patients treated with reduced-intensity conditioning and allografting for advanced hematologic malignancies. J Clin On-col 23:6690-6698, 2005
32. Tallman MS, Dewald GW, Gandham S, et al: Impact of cytogenetics on outcome of matched unrelated donor hematopoietic stem-cell transplan-tation for acute myeloid leukemia in first or second complete remission. Blood 110:409-417, 2007
33. Gratwohl A: The EBMT risk score. Bone Mar-row Transplantation 47:749-756, 2012
34. Wingard JR, Majhail NS, Brazauskas R, et al: Long-term survival and late deaths after allogeneic hematopoietic cell transplantation. J Clin Oncol 29: 2230-2239, 2011
35. Binder H, Allignol A, Schumacher M, et al: Boosting for high-dimensional time-to-event data with competing risks. Bioinformatics 25:890-896, 2009
36. Mogensen UB, Gerds TA: A random forest approach for competing risks based on pseudo-values. Stat Med 32:3102-3114, 2013
37. Ward RA, Brier ME: Retrospective analyses of large medical databases: What do they tell us? J Am Soc Nephrol 10:429-432, 1999
Affiliations
Roni Shouval, Hila Mishan-Shamay, Avichai Shimoni, and Arnon Nagler, The Chaim Sheba Medical Center, Tel-Hashomer; Roni Shouval, Ori Bondi, and Ron Unger, Bar-Ilan University, Ramat-Gan, Israel; Myriam Labopin, Norbert C. Gorin, Emmanuelle Polge, Arnon Nagler, and Mohamad Mohty, European Group for Blood and Marrow Transplantation; Myriam Labopin and Mohamad Mohty, Sorbonne Universités, Centre de Recherche (CDR) Saint-Antoine; Myriam Labopin and Mohamad Mohty, Institut National de la Santé et de la Recherche Médicale, CDR Antoine; Myriam Labopin and Mohamad Mohty, Assistance Publique–Hôpitaux de Paris, Hôpital Saint-Antoine, Paris, France; Fabio Ciceri, San Raffaele Scientific Institute, Milan; Andrea Bacigalupo, Ospedale San Martino, Genoa, Italy; Jordi Esteve, Institut d’Investigacions Biomèdiques August Pi i Sunyer, Barcelona, Spain; Sebastian Giebel, Maria Sklodowska-Curie Memorial Cancer Center and Institute of Oncology, Gliwice, Poland; Christoph Schmid, Ludwig-Maximilians-University, Munich; Nicolaus Kroger, University Medical Center Hamburg Eppendorf, Hamburg, Germany; Mahmoud Aljurf, King Faisal Specialist Hospital & Research Centre, Riyadh, Saudi Arabia; Charles Craddock, Queen Elizabeth Hospital, Birmingham, United Kingdom; Jan J. Cornelissen, Erasmus University Medical Center, Rotterdam, the Netherlands; and Frederic Baron, University of Liège, Liège, Belgium.
AUTHORS’ DISCLOSURES OF POTENTIAL CONFLICTS OF INTEREST
Prediction of Allogeneic Hematopoietic Stem-Cell Transplantation Mortality 100 Days After Transplantation Using a Machine Learning Algo-rithm: A European Group for Blood and Marrow Transplantation Acute Leukemia Working Party Retrospective Data Mining Study
The following represents disclosure information provided by authors of this manuscript. All relationships are considered compensated. Relationships are self-held unless noted. I 5 Immediate Family Member, Inst 5 My Institution. Relationships may not relate to the subject matter of this manuscript. For more information about ASCO’s conflict of interest policy, please refer towww.asco.org/rwcorjco.ascopubs.org/site/ifc.
Roni Shouval No relationship to disclose Myriam Labopin No relationship to disclose Ori Bondi No relationship to disclose Hila Mishan-Shamay No relationship to disclose Avichai Shimoni No relationship to disclose Fabio Ciceri No relationship to disclose Jordi Esteve No relationship to disclose Sebastian Giebel No relationship to disclose Norbert C. Gorin
Travel, Accommodations, Expenses: Celgene Christoph Schmid
Honoraria: Novartis, Fresenius Biotech SE, Roche
Patents, Royalties, Other Intellectual Property: Novartis (Inst) Travel, Accommodations, Expenses: MSD
Emmanuelle Polge No relationship to disclose Mahmoud Aljurf No relationship to disclose Nicolaus Kroger No relationship to disclose Charles Craddock
Honoraria: Celgene, Novartis, Pfizer Consulting or Advisory Role: Celgene Research Funding: Celgene (Inst) Andrea Bacigalupo No relationship to disclose Jan J. Cornelissen No relationship to disclose Frederic Baron No relationship to disclose Ron Unger No relationship to disclose Arnon Nagler No relationship to disclose Mohamad Mohty No relationship to disclose
Acknowledgment